


Written by:

Reviewed by:

- February 28, 2025
- 30 min read
Wyckoff Distribution Trading Guide
What is a Wyckoff Distribution Pattern?
A Wyckoff Distribution pattern is a portion of the Wyckoff Method used as a technical analysis framework to identify where large institutional investors begin to offload their holdings after a significant uptrend. This phase signals the transition from a bullish market to a bearish one, characterised by specific price and volume behaviours.
Key elements include a Buying Climax (BC), where prices peak with high volume, followed by an Automatic Reaction (AR) indicating a pullback, and subsequent Secondary Tests (ST) that fail to reach previous highs, often with diminishing volume.
Recognising this pattern is crucial for traders as it indicates the onset of increased supply over demand, leading to potential price declines. Understanding these dynamics allows traders to anticipate market reversals and adjust their strategies accordingly to mitigate risks and capitalise on short-selling opportunities.
Who is Richard Wyckoff
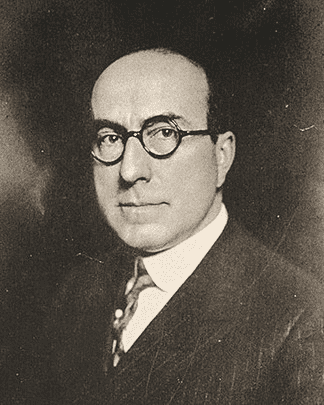
Richard D. Wyckoff was a pioneering stock market trader and analyst in the early 20th century, known for developing the Wyckoff Method, which remains influential in technical analysis. His work focused on understanding market behaviour through patterns of accumulation and distribution, and his techniques continue to guide traders in identifying significant market trends and reversals.
Wyckoff Methodology in 5 steps
The Wyckoff Methodology offers a structured approach to stock selection and trade entry. Here are the five key steps to follow:
1. Analyse the Current Market Position and Future Trend
This step involves analysing the current market trend and identifying the phase of the market cycle. Wyckoff categorised market trends into three phases: accumulation, markup, and distribution.
By studying price charts and volume patterns, traders can determine if the market is in a phase of accumulation (where smart money is buying), markup (where prices are rising), or distribution (where smart money is selling). This analysis helps predict the probable future direction of the market.
2. Choose Stocks that Match the Market Trend
Once the market trend is identified, the next step is to select individual stocks that align with this trend. During an accumulation phase, traders look for stocks that are also in their own accumulation phases, showing signs of strength and potential for upward movement.
Conversely, in a distribution phase, traders focus on stocks that are exhibiting weakness and are likely to decline in price. This step ensures that stock selections are in harmony with the overall market direction.
3. Identify Stocks with Sufficient Cause for Your Objective
Wyckoff’s third step involves calculating the potential price movement of a stock using the “cause” built during the accumulation or distribution phase. This cause is measured by the horizontal count of the point-and-figure chart, which Wyckoff used to estimate price targets. By comparing the cause to the potential objective, traders can select stocks with significant upside potential or downside risk, ensuring that the reward justifies the investment.
4. Assess the Stocks’ Readiness for Movement
Wyckoff then provided key signals to determine if a stock was ready to make its move. Within the accumulation phase, traders will look for specific price and volume patterns that indicate the stock is poised for a breakout.
Key signals include a reduction in volatility, a contraction in volume, and the formation of price patterns such as springs (false breakdowns) or upthrusts (false breakouts). These patterns suggest that the stock is building energy for a substantial price movement.
5. Align Your Trade Timing with Market Turns
The final step in Wyckoff’s process for stock picking is to time the trade entry with a turn in the overall market. This step underscores the importance of aligning individual stock trades with broader market movements.
By entering trades when the market index confirms the anticipated trend, traders can increase the chance of success. This timing involves monitoring market indices for confirmation signals such as breaking key support or resistance levels or exhibiting strong price and volume action in the direction of the trade.
Wyckoff’s Composite Man
When teaching the Wyckoff Method to others, Wyckoff introduced the concept of the “Composite Man” as a way to understand market movements and price behaviour. This heuristic tool helps traders visualise market activity as if it were driven by a single, strategic entity. The Composite Man is a theoretical figure representing the collective actions of large institutional investors and market manipulators and does not represent a single entity, but the concept does make learning the market movements, and patterns a little easier.
Wyckoff’s idea of the Composite Man is rooted in the observation that large operators carefully plan and execute their trading strategies to maximise profits. They accumulate shares quietly and sell them at rising prices, often manipulating the market to create favourable conditions for their trades.
Wyckoff advised traders to approach the market with the mindset of the Composite Man, which involves a couple key principles.
Master Puppeteer
The Composite Man is often likened to a master puppeteer, skillfully manipulating the market to his advantage. By understanding this metaphor, traders can better grasp how large institutional investors control price movements and use this knowledge to make informed decisions.
Crafty Strategist
As a crafty strategist, the Composite Man carefully plans his market moves, ensuring minimal detection and maximum profit. Recognizing these strategic manoeuvres helps traders anticipate major market shifts and adjust their trading strategies accordingly.
Smart Money Magnet
The Composite Man acts as a smart money magnet, attracting retail investors into the market through strategic price movements. By identifying the actions of this smart money, traders can align their trades to capitalise on emerging opportunities and avoid common pitfalls.
Wyckoff Price Cycle
According to Richard D. Wyckoff, the market’s movements can be understood and anticipated through a detailed analysis of supply and demand. Supply and demand can be observed by studying price action and volume.
Wyckoff’s insights were shaped by his experience as a broker, where he closely observed the activities of influential traders and institutions that dominated specific stocks. By employing vertical (bar) and Point and Figure charts, Wyckoff was able to decode the strategies and future intentions of these major market players.
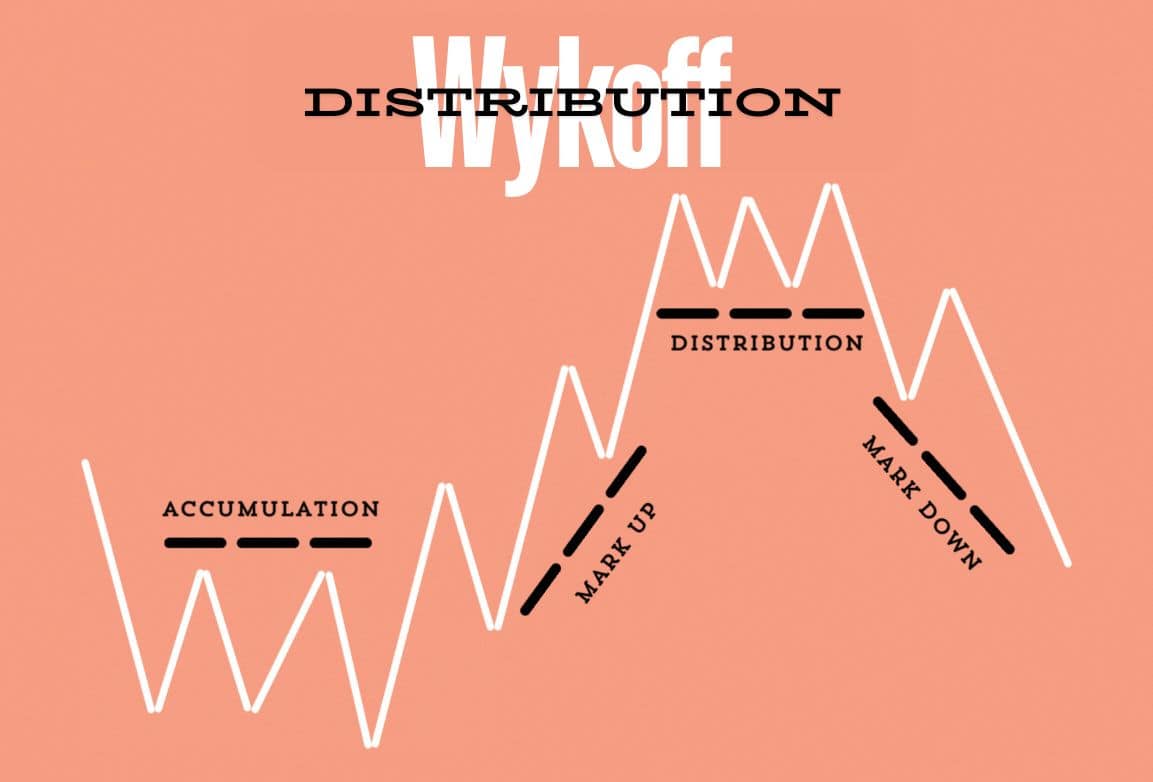
Wyckoff conceptualised the market in terms of a price cycle, which he divided into distinct phases: accumulation, markup, distribution, and markdown. Each phase reflects the behaviour of large interests as they prepare for and execute their market strategies.
Accumulation Phase
The accumulation phase marks the beginning of the price cycle. During this period, large investors, or the Composite Man, quietly build substantial positions in a stock without driving up the price. This phase is characterised by a trading range where the stock’s price moves sideways. Key signals of accumulation include increasing volume on up days and decreasing volume on down days, indicating that strong hands are absorbing supply from weaker hands.
Markup Phase
Once accumulation is complete, the market enters the markup phase. This is when prices start to rise as demand outstrips supply. The Composite Man begins to advertise his stock, creating an appearance of strength and attracting public interest. This phase is characterised by higher highs and higher lows, with significant price increases often accompanied by strong volume. Traders aim to enter long positions towards the end of the accumulation phase to capitalise on any subsequent expected markup.
Distribution Phase
Following the markup phase, the market enters the distribution phase. Here, the Composite Man gradually sells off his accumulated shares to the public at higher prices. This phase is marked by another trading range where prices move sideways or slightly upwards. During distribution, there is a noticeable increase in volume on down days, signalling that large interests are offloading their positions. Traders should be cautious and look for signs of weakness and increased selling pressure. During the distribution phase, upthrusts can be sold.
Markdown Phase
The final phase of the Wyckoff price cycle is the markdown phase. As the distribution phase concludes, the market enters a period of declining prices. Supply overwhelms demand, leading to lower highs and lower lows. The Composite Man has successfully distributed his holdings, and the market sentiment turns bearish. This is the time for traders to consider short positions, anticipating further price declines. Volume typically increases on down days during this phase, confirming selling pressure in the declining trend.
By understanding these phases and of the Wyckoff price cycle, traders can better anticipate market movements and identify optimal entry and exit points. The key lies in recognising the signs of accumulation, markup, distribution, and markdown, and aligning one’s trading strategy with the underlying market dynamics.
Three Wyckoff Laws
Richard D. Wyckoff formulated three foundational laws that are central to his method of technical analysis. These laws—supply and demand, cause and effect, and effort versus result—provide a framework for understanding and predicting market movements.
The Law of Supply and Demand
This law is the cornerstone of Wyckoff’s methodology. It states that the price of an asset moves according to the balance between supply (selling pressure) and demand (buying pressure). When demand exceeds supply, prices rise; when supply exceeds demand, prices fall. By analysing price and volume data, traders can gauge whether supply or demand is dominant and make informed trading decisions. For instance, a significant price increase accompanied by high volume suggests strong demand and likely further price appreciation.
The Law of Cause and Effect
Wyckoff’s second law explains that market movements are the result of prior accumulation (cause) and distribution (effect). The length and depth of a price trend can be anticipated by measuring the horizontal price movement within a trading range. This law helps traders set price targets by analysing the “cause” built during accumulation or distribution phases. For example, a prolonged accumulation phase within the accumulation trading range can lead to a substantial price increase once the markup phase begins.
The Law of Effort Versus Result
This law posits that the effort, measured by volume, must be consistent with the result, seen in price movement. If there is a discrepancy between effort and result, it signals a potential change in trend.
For example, if high volume (effort) fails to produce significant price movement (result), it indicates that the prevailing trend may be weakening. Conversely, a strong price move on relatively low volume suggests an efficient market move, often signalling continuation of the trend.
Analysing the Wyckoff Distribution Process
The Wyckoff Distribution process is an important component of the Wyckoff Method as it provides traders with valuable insights into market dynamics and trading strategies. Understanding this process can help traders identify when the market may be topping and share prices falling during the subsequent markdown.
Psychology of Distribution
In the distribution phase, institutional investors offload their holdings to the public. The market may appear bullish, but smart money is quietly selling, creating an illusion of demand. Once the institutional investors have offloaded their shares, the price then falls in a markdown.
Price Action Analysis Techniques
Analyzing price action involves studying the historical price movements of an asset to predict its probable future trend. Traders use this analysis to identify key price levels, such as support and resistance. Traders look for signs such as lower highs and increased selling pressure, indicating the onset of distribution.
Identifying Key Price Levels
Key price levels, including support and resistance, play a significant role in the Wyckoff Distribution process. Resistance levels are crucial as they often mark points where distribution intensifies and price reversals occur. Identifying these levels helps traders navigate the trading range effectively and where institutional investors may be selling. Volume analysis is often used alongside price levels to confirm price movements as institutional investors sell in large volumes.
Volume Analysis
Volume analysis is a critical tool in the Wyckoff Distribution process, as it reveals the intensity of selling activities. By examining trading volume patterns, traders can confirm price movements and identify shifts in market sentiment. Increased volume on down days signals distribution, as smart money sells into rallies.
Market Structure
Understanding the broader market structure is vital for validating the distribution pattern. Look for phases of preliminary supply, buying climax, automatic reaction, and secondary tests to confirm distribution.
By analysing these aspects, traders can effectively identify the Wyckoff Distribution Pattern and make informed decisions to capitalise on the ensuing downtrend.
How to Identify the Wyckoff Distribution Pattern?
Step 1: Buying Climax, Automatic Reaction, Secondary Test
- Buying Climax (BC):
- This is the initial phase where a substantial amount of buying occurs, driving the price to new highs. The buying climax is typically marked by a rapid price increase on high volume, reflecting the final efforts of retail investors and traders jumping into the market.
- Automatic Reaction (AR):
- Following the buying climax, the price experiences a swift decline as the initial wave of buying pressure subsides. This reaction is the market’s natural response to the excessive buying and marks the start of the trading range.
- Secondary Test (ST):
- The secondary test occurs when the price revisits the level of the buying climax to test the balance between supply and demand. If the price fails to reach the previous high or if volume decreases, it suggests that the market is beginning to weaken.
Step 2: Sign of Weakness (SoW) and Upthrust
- Sign of Weakness (SoW):
- This phase is marked by increased selling pressure and a failure to achieve new highs. The market shows signs of weakness as demand diminishes, and selling becomes more dominant.
- Upthrust (UT):
- An upthrust occurs when the price temporarily breaks above the trading range, creating a false impression of strength. This move typically traps late buyers and allows smart money to sell at higher prices before the price reverses back into the range.
Step 3: Upthrust After Distribution (UTAD)
- Upthrust After Distribution (UTAD):
- This phase represents the final effort by smart money to distribute their holdings at the highest possible prices. The price reaches a peak, often characterized by a sharp but short-lived rise, followed by a rapid decline back into the trading range.
Step 4: Last Point of Supply (LPSY)
- Last Point of Supply (LPSY):
- In this phase, the price shows a series of lower highs and lower lows within the trading range. The market tests the support levels but fails to rally significantly, indicating that supply is overwhelming demand.
Step 5: Trend to the Downside
- Markdown and Price Decline:
- This phase marks the beginning of the markdown phase, where the price breaks below the support level of the trading range and begins a new downtrend. The breakdown is typically accompanied by high volume and increased selling pressure.
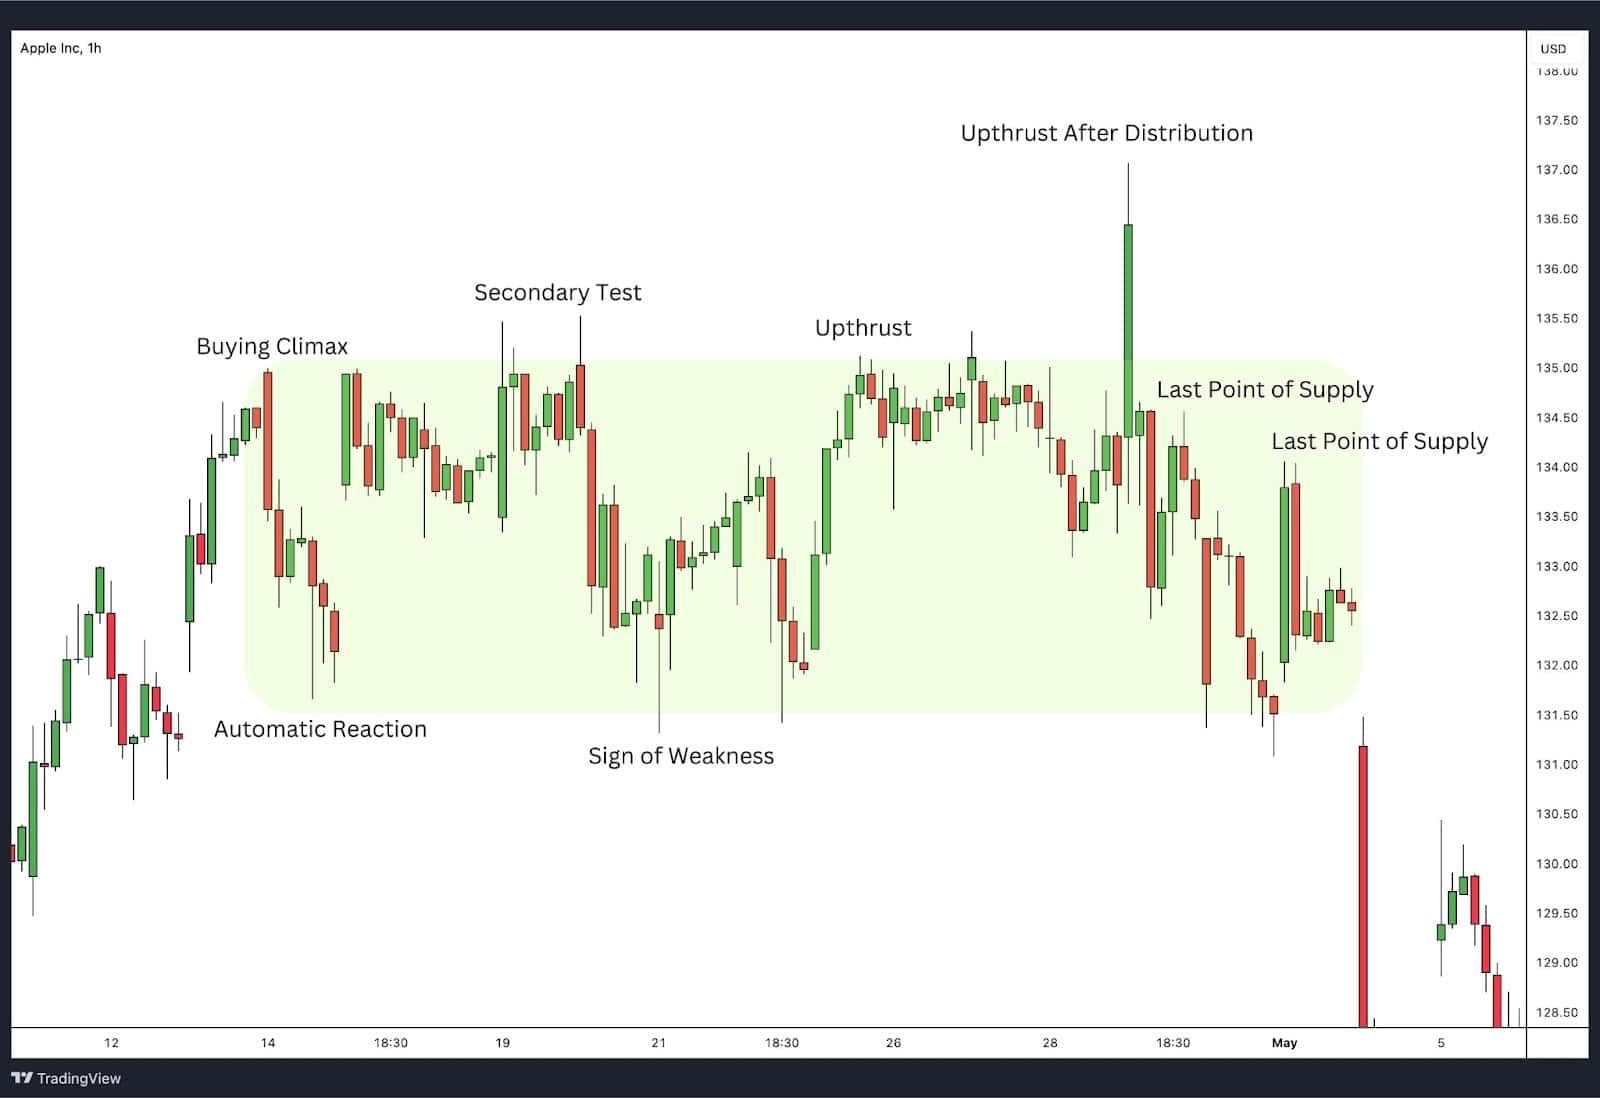
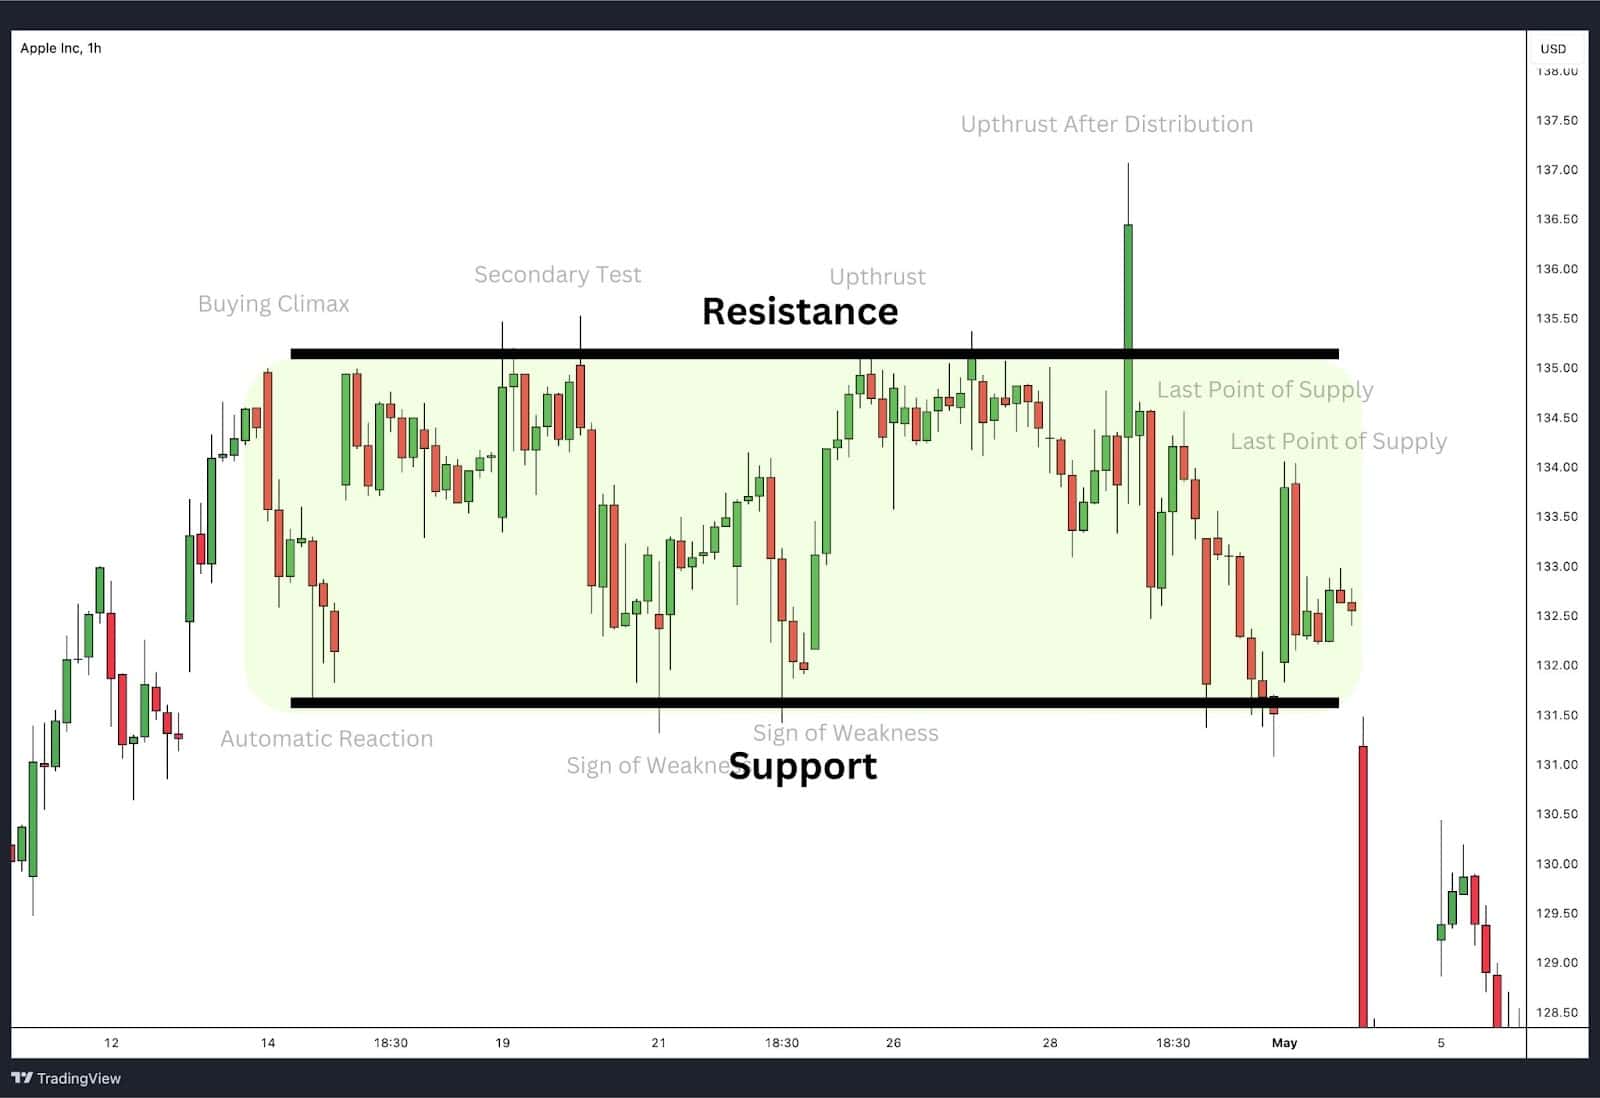
The chart above for Apple Inc. illustrates a classic Wyckoff Distribution pattern. It begins with a Buying Climax (BC), where the price peaks, followed by an Automatic Reaction (AR), where the price drops sharply. A Secondary Test (ST) confirms the trading range, as the price attempts to revisit the climax level but fails.
During Step 2, we observe a Sign of Weakness (SoW), where the price shows lower highs and increased volatility, and an Upthrust (UT), which is a false breakout above the trading range.
Step 3 features an Upthrust After Distribution (UTAD), where the price reaches a new peak before falling back into the range.
Step 4 marks the Last Point of Supply (LPSY), indicating the final efforts of distribution with lower highs and higher lows.
Finally, in Step 5, the price breaks down below the support, confirming the start of a downtrend.
Wyckoff Distribution Examples
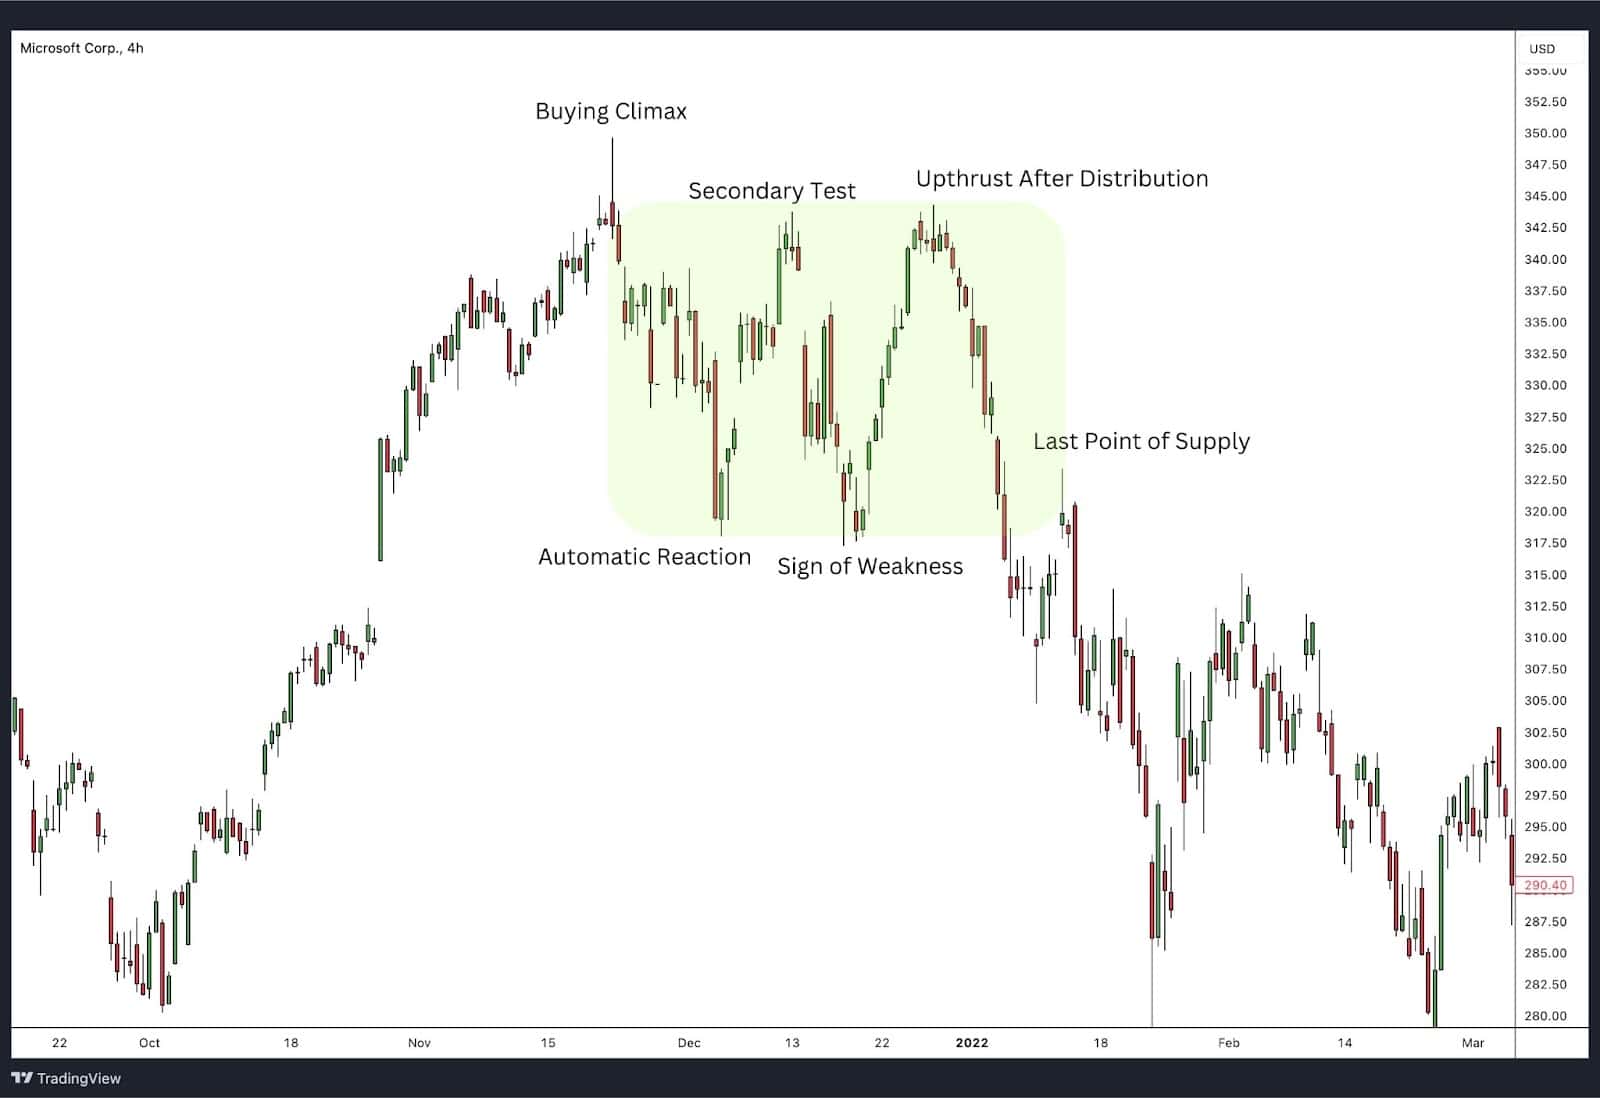
Microsoft Corp. (MSFT) Chart Analysis
Step 1: Buying Climax, Automatic Reaction, Secondary Test
Buying Climax (BC):
- Characteristics: Microsoft experienced a significant price rise marking the buying climax. This indicates a peak in buying activity from retail investors.
- Indicators: Sharp price increase, high trading volume, large bullish candlesticks.
Automatic Reaction (AR):
- Characteristics: Following the buying climax, the price dropped sharply, reflecting a decrease in buying pressure and the beginning of a trading range.
- Indicators: Rapid price decline, lower volume compared to the buying climax, significant bearish candlesticks.
Secondary Test (ST):
- Characteristics: The price tested the previous high, failing to reach the buying climax level, indicating weakening demand.
- Indicators: Attempt to revisit the high, lower volume, and smaller price movements.
Step 2: Sign of Weakness (SoW) and Upthrust
Sign of Weakness (SoW):
- Characteristics: During this phase, Microsoft’s stock displayed lower highs and increased volatility, signifying reduced buying interest.
- Indicators: Lower highs, increased volatility, higher selling volume.
Upthrust (UT):
- Characteristics: The stock price temporarily broke above the trading range, misleading traders into buying before reversing back into the range.
- Indicators: Temporary breakout above resistance, increased volume on the breakout, quick reversal.
Step 3: Upthrust After Distribution (UTAD)
Upthrust After Distribution (UTAD):
- Characteristics: The price reached a new peak briefly before falling back, representing the final effort of smart money to sell at high prices.
- Indicators: Sharp rise to a new high, significant volume, quick reversal back into the range.
Step 4: Last Point of Supply (LPSY)
Last Point of Supply (LPSY):
- Characteristics: Lower highs and lows within the trading range, failing to rally significantly as supply overwhelms demand.
- Indicators: Series of lower highs and lows, decreased volume on upswings, increased volume on downswings.
Step 5: Rally to the Downside
Rally to the Downside:
- Characteristics: The price broke below the trading range support, marking the beginning of a new downtrend.
- Indicators: Breakdown below support, significant increase in volume, strong bearish movement, sustained downtrend.
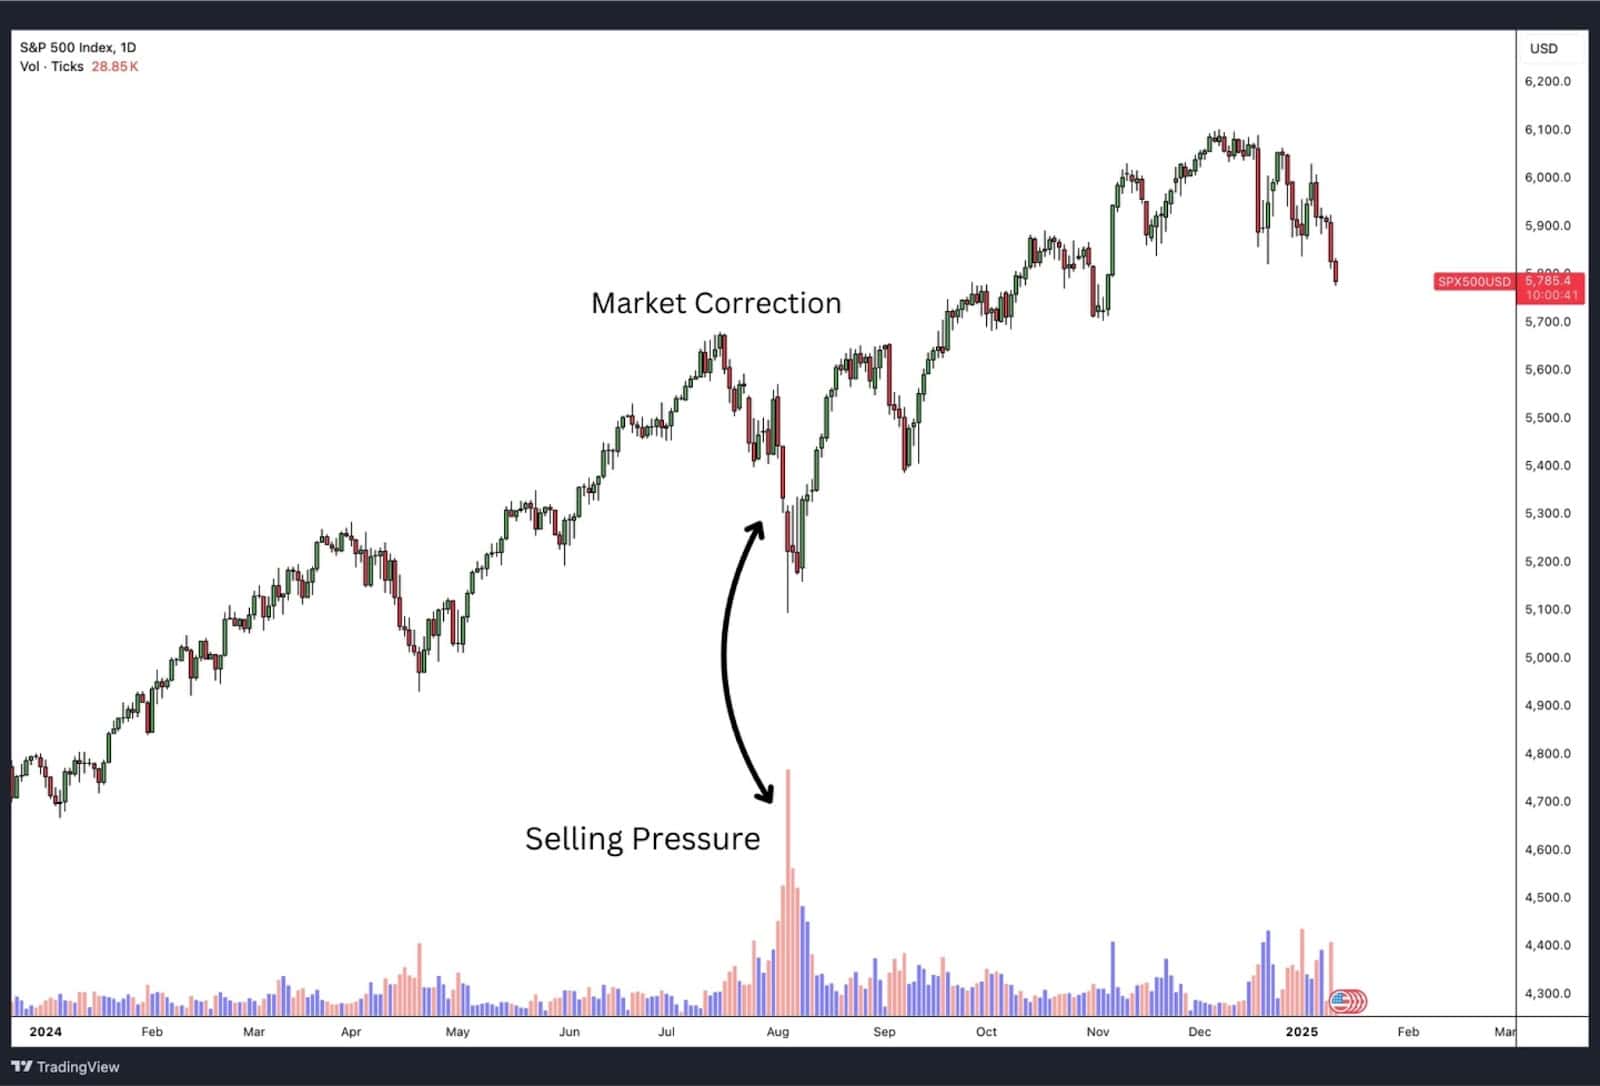
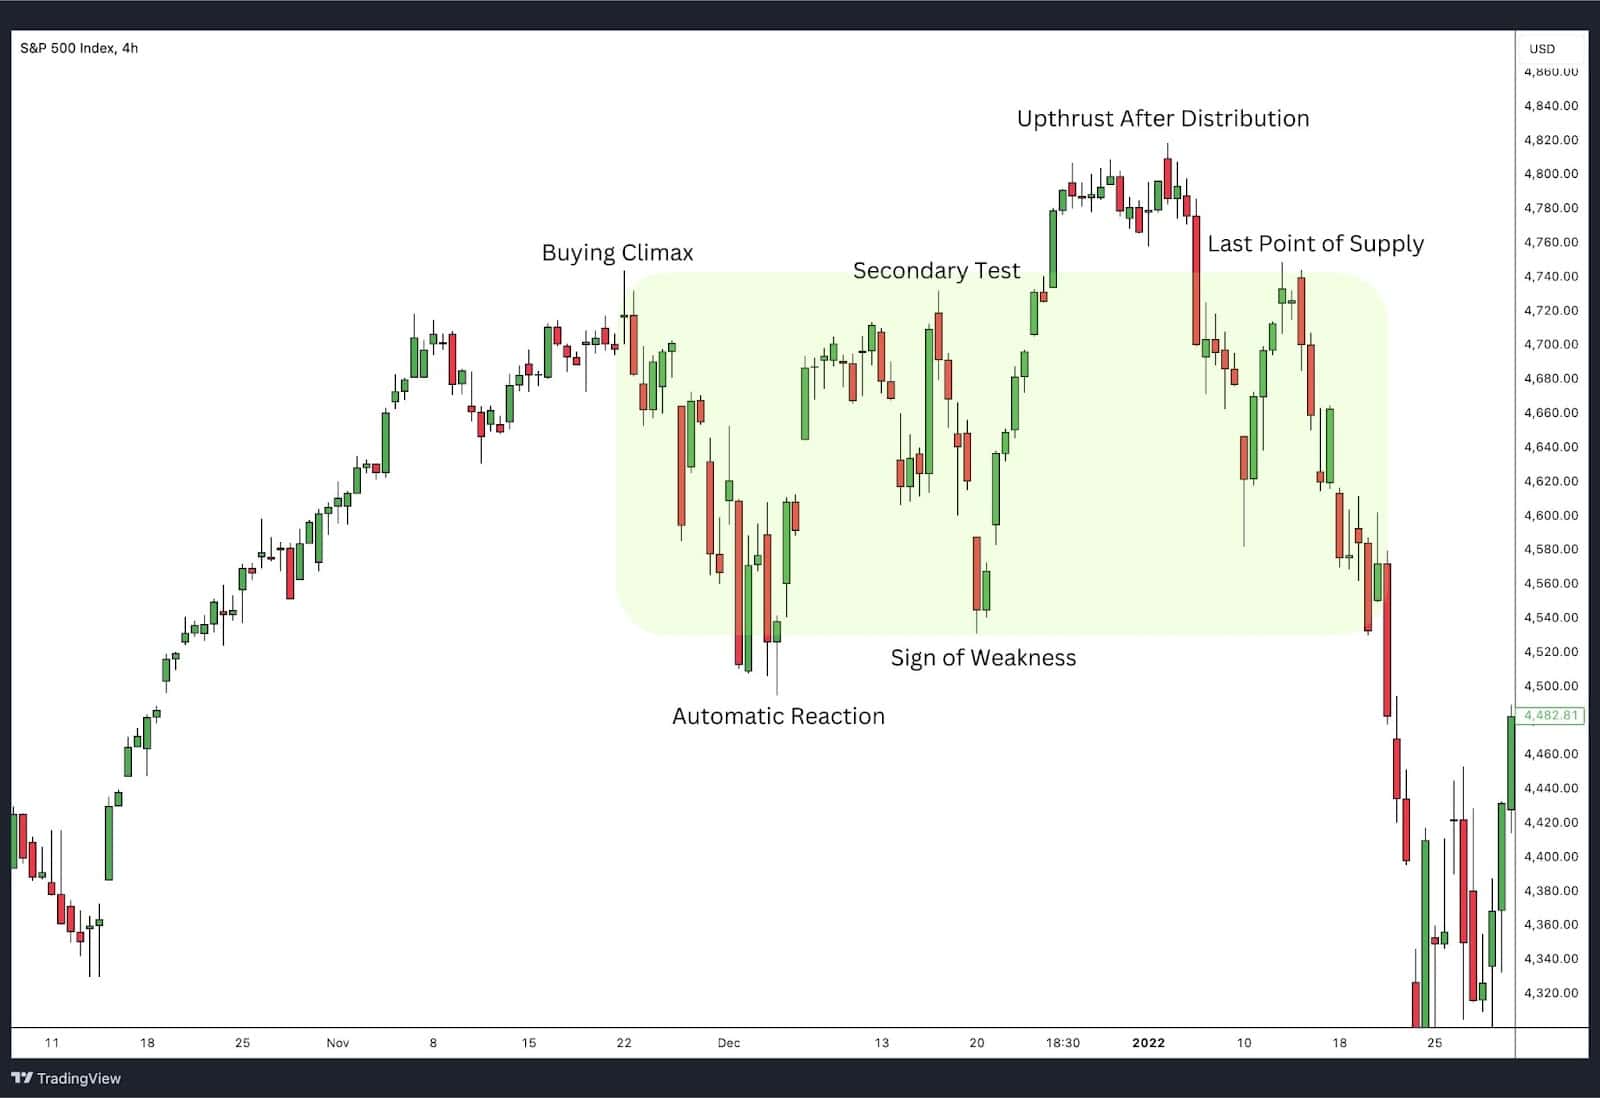
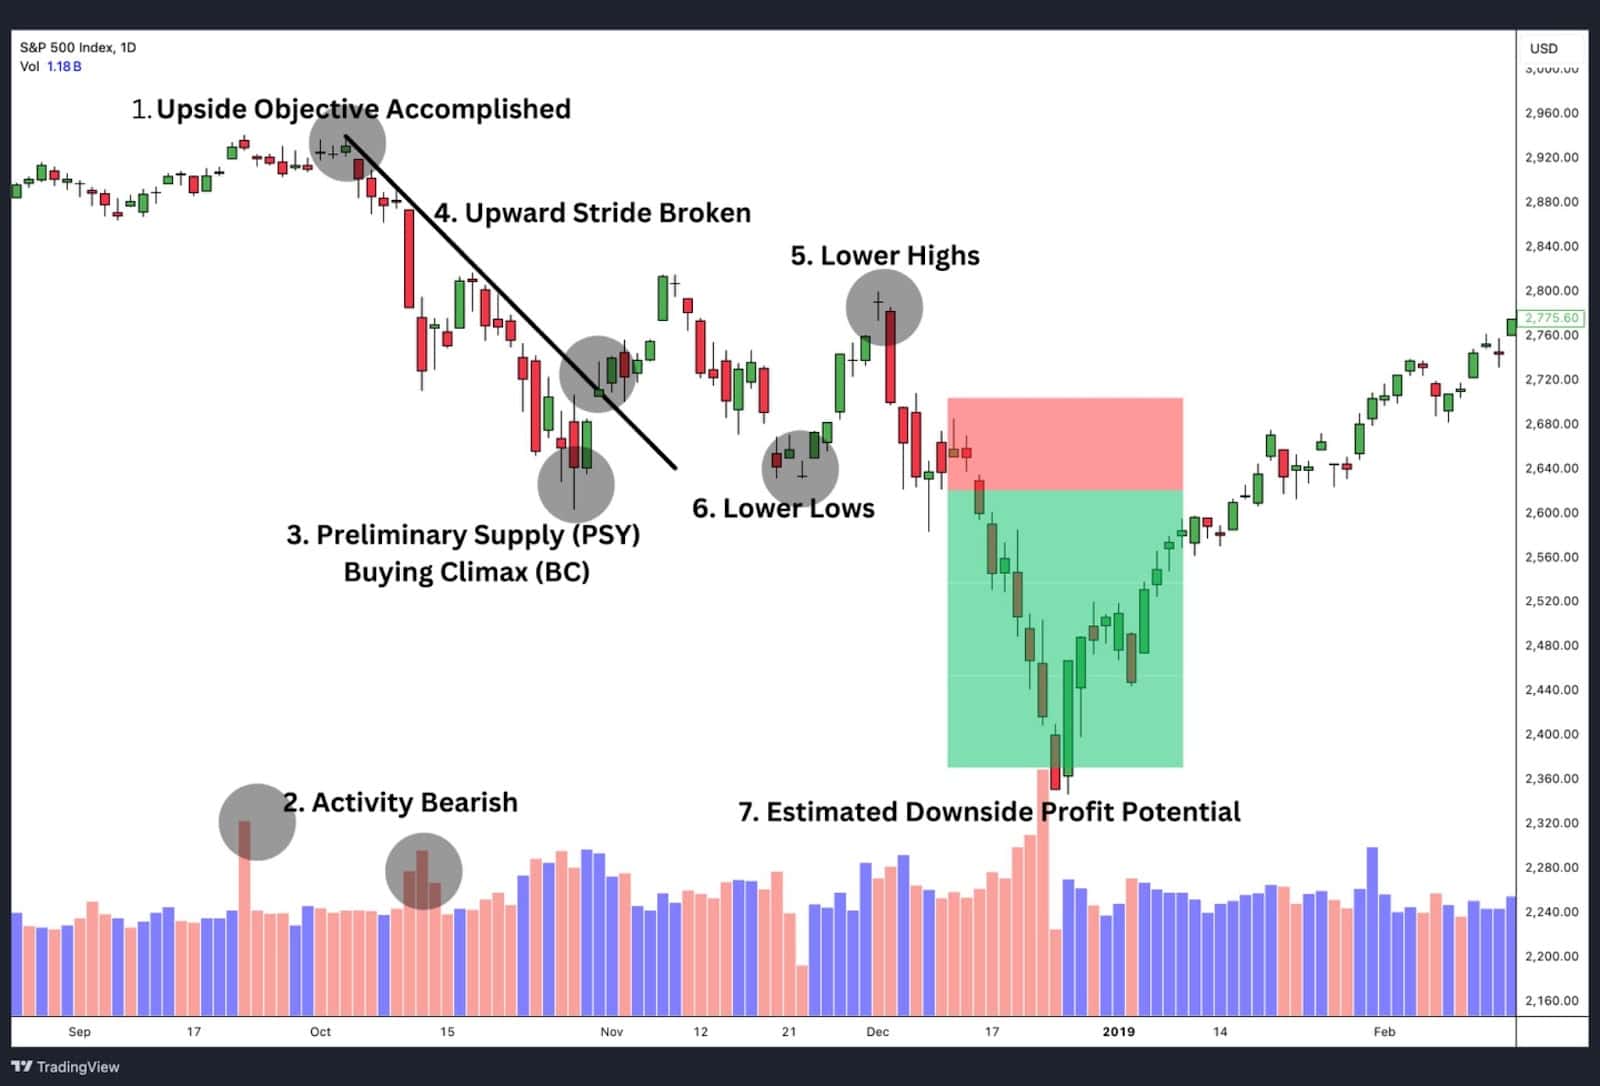
S&P 500 Index (SPX) Chart Analysis
Step 1: Buying Climax, Automatic Reaction, Secondary Test
Buying Climax (BC):
- Characteristics: The S&P 500 index reached a peak and marked a resistance, marking the end of a strong uptrend.
- Indicators: Sharp price rise, high trading volume, large bullish candlesticks.
Automatic Reaction (AR):
- Characteristics: The price dropped sharply following the buying climax, entering a trading range.
- Indicators: Rapid price decline, decreased volume, significant bearish candlesticks.
Secondary Test (ST):
- Characteristics: The price attempted to retest the previous high but failed, indicating the start of a distribution phase.
- Indicators: Price revisits previous high, lower volume, smaller price movements.
Step 2: Sign of Weakness (SoW) and Upthrust
Sign of Weakness (SoW):
- Characteristics: Lower highs and increased volatility signalled weakening demand.
- Indicators: Lower highs, increased volatility, higher selling volume.
Upthrust (UT):
- Characteristics: A temporary breakout above the trading range that reversed back into the range, trapping buyers.
- Indicators: Temporary breakout, increased volume on the breakout, quick reversal.
Step 3: Upthrust After Distribution (UTAD)
Upthrust After Distribution (UTAD):
- Characteristics: The price reached a new high briefly before falling back, indicating the final distribution effort.
- Indicators: Sharp rise to a new high, significant volume, quick reversal.
Step 4: Last Point of Supply (LPSY)
Last Point of Supply (LPSY):
- Characteristics: Continued lower highs and lower lows, showing persistent supply and inability to rally.
- Indicators: Lower highs and lows, decreased volume on upswings, increased volume on downswings.
Step 5: Rally to the Downside
Rally to the Downside:
- Characteristics: The price broke below the trading range support, starting a new downtrend.
- Indicators: Breakdown below support, increased volume, strong bearish movement, sustained downtrend.
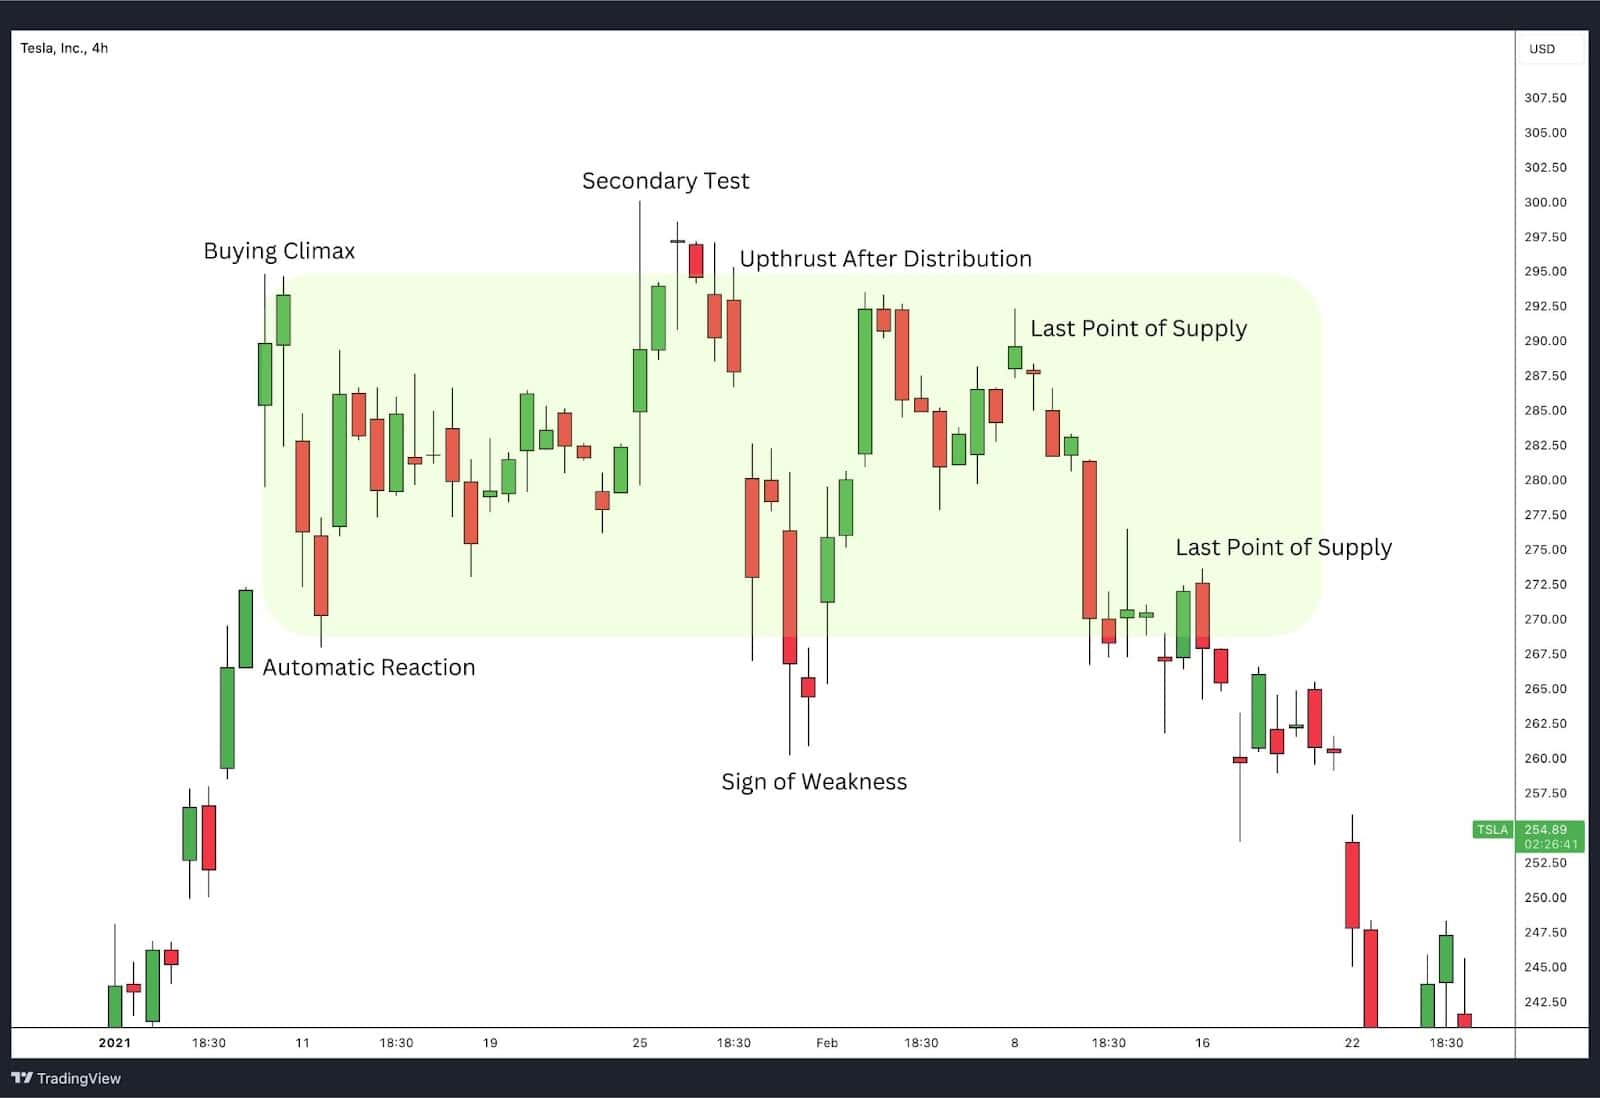
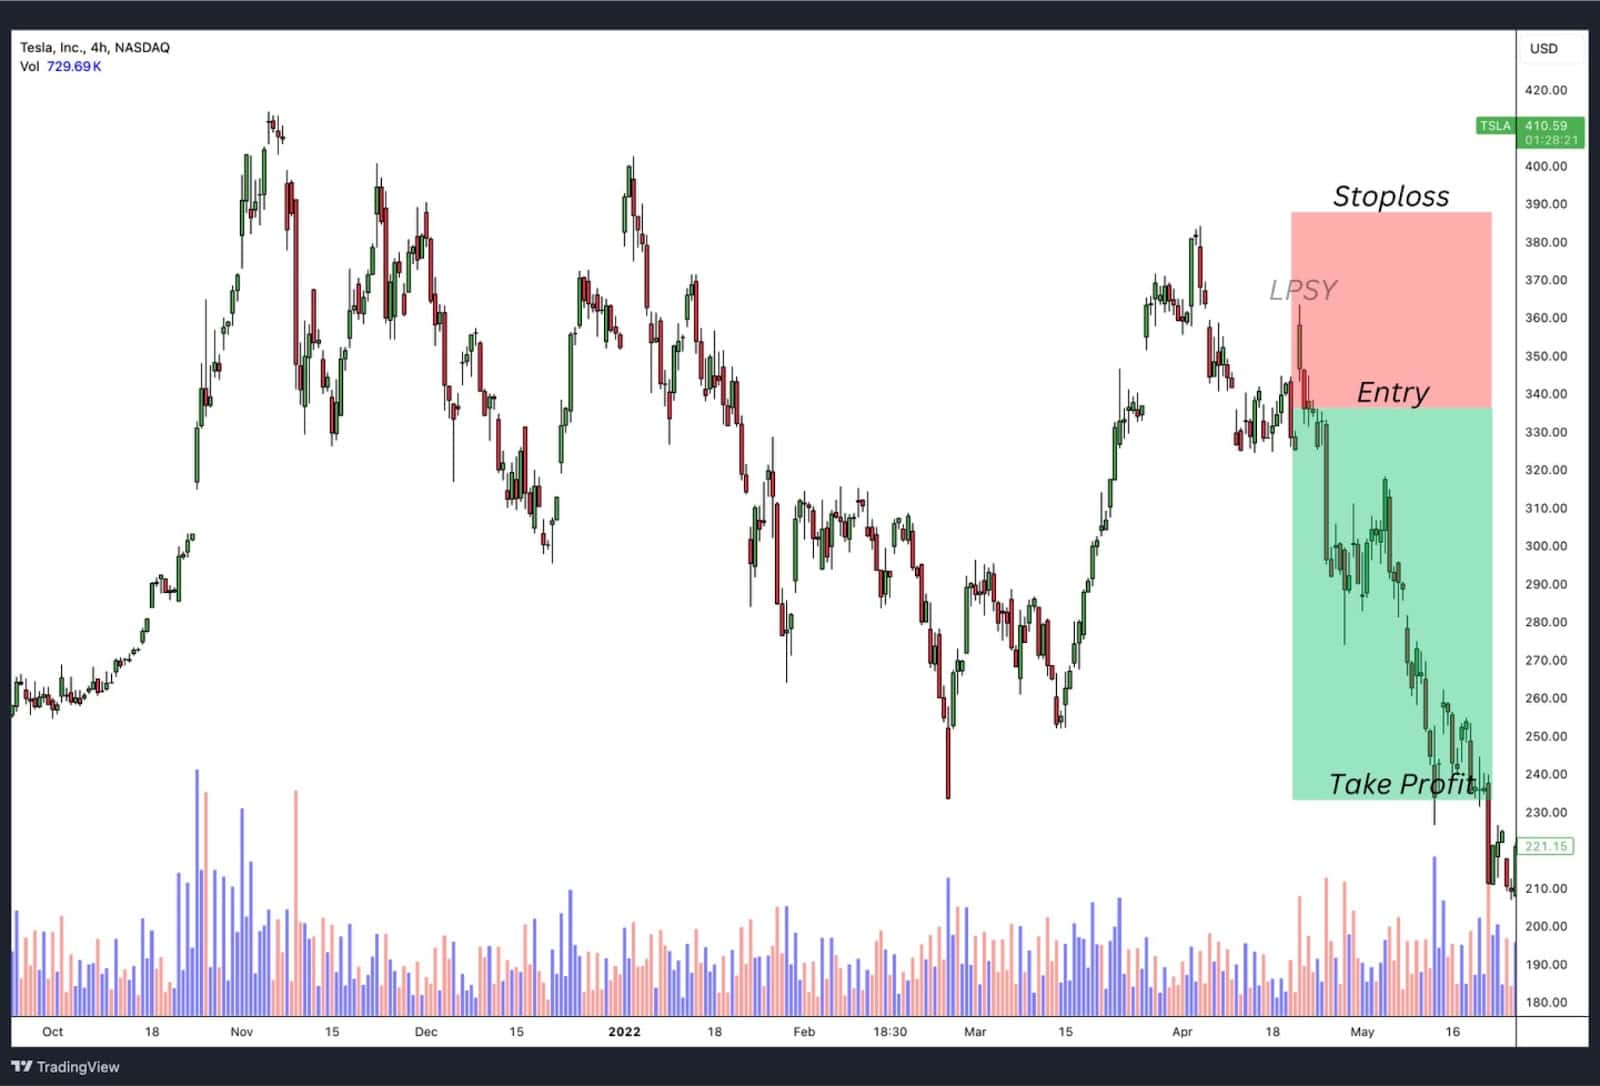
Tesla Inc. (TSLA) Chart Analysis
Step 1: Buying Climax, Automatic Reaction, Secondary Test
Buying Climax (BC):
- Characteristics: Tesla reached a peak, signalling the end of an uptrend.
- Indicators: Sharp price rise, high trading volume, large bullish candlesticks.
Automatic Reaction (AR):
- Characteristics: The price dropped sharply after the buying climax, starting a trading range.
- Indicators: Rapid price decline, lower volume, significant bearish candlesticks.
Secondary Test (ST):
- Characteristics: The price attempted to revisit the previous high but failed, indicating the distribution phase.
- Indicators: Price revisits previous high, lower volume, smaller price movements.
Step 2: Sign of Weakness (SoW) and Upthrust
Sign of Weakness (SoW):
- Characteristics: Lower highs and increased volatility, showing a reduction in buying pressure.
- Indicators: Lower highs, increased volatility, higher selling volume.
Upthrust (UT):
- Characteristics: A temporary breakout above the trading range that quickly reversed, trapping buyers.
- Indicators: Temporary breakout, increased volume on the breakout, quick reversal.
Step 3: Upthrust After Distribution (UTAD)
Upthrust After Distribution (UTAD):
- Characteristics: The price reached a new high briefly before falling back, showing the final distribution effort.
- Indicators: Sharp rise to a new high, significant volume, quick reversal.
Step 4: Last Point of Supply (LPSY)
Last Point of Supply (LPSY):
- Characteristics: Continued lower highs and lower lows within the trading range, indicating persistent supply.
- Indicators: Lower highs and lows, decreased volume on upswings, increased volume on downswings.
Step 5: Rally to the Downside
Rally to the Downside:
- Characteristics: The price broke below the trading range support, initiating a new downtrend.
- Indicators: Breakdown below support, increased volume, strong bearish movement, sustained downtrend.
By breaking down these charts into their respective Wyckoff Distribution steps, traders can better understand the underlying market dynamics better.
Wyckoff Distribution Pattern Trading Strategies
Trading the Wyckoff Distribution pattern effectively involves recognising its distinct phases and using specific strategies tailored to each phase. Here’s a detailed look at how to trade using the Wyckoff Distribution Pattern:
1. Recognise Key Phases:
- Preliminary Supply (PSY): Initial signs of selling pressure as smart money starts to distribute shares.
- Buying Climax (BC): A peak in buying activity followed by significant selling, indicating the end of an uptrend.
- Automatic Reaction (AR): A sharp decline following the buying climax, showing increased selling pressure.
- Secondary Test (ST): A test of the buying climax’s highs with lower volume, confirming the distribution phase.
- Upthrust (UT): A false breakout above the trading range, designed to trap bullish traders before the price drops.
- Sign of Weakness (SOW): A significant price decline indicating that selling pressure is overwhelming buying interest.
2. Volume Analysis:

- Increased volume during the buying climax (BC) and before upthrust phases (UT) to trigger it.
- Selling pressure during Last Point of Supply.
3. Support and Resistance Levels:
- Identify key resistance levels formed during the buying climax and upthrust phases.
- Monitor support levels established during the automatic reaction and secondary test phases for potential breakdown points.
4. Market Timing:
- Align trades with broader market trends by analysing overall market conditions and sentiment. Confirm bearish market structures before executing trades.
5. Risk Management:
- Use proper position sizing and diversification to manage risk effectively. Ensure that the estimated downside profit potential outweighs the potential loss if the stop-loss is triggered.
These strategies can be Implemented across different market conditions and asset classes, such as stocks, forex, and commodities.
By mastering these strategies, traders can align their actions with the intentions of large institutional players, enhancing their ability to identify high-probability and highly profitable trades within the Wyckoff Distribution pattern.
Wyckoff Schematics
Buying Climax (BC): The BC marks the peak of buying activity where prices reach their highest point, followed by significant selling as smart money starts to distribute their holdings.
Automatic Reaction (AR): Following the BC, the price experiences a sharp decline due to increased selling pressure. This reaction sets the initial boundary for the distribution trading range.
Secondary Test (ST): During the ST, the price retests the high established during the BC. This test typically occurs with lower volume, indicating that buying interest is waning.
Sign of Weakness (SOW): The SOW is characterised by a substantial price drop with increased volume, confirming that selling pressure is overwhelming buying interest. This event signals the continuation of the downtrend.
Upthrust (UT): An UT occurs when the price temporarily breaks above the resistance level set during the BC, only to quickly fall back. This false breakout traps bullish traders and is often followed by a significant decline.
Last Point of Supply (LPSY): The LPSY marks weak rallies on lower volume after the UT, indicating that distribution is nearly complete. These rallies fail to reach previous highs and precede a substantial downtrend.
Wyckoff Distribution Phases
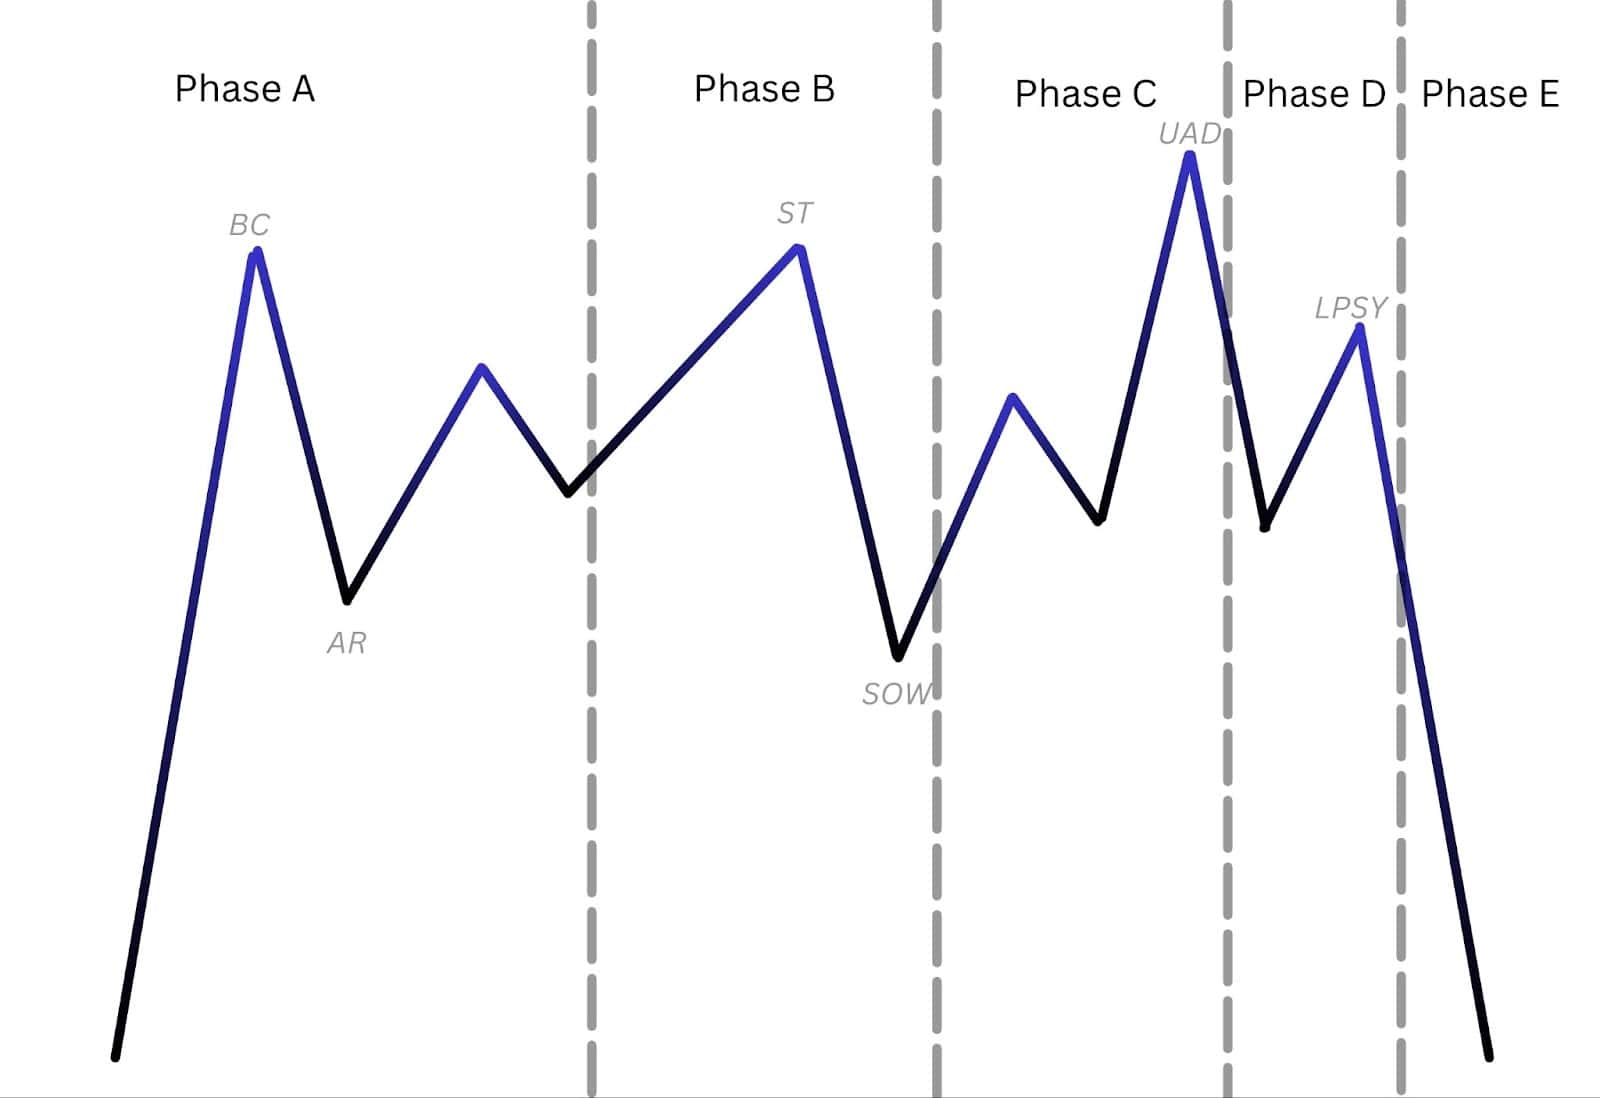
The Wyckoff Distribution pattern is a key concept in technical analysis, highlighting the process by which large institutions distribute their holdings, often leading to a downtrend. This pattern consists of five distinct phases:
Phase A: Stopping of the Prior Uptrend
This phase marks the end of the previous uptrend. The price starts to show signs of weakness, with preliminary supply (PSY) and a buying climax (BC) followed by an automatic reaction (AR) and secondary test (ST). These events indicate that the uptrend is losing momentum and large players are starting to offload their positions.
Phase B: Building a Cause for a New Downtrend
In this phase, the market experiences a trading range where the institutions build up their short positions. The price fluctuates between support and resistance levels, creating a base for the upcoming downtrend. This phase can last for an extended period, with multiple tests of the support and resistance levels, often accompanied by decreasing volume.
Phase C: Testing the Remaining Demand
Phase C is characterised by a spring or an upthrust, which serves to test the remaining demand in the market. This phase often includes a false breakout above the resistance level, trapping bullish traders. The failure to sustain the breakout and subsequent return to the trading range confirms the lack of demand and sets the stage for the downtrend.
Phase D: Dominance of Supply
During this phase, supply overwhelms demand. The price starts to make lower highs and lower lows, breaking below the support levels established in Phase B. This phase is marked by increased selling pressure and higher volume, indicating that institutions are aggressively selling their positions.
Phase E: Unfolding of the Downtrend
Phase E is the result of the distribution process. The price breaks down decisively, leading to a new downtrend. This phase sees continued selling pressure as the distribution phase completes, and the market moves into a markdown phase. The downtrend unfolds as the institutions have completed their distribution, and the market adjusts to the new lower price levels.
Understanding these phases helps traders identify potential selling opportunities and manage their trades more effectively. By recognising the signs of distribution, traders can anticipate downtrends and adjust their positions accordingly
Wyckoff Distribution Events
Understanding the Wyckoff Distribution pattern involves recognising nine key events that signal the transition from an uptrend to a downtrend. Here’s an in-depth look at these events:
- Upside Objective Accomplished: This event occurs when the price reaches a previously identified upside target. It signals that the uptrend may be nearing its end as the objectives of significant players are met.
- Activity Bearish: In this phase, volume characteristics change. Volume decreases during rallies and increases during reactions, indicating growing bearish sentiment as large players begin to sell into strength.
- Preliminary Supply (PSY) and Buying Climax (BC): Preliminary supply marks the first significant resistance to the uptrend, showing early signs of selling. The buying climax is characterised by a rapid price increase on high volume, followed by a sharp reaction, signalling the exhaustion of demand.
- Upward Stride Broken: The established upward trendline is broken, indicating a potential change in trend. This break confirms that the uptrend is losing momentum.
- Lower Highs: As the distribution phase progresses, the stock starts forming lower highs, suggesting that each rally is weaker than the previous one and that sellers are gaining control.
- Lower Lows: The stock begins to make lower lows, confirming the downtrend. This pattern reflects increasing selling pressure and diminishing demand.
- Estimated Downside Profit Potential: At this point, the estimated downside profit potential is at least three times the risk if the initial stop-order were hit. This favourable risk-to-reward ratio encourages traders to take short positions, anticipating further declines.
Trading Range Identification Techniques
Identifying trading ranges is a fundamental aspect of the Wyckoff Method, as it helps traders anticipate future price movements within the distribution phase. A trading range is characterized by a period of consolidation where prices move sideways, reflecting the balance between buying and selling pressure. This phase is crucial for smart money traders and institutional investors who accumulate or distribute positions without significantly impacting the market.
To effectively identify trading ranges, traders can utilize various techniques, such as price action analysis, volume analysis, and incorporate technical indicators.
Upthrust or Throwover
An upthrust occurs when the price briefly moves above the resistance level of the trading range but then quickly falls back below it. This action traps bullish traders and indicates potential distribution.
It signals false strength in the market, often accompanied by increased volume, suggesting institutional selling.
Volume Confirmation
Volume confirmation helps validate price movements within a trading range. By analyzing changes in trading volume, traders can determine the strength of buying or selling interest and confirm the authenticity of breakouts or breakdowns.
A genuine move is usually supported by a significant increase in volume, while a lack of volume suggests a false move or lack of conviction.
Price Confirmation
Price confirmation involves verifying the sustainability of price movements by observing whether they align with established trends or patterns. In the context of the Wyckoff Distribution, price confirmation helps traders identify potential reversal points and validate the presence of a trading range.
By comparing price action with volume analysis, traders can make informed decisions about entering or exiting positions.
Backing Up Action
Backing up action refers to the price movement that follows an upthrust or throwover. It involves a return to the trading range, often testing the previous resistance level as new support. This action confirms the failure of the breakout and signals the continuation of the distribution phase.
Traders can use backing up action as an opportunity to enter short positions, anticipating further downside potential.
Comparative Strength Analysis:
Comparative strength analysis is a technique used by Richard Wyckoff to evaluate the relative performance of stocks or industries against the broader market. By identifying assets that outperform or underperform during trends and within trading ranges, traders can select candidates to exit the long position or initiate shorts or puts within the distribution phase.
By employing these techniques, traders can accurately spot when the market is undergoing a distribution and share prices are getting ready to enter a markdown stage.
Wyckoff Point and Figure (P&F) Count Guide
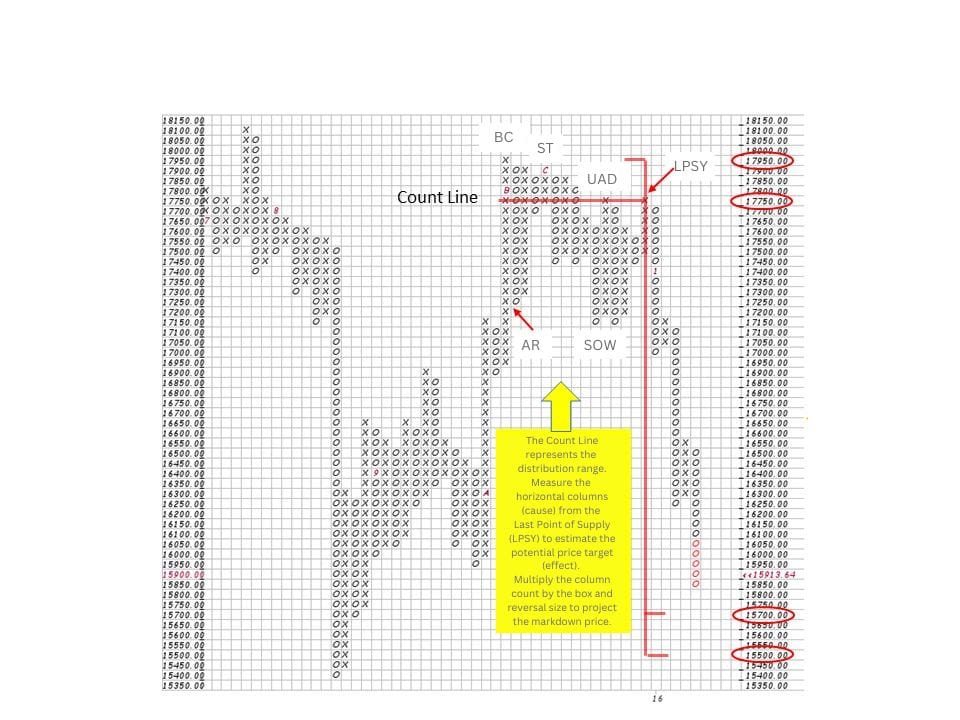
The Wyckoff Point and Figure (P&F) Count Guide is a powerful tool for estimating price targets during the distribution phase. It quantifies the “cause” built within a trading range (distribution) to project the “effect” (future price movement). Here’s how it works:
1. Identifying the Distribution Range
- Locate the trading range where the distribution occurs, defined by clear support and resistance levels.
- Focus on the horizontal price movement, as this represents the “cause” for the subsequent markdown.
2. Assigning P&F Columns
- Use a Point and Figure chart to map price and time without regard to volume.
- Count the number of columns in the distribution range from the Buying Climax (BC) or Last Point of Supply (LPS) to the end of the range.
3. Calculating the Price Target
- Multiply the total column count by the box size and reversal size.
- Add or subtract this value (depending on direction) from the breakout or breakdown point to project the price target.
Formula:
Price Target=Breakdown Point±(Column Count×Box Size×Reversal Size)Price Target=Breakdown Point±(Column Count×Box Size×Reversal Size)
4. Validating the Count
- Ensure the price projection aligns with broader market conditions and other Wyckoff principles, such as volume analysis and relative strength.
- Use the P&F count as part of a larger strategy rather than as a standalone tool.
The P&F Count Guide offers a systematic approach to determine potential price targets, enhancing your ability to anticipate and trade markdown phases effectively.
Advantages of Trading on the Wyckoff Distribution Pattern
1. Anticipates Downtrends:
- The Wyckoff Distribution Pattern helps traders identify potential downtrends before they fully unfold, allowing them to adjust positions and strategies accordingly.
2. Insights into Market Psychology:
- It reveals the actions of large institutional investors, offering a deeper understanding of market forces and helping traders align with the “smart money.”
3. Multiple Confirmation Points:
- The pattern provides several phases and events (e.g., buying climax, upthrust) that can confirm the validity of the distribution, increasing trading confidence.
4. Scanning and Shorting Opportunities:
- It is effective for scanning markets to identify potential shorting opportunities, helping traders take advantage of bearish trends.
5. Complements Other Analysis Techniques:
- The Wyckoff Distribution Pattern works well with other technical indicators and fundamental analysis, enhancing overall trading strategies.
Disadvantages of Trading on the Wyckoff Distribution Pattern
1. Subjective Interpretation:
- Recognising and interpreting the pattern can be subjective, leading to different analyses and potentially conflicting decisions.
2. False Signals:
- The pattern can produce false signals, such as false breakouts, requiring confirmation from additional indicators to avoid misleading trades.
3. Requires Experience:
- Effective use of the Wyckoff Distribution Pattern demands experience and practice, making it challenging for novice traders.
4. Not Foolproof:
- Like any technical analysis tool, it is not always reliable and can sometimes fail to predict market movements accurately.
5. Time-Consuming:
- Identifying and analysing the pattern can be time-consuming, especially for those new to the Wyckoff method.
What is the Difference Between Wyckoff Accumulation and Wyckoff Distribution?
Wyckoff Accumulation:
- Purpose: Indicates the phase where institutional investors build positions in anticipation of an upward price movement.
- Behaviour: Characterised by sideways price movement within a trading range, absorbing supply, and ending with a breakout to the upside.
Wyckoff Distribution:
- Purpose: Represents the phase where institutional investors offload their positions in anticipation of a downward price movement.
- Behaviour: Marked by sideways price movement within a trading range, distributing supply, and ending with a breakdown to the downside.
The key difference between Wyckoff Accumulation and Wyckoff Distribution lies in the direction of the expected price movement after the pattern is complete: accumulation leads to an uptrend, while distribution leads to a downtrend.
What is the Difference Between Wyckoff Distribution and Reaccumulation?
Wyckoff Distribution and Reaccumulation are two opposite phases within the market cycle, each having different intentions from the institutional players. Distribution occurs when institutions offload their positions after an uptrend, preparing for a bearish move as supply begins to outweigh demand.
On the other hand, reaccumulation takes place during a bullish uptrend, where strong hands temporarily retrace to gather more positions before trend continuation. While both phases involve sideways price action, the underlying goals and outcomes are entirely different.
In a distribution phase, the price typically shows signs of price exhaustion, with weakening rallies and increasing supply (volume) at key resistance levels. As opposed to reaccumulation is a healthy breather in a bullish market, where buying interest remains strong with volume increasing near support despite consolidation.
The challenge lies in recognising the subtle differences between the two, often found in volume behaviour, prior trend direction, and the broader market context. A clear understanding of these phases can help traders anticipate whether the market is preparing for a continuation or a reversal.
FAQ
Common Wyckoff Distribution pattern mistakes to watch out for?
• Misinterpreting volume patterns and not recognizing false breakouts.
• Failing to confirm signals with additional indicators.
• Overlooking the importance of backing up actions and comparative strength analysis.
How reliable is the Wyckoff Distribution pattern?
The Wyckoff Distribution Pattern is quite reliable when used in conjunction with other technical analysis tools, but it requires experience to interpret accurately.
What is the difference between accumulation phase and distribution phase?
The Accumulation Phase is where institutional investors build positions, leading to an upward breakout. In the Distribution Phase institutional investors offload positions, leading to a downward breakout.
How do you identify accumulation and distribution zones?
Accumulation Zones are characterised by prolonged sideways movement with increasing volume on up days. On the other hand, Distribution Zones are identified by sideways movement with increasing volume on down days and the emergence of resistance levels.
What is the difference between accumulation distribution line and on balance volume?
The Accumulation Distribution Line measures the flow of volume to ascertain whether a stock is being accumulated or distributed. The On-Balance Volume (OBV) calculates cumulative volume by adding volume on up days and subtracting volume on down days to indicate buying and selling pressure.


