Verfasst von:


- Weekly Outlook
- Juli 31, 2026
- 6 Min. Lesezeit
Bonds Are Doing the Fed’s Tightening
The most important move coming out of this week’s Federal Reserve meeting was not in the fed funds rate. It was in the Treasury curve.
The Fed left rates unchanged at 3.50%–3.75%, despite three FOMC members voting for a 25bp hike. Chair Kevin Warsh remained forceful on inflation but deliberately avoided giving markets a clear roadmap for what comes next. He acknowledged that higher bond yields are already tightening financial conditions and appeared comfortable allowing markets to do some of the work that would otherwise have to come from the Fed itself.
That helps explain why the reaction in Treasuries was unusual.
Short-dated yields fell as traders reduced the probability of a September hike, while long-dated yields moved sharply higher. The 30-year Treasury yield pushed above 5.20%, its highest level since 2007, while the 10-year yield also climbed. The resulting bear steepening suggests investors are demanding more compensation to own long-duration government debt even as they become less certain that the Fed will raise its policy rate in September.
That is the key macro story for the week ahead.
Why is the US 10-year yield rising?
The rise in US10Y is increasingly about the long end questioning how inflation will ultimately be contained.
Warsh has repeatedly stressed that the Fed will deliver price stability, but this week he stopped short of committing to the conventional route of simply raising rates. Markets therefore appear to be pricing a larger term and inflation premium into longer-dated Treasuries.
In other words, the message from the bond market is becoming:
If the Fed does not tighten aggressively at the front end, the market may tighten conditions through the long end instead.
Reuters noted that September hike expectations dropped from near certainty before the meeting to roughly 55% immediately afterward. At the same time, longer yields surged.
That matters because a higher 10-year yield feeds directly into financial conditions through mortgages, corporate borrowing costs, equity discount rates and the broader cost of capital.
Normally, that would be a headwind for equities.
But there is another side to the story.
If markets interpret the Fed’s approach as allowing the yield curve to absorb the inflation risk while avoiding an immediate policy-rate shock, equities can potentially continue higher provided economic growth and earnings remain resilient.
That is why next week’s data matters so much.
A moderate growth slowdown would arguably be the best combination for risk assets: strong enough to avoid recession fears, but soft enough to stop the long end of the Treasury market from moving materially higher.
A renewed acceleration in growth or inflation would create the opposite problem. It could force US10Y higher again, steepen the curve further and increase pressure on equity valuations.
Economic Calendar
Monday, August 3 — ISM Manufacturing PMI
The first major test comes from the July ISM Manufacturing PMI, released Monday at 10:00 a.m. ET. ISM confirms that the July manufacturing report is scheduled for August 3.
Regional activity indicators suggest that a flat to slightly stronger manufacturing reading would remain consistent with an economy growing at roughly a 2%–2.5% annual pace.
For markets, the composition may matter more than the headline.
A healthy activity number accompanied by softer prices would fit the equity-friendly soft-landing narrative. However, stronger new orders alongside renewed price pressures could reinforce the Treasury market’s concerns and push long-term yields higher.
Wednesday, August 5 — ISM Services PMI
Services remain the more important part of the US economy, making Wednesday’s ISM Services PMI another key read on whether growth remains resilient.
ISM’s official calendar confirms the July services report will be released on August 5.
The ideal market outcome would again be steady activity without another acceleration in inflation-sensitive components.
If both ISM reports point toward growth around the current trend rather than a new upswing, it would give the bond market less reason to push long yields higher.
Friday, August 7 — US Jobs Report
The main event comes Friday with the July Employment Situation report at 8:30 a.m. ET. The BLS calendar confirms the release date.
Rate expectations have already changed significantly following the Fed meeting. A September hike had effectively been priced at the beginning of this week, but markets have since scaled that probability back materially.
That makes payrolls the next major input into the September debate.
The labour market had an unusually weak period between early 2025 and early 2026 before improving in March, April and May. June then disappointed, with payroll growth of only 57,000 and substantial downward revisions.
Hiring surveys remain subdued.
Our working expectation is for approximately 75,000 jobs in July, with unemployment rising to around 4.3%.
The unemployment rate should still be treated carefully. Labour-force participation has recently weakened sharply, which means headline unemployment may provide a less complete picture of underlying labour-market health.
Consensus estimates reported by Reuters currently sit somewhat higher, at approximately 91,000 jobs.
For markets, the scenarios are fairly straightforward:
Soft payrolls + contained wages: lower front-end hike expectations, potentially lower US10Y and supportive conditions for equities.
Strong payrolls + firm wage growth: September hike expectations rebuild, US10Y potentially pushes higher and equity duration becomes more vulnerable.
Very weak payrolls: yields may initially fall, but markets could quickly shift from celebrating easier policy toward worrying about growth.
That makes a moderate number the cleanest outcome for the bullish equity narrative.
S&P 500 Technical Outlook: Triangle Nearing Resolution
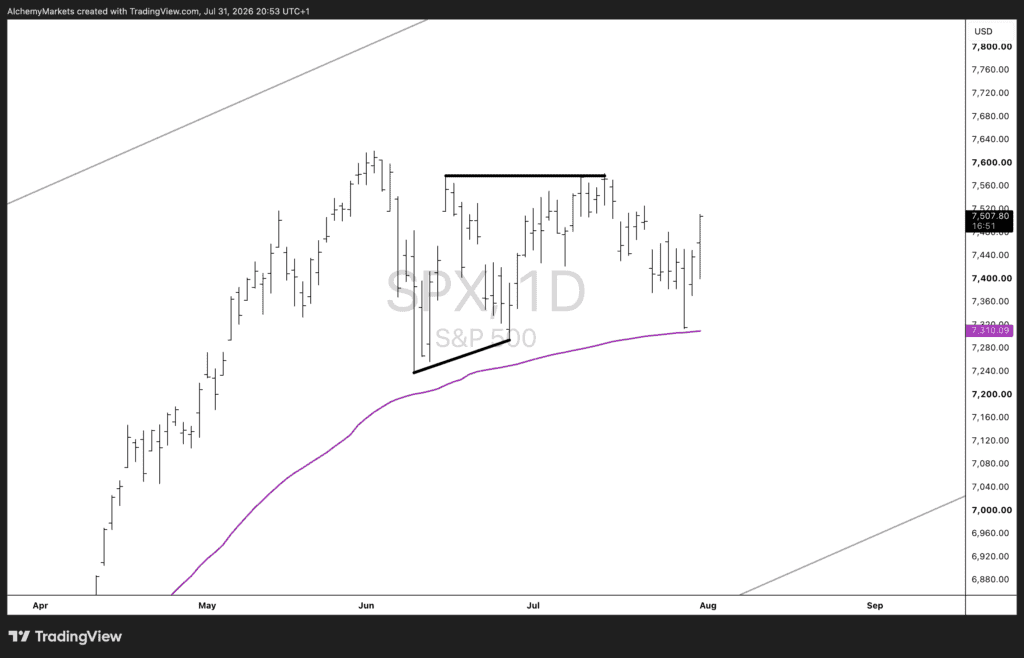
The macro environment may be complicated, but the S&P 500 chart is becoming relatively simple.
Price has spent the last several weeks consolidating beneath resistance around the 7,570–7,580 region, while successive lows have broadly held above a rising support structure.
That created a triangle-style consolidation following the strong advance from the April lows.
More importantly, the market recently tested the rising moving-average region near 7,310 and produced a sharp recovery.
The structure therefore continues to look more like consolidation within an existing uptrend than a confirmed distribution pattern.
The key level is the upper boundary around 7,570–7,580.
A clean daily breakout above that area would complete the consolidation and increase the probability that the S&P 500 is preparing for another impulsive leg higher.
The technical narrative therefore fits surprisingly well with the macro setup:
Bond yields are tightening financial conditions, the Fed is reluctant to over-commit to another hike, and equities are consolidating rather than breaking down.
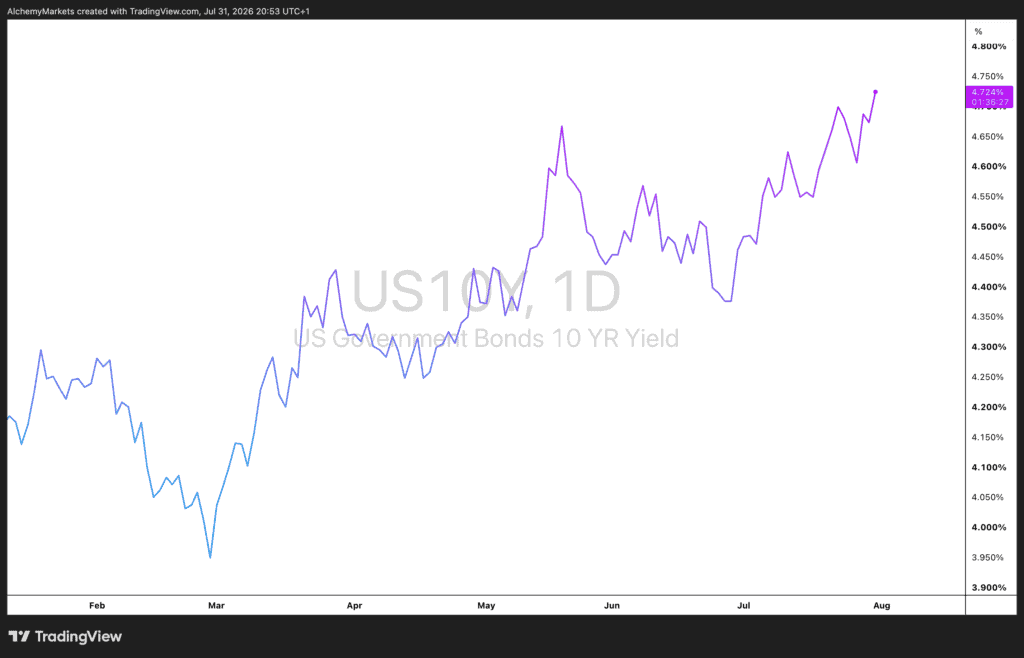
If next week’s ISM and payroll reports are moderate enough to prevent another disorderly rise in the 10-year yield, the S&P 500 may have the macro breathing room required to break through resistance.
The risk to that view is the Treasury market.
If US10Y continues climbing because investors become increasingly uncomfortable with the Fed’s inflation credibility, equity multiples will eventually have to compete with materially higher long-term risk-free rates.
For now, though, the chart is saying something important: despite the rise in yields and the uncertainty created by the Fed, the S&P 500 is still holding its bullish structure.
A breakout from this triangle would suggest the market is ready for its next impulse higher.