Verfasst von:

- Quarterly Forecast
- Juli 1, 2026
- 10 Min. Lesezeit
Will Dollar Strength Hold in Q3? FX Outlook 2026
The dollar enters Q3 as the market’s first line of defence against sticky inflation, geopolitical stress and a Federal Reserve that can afford to wait.
That support is fundamental, not merely technical. The immediate uncertainty is whether DXY can clear weekly resistance and whether higher yields begin to destabilise risk-sensitive assets.
That is why AUDJPY and GBPJPY matter later in this outlook: a synchronised breakdown would show that pressure is spreading from cyclical currencies into the yen-funded carry trade.
The dollar starts Q3 with an advantage
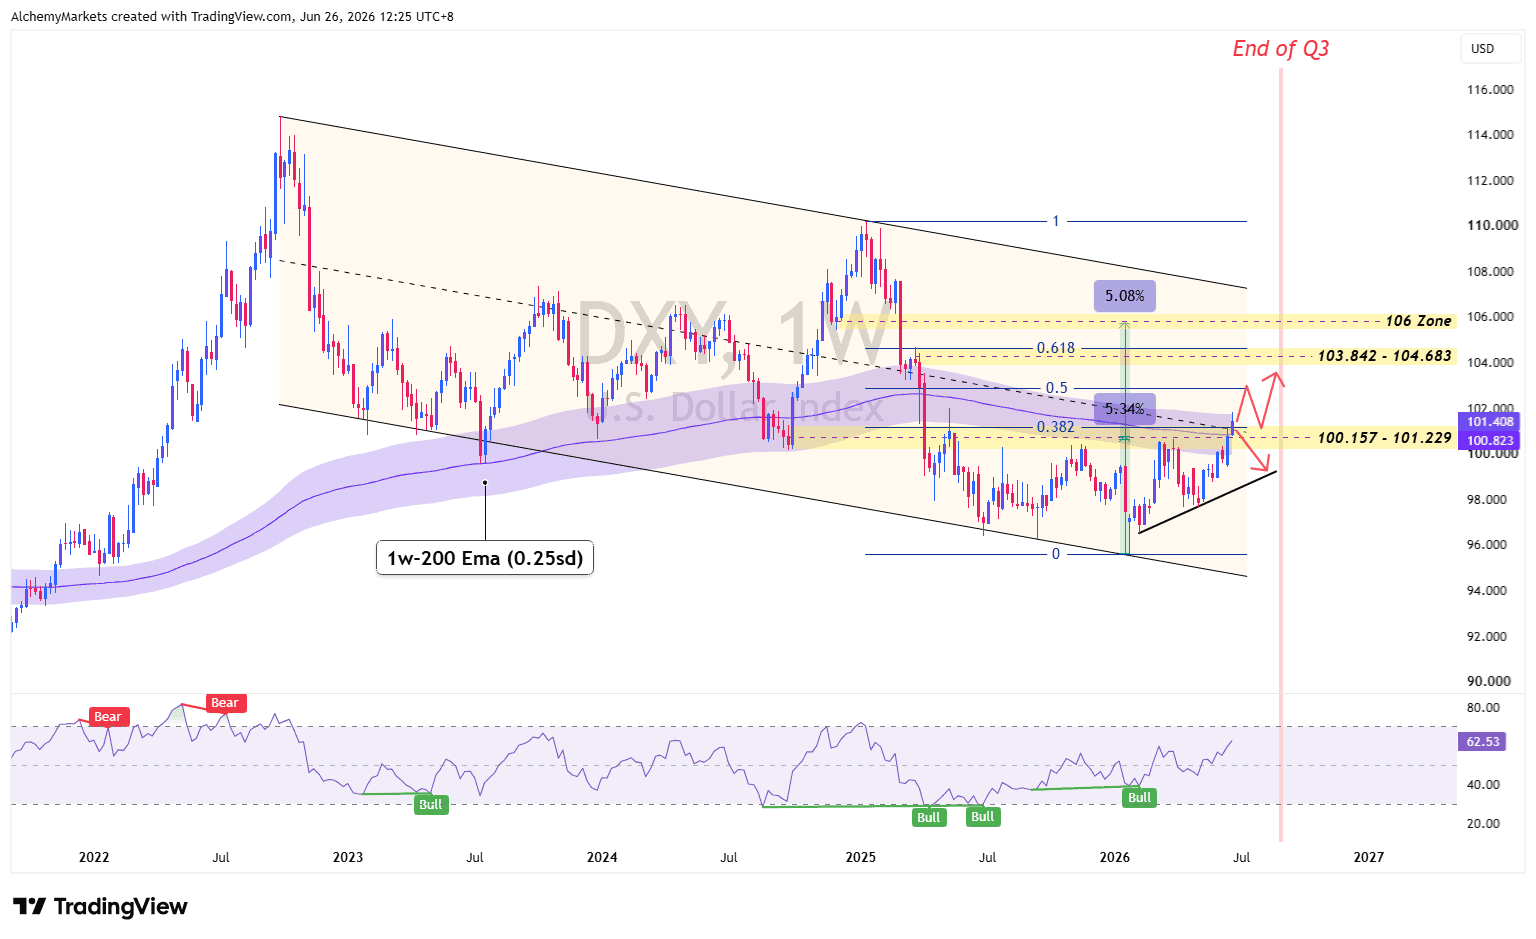
The dollar’s early-Q3 edge comes from a Federal Reserve that can remain restrictive while several peers face weaker growth or greater energy exposure. That gives USD a genuine fundamental advantage.
At the 26 June 2026 chart snapshot, DXY was testing 101.229 and its weekly 200W-EMA band. A break opens 103.842-104.683, while rejection could simply be a delay of the broader bullish case in Q3.
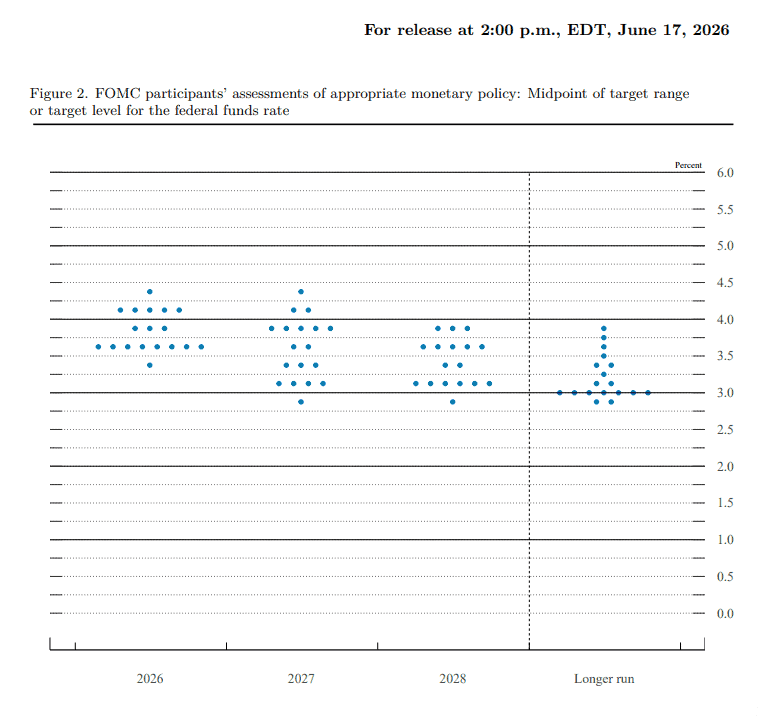
What the June dot plot actually says
The 17 June projections showed a difficult mix: 2026 growth was trimmed to 2.2%, while PCE inflation rose to 3.6% and core PCE to 3.3%. The Fed saw slower growth, but not enough weakness to justify a rescue.
The median year-end rate projection rose to 3.8%, yet the dots were split between hikes and no change. The Q3 message is not that a hike is certain, but that cuts have lost credibility.
| i. Base case: The Fed holds while inflation remains uncomfortable and employment stays positive. ii. Hawkish risk: Core inflation broadens, oil rises and the US 2-year yield moves higher. iii. Dovish risk: Payrolls, hours, claims and credit conditions weaken together. |
This keeps USD fundamentally supported through Q3. A more durable reversal would require front-end yields to fall alongside softer labour, normalising oil or a clear change in Fed expectations.
Yield spread shows why Dollar is gaining strength
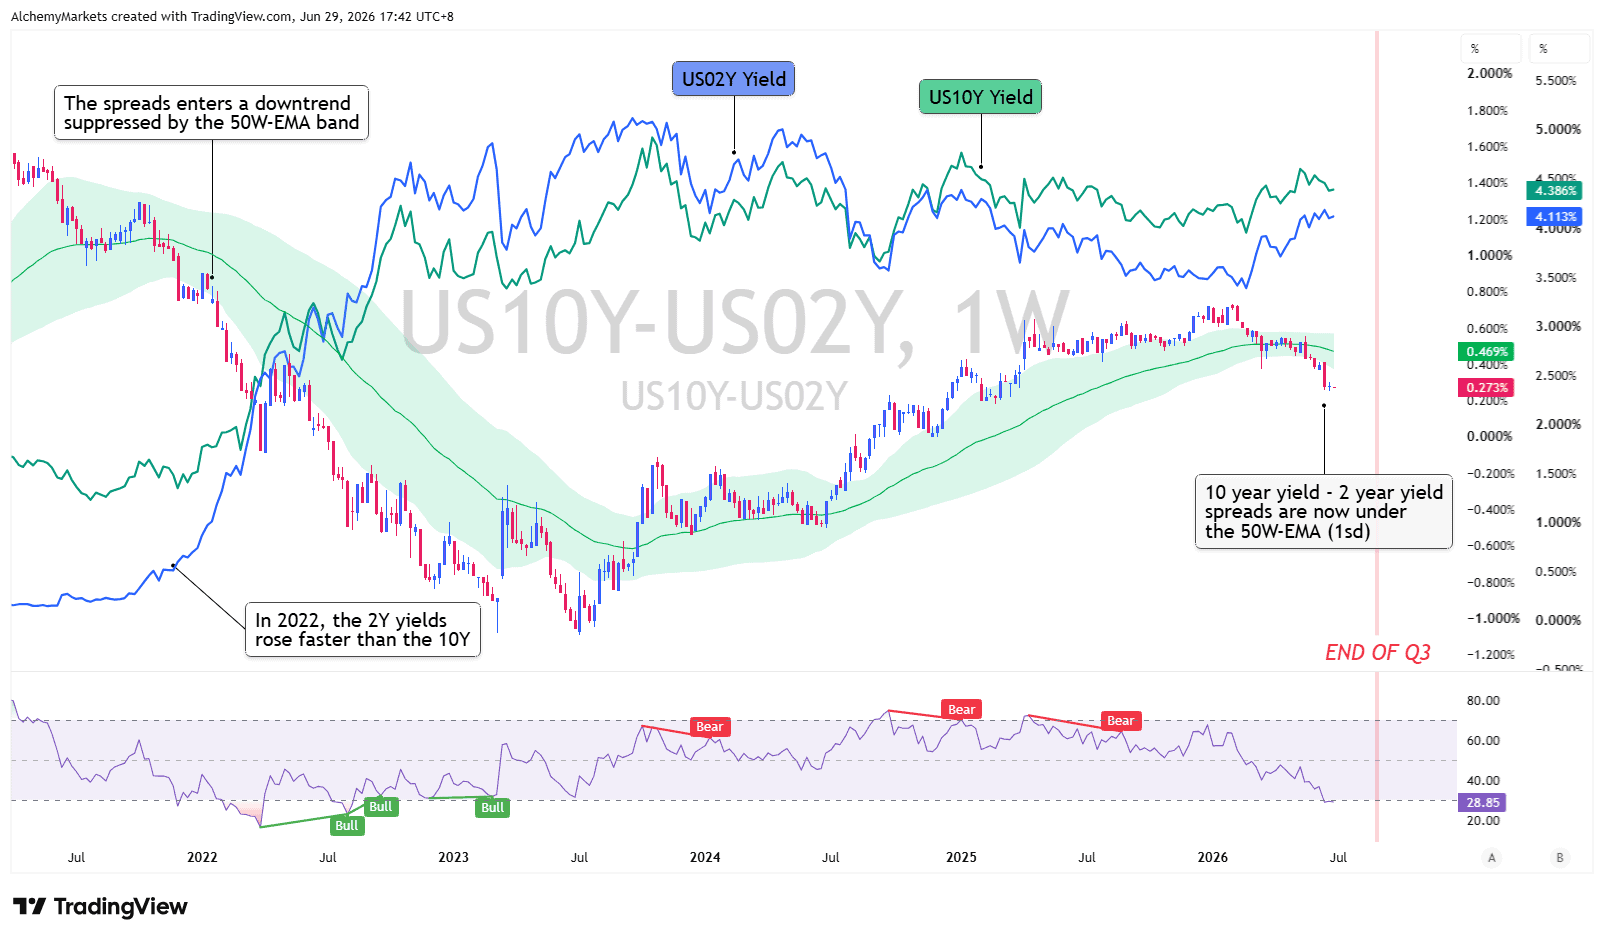
The US 10-year minus 2-year spread helps distinguish between policy-led dollar strength and pressure coming from longer-term inflation, Treasury supply or fiscal concerns. A narrowing spread is most supportive for USD when the 2-year yield rises faster than the 10-year, as this points to a more restrictive Federal Reserve path.
| i. Spread narrows as the 2-year rises: Hawkish Fed repricing and the cleanest USD-positive setup. ii. Spread widens as the 2-year falls: Softer Fed expectations and a more USD-negative signal. iii. Spread widens as the 10-year rises: Inflation, Treasury supply or term-premium pressure; USD support depends on credit and risk assets remaining stable .iv. Both yields fall sharply: Growth or disinflation concerns are taking over; the dollar response depends on whether markets price orderly easing or wider financial stress. |
At our 29 June snapshot, the 10Y-2Y spread had moved below its weekly 50-EMA band as the 2-year yield moved closer to the 10-year.
In 2022, aggressive Fed tightening pushed short-term yields above long-term yields, while the same front-end repricing supported DXY. The inversion did not cause dollar strength; both came from the same policy shock.
Oil remains the bridge between geopolitics and rates
Oil and the US-Iran conflict remain central to the Q3 FX outlook. Continued de-escalation and peace talks have so far helped contain inflation expectations, limiting the pressure on central banks to become even more hawkish.
However, the attacks on vessels passing through the Strait of Hormuz on 27-28 June exposed how fragile the 17 June memorandum remains.
FX traders should therefore continue monitoring geopolitical tensions throughout Q3. Although markets appear increasingly desensitised to the repeated cycle of threats, retaliation and temporary stand-downs, another serious escalation could still threaten the agreement.
If either side formally declares the deal over, we expect the initial market reaction to be bullish for both oil and the dollar as inflation expectations rise and the case for Fed easing weakens.
The Q3 base case is managed instability. Talks may continue, but further disputes over Hormuz transit rules or attacks on vessels could force markets to reprice oil, inflation and the dollar before the mid-August negotiation deadline.
| i. Base case: Managed instability keeps oil and USD volatility elevated. ii. De-escalation: Verified passage and attack-free weeks reduce the geopolitical premium. iii. Breakdown: Another vessel attack, mine threat or US casualties lift stagflation risk. |
When market stress spreads
A fast leverage flush can reverse once funding stabilises. Persistent spread widening and weak issuance would instead signal that stress is moving into credit and the real economy.
In either case, USD can rise through global funding demand while JPY strengthens as yen-funded trades close. A synchronised fall in AUDJPY, GBPJPY and NZDJPY would confirm that the unwind is broader than a single USDJPY move.
Possible Paths for Q3
| PATH | MAIN TRIGGER | FX READ |
| Dollar strength grows | US 2-year yields rise and DXY clears weekly resistance. | USD strengthens against EUR, NZD and other cyclical currencies. |
| Yen carry unwind | USDJPY declines as yield spreads compress and volatility rises. | JPY outperforms while AUDJPY and GBPJPY turn lower. |
| Dollar reversal | Oil normalises, front-end yields fall and DXY rejects resistance. | EURUSD rebounds and cyclical currencies stabilise. |
Q3 FX bias table
| PAIR | Q3 BIAS | QUICK VIEW |
| AUDNZD | Bullish | Buy meaningful pullbacks towards the rising 20W-EMA band. |
| USDJPY | Neutral | Fade 160 only after rejection, spread compression or intervention signals. |
| AUDJPY | Slightly Bearish | Fade failed recoveries below the daily 50-EMA band. |
| GBPJPY | Slightly Bearish | Fade rallies after the daily 50-EMA band fails. |
| EURUSD | Neutral | Buy support only if DXY rejects and oil remains contained. |
Five charts that define the Q3 pair outlook
USDJPY: Intervention risk rises near the 2024 highs
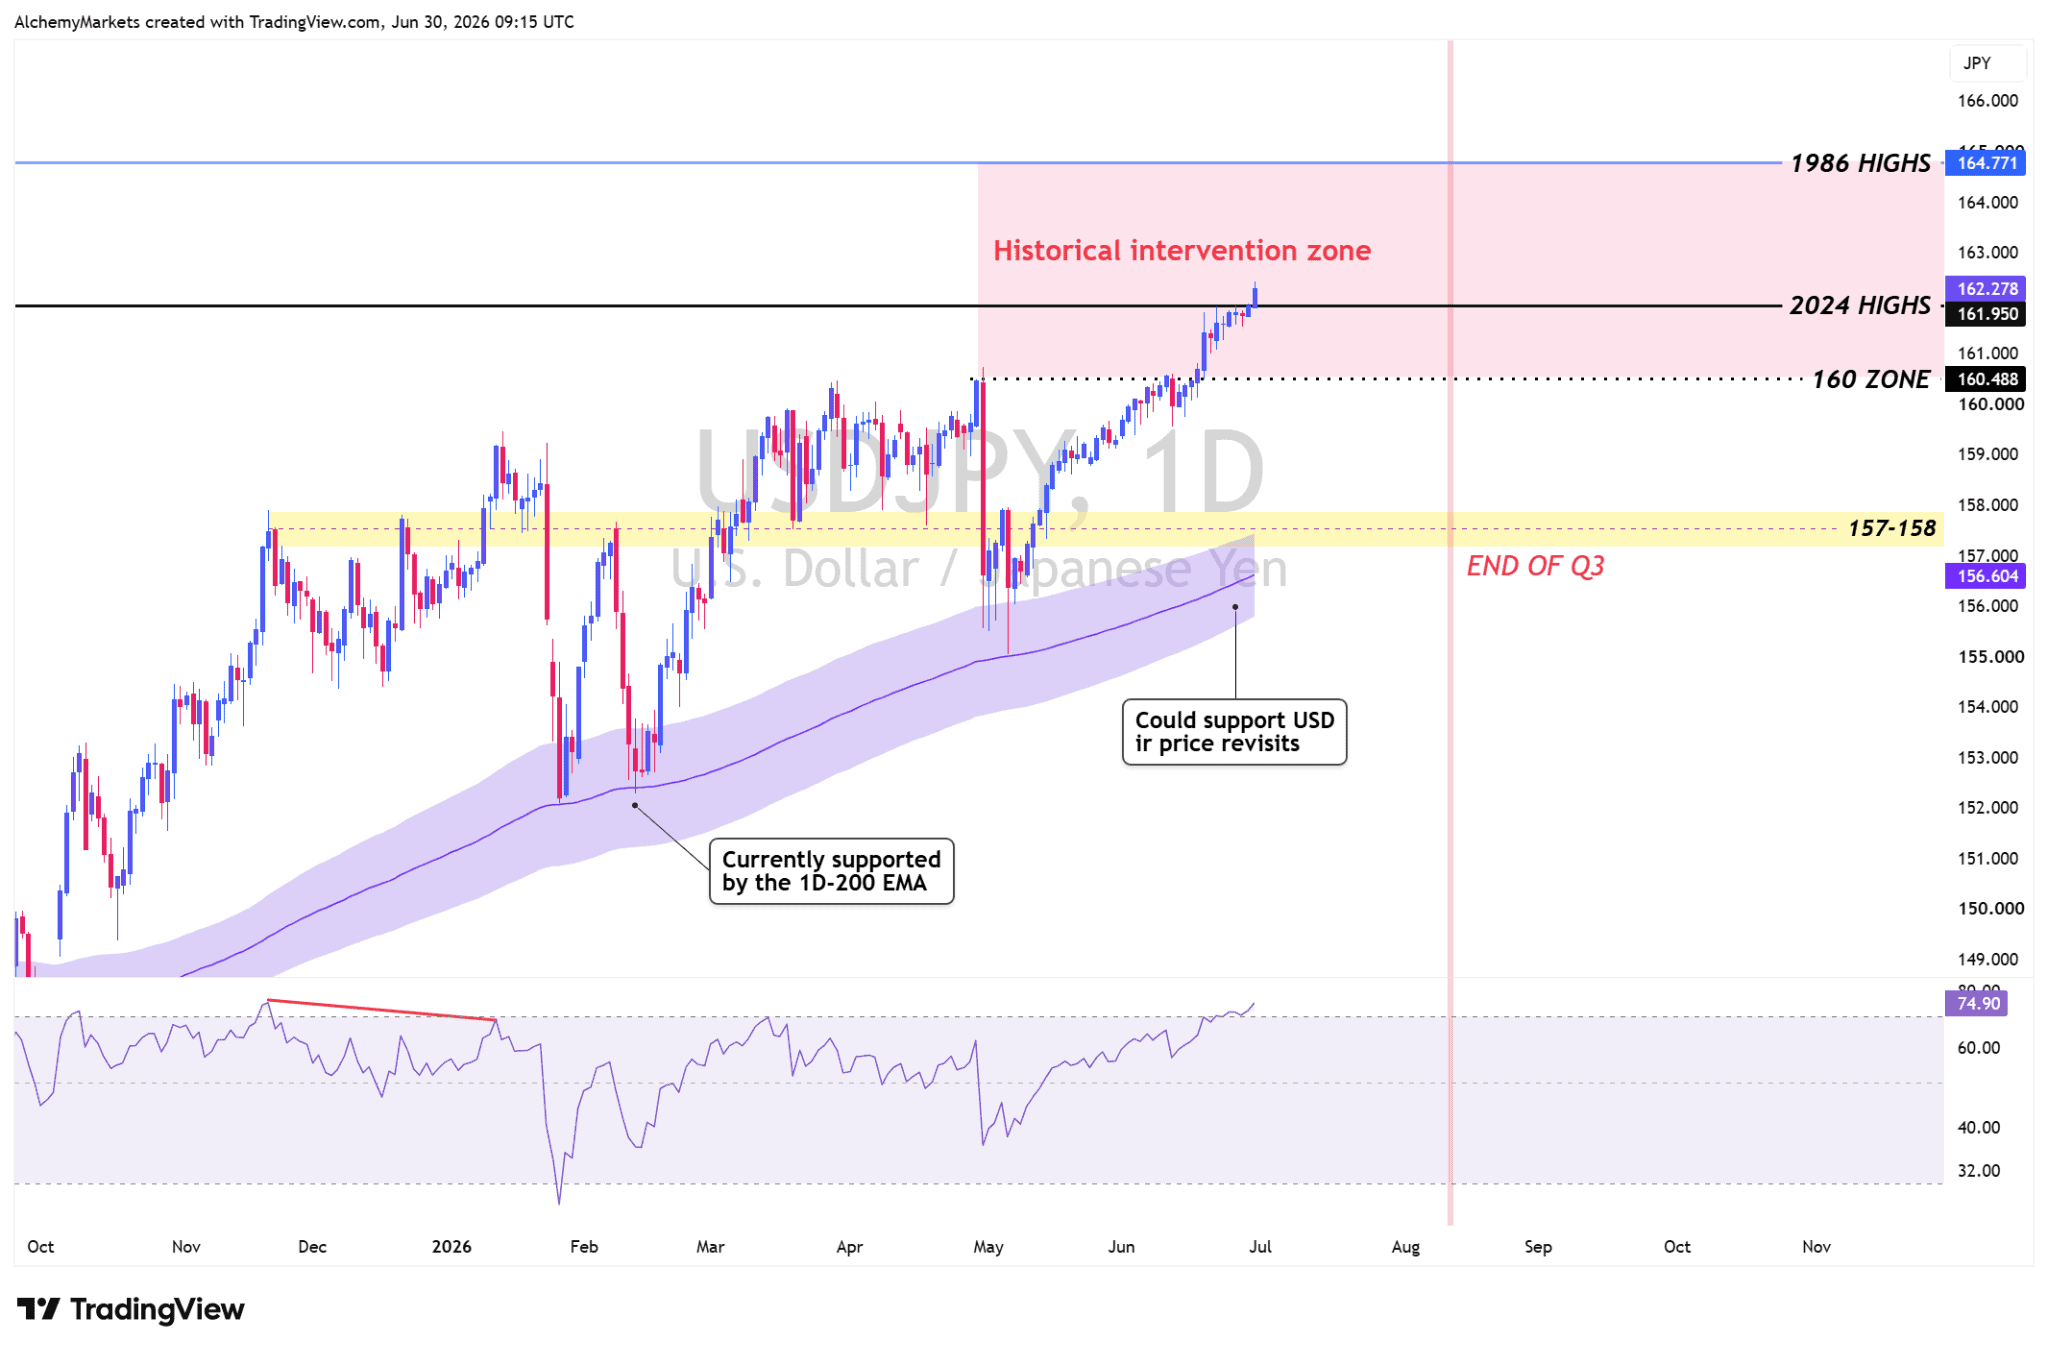
At the 30 June 2026 chart snapshot, USDJPY had moved above the 2024 high and deeper into the 160-164.80 intervention zone, which extends towards the 1986 high. The US-Japan rate advantage still supports carry, so 160 alone is not a reversal signal.
However, the risk of official action increases if the rise in USDJPY becomes rapid, one-sided or disorderly. Japanese authorities can escalate from stronger verbal warnings to dealer rate checks and direct yen purchases. A BoJ rate hike is a separate policy tool that could support JPY by narrowing the yield gap, although weak growth limits how aggressively policymakers can tighten.
The pressure on Japanese policymakers is therefore coming from several directions:
| How JPY is currently being pressured to hike | |
| BoJ policy rate | 1.00%, the highest in 31 years; further hikes remain possible, although the board is divided over growth risks. |
| Consumer inflation | Core CPI held at 1.4% in May, below the 2% target for a fourth month, while Tokyo inflation accelerated in June. |
| Domestic cost pressure | Services producer prices rose 3.3% YoY in May as fuel and transport costs continued to feed through. |
| Economic momentum | Industrial output rose 0.5% MoM in May, marking a second monthly increase but missing expectations. |
| Oil and imported inflation | Contained oil reduces the immediate pressure to tighten. Renewed US-Iran escalation would raise import costs and strengthen the case for resisting further yen weakness. |
| FX intervention pressure | Japan spent ¥11.7 trillion in April-May, but the relief proved temporary as USDJPY returned above 160. |
Oil adds another layer of pressure. A renewed US-Iran escalation could support the dollar through higher inflation expectations, but it would also raise Japan’s imported energy costs.
That would give Japanese authorities more reason to resist further yen weakness, making the 160-164.80 area increasingly sensitive.
| i. Reversal: Daily bearish divergence is confirmed by a failed breakout and a close back below 160. ii. Policy: Japanese authorities escalate from verbal warnings to rate checks or direct yen buying. iii. Breadth: AUDJPY, GBPJPY and NZDJPY weaken together as US-Japan yield spreads compress. |
The next major tests are upcoming Japanese inflation and labour data, followed by the July and September BoJ meetings.
Japanese authorities have recently used thin holiday liquidity to increase the impact of intervention. This occurred during Golden Week in both 2024 and 2026, when reduced participation allowed yen-buying operations to produce sharper moves in USDJPY.
Traders should therefore treat major US and Japanese holidays as higher-alert intervention windows, particularly if USDJPY is trading above 160, rising rapidly and accompanied by stronger official warnings.
AUDJPY: The cleaner carry-unwind barometer
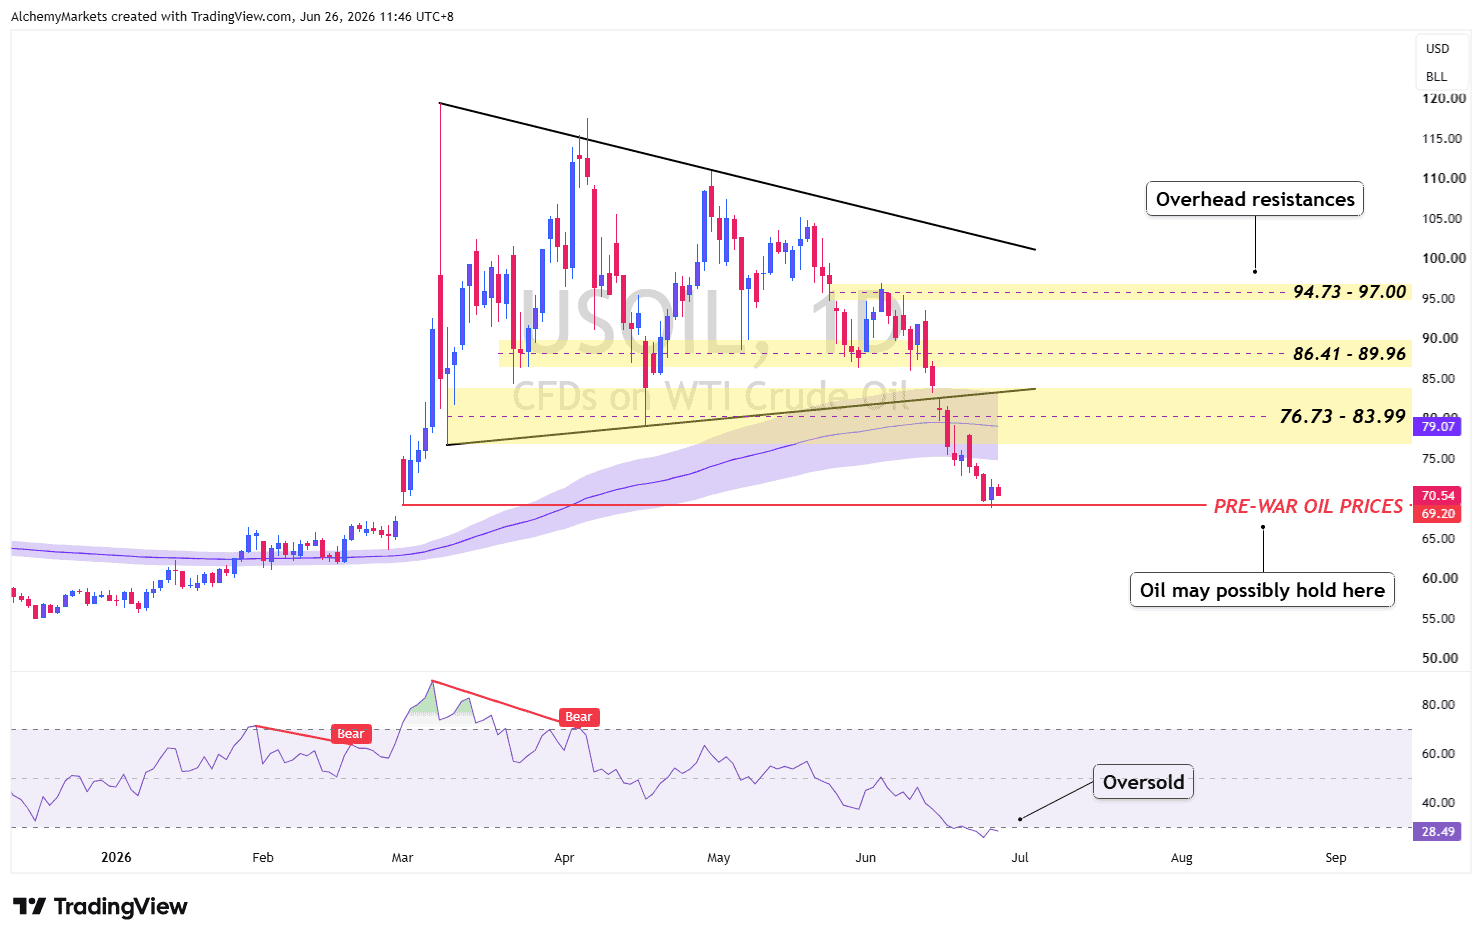
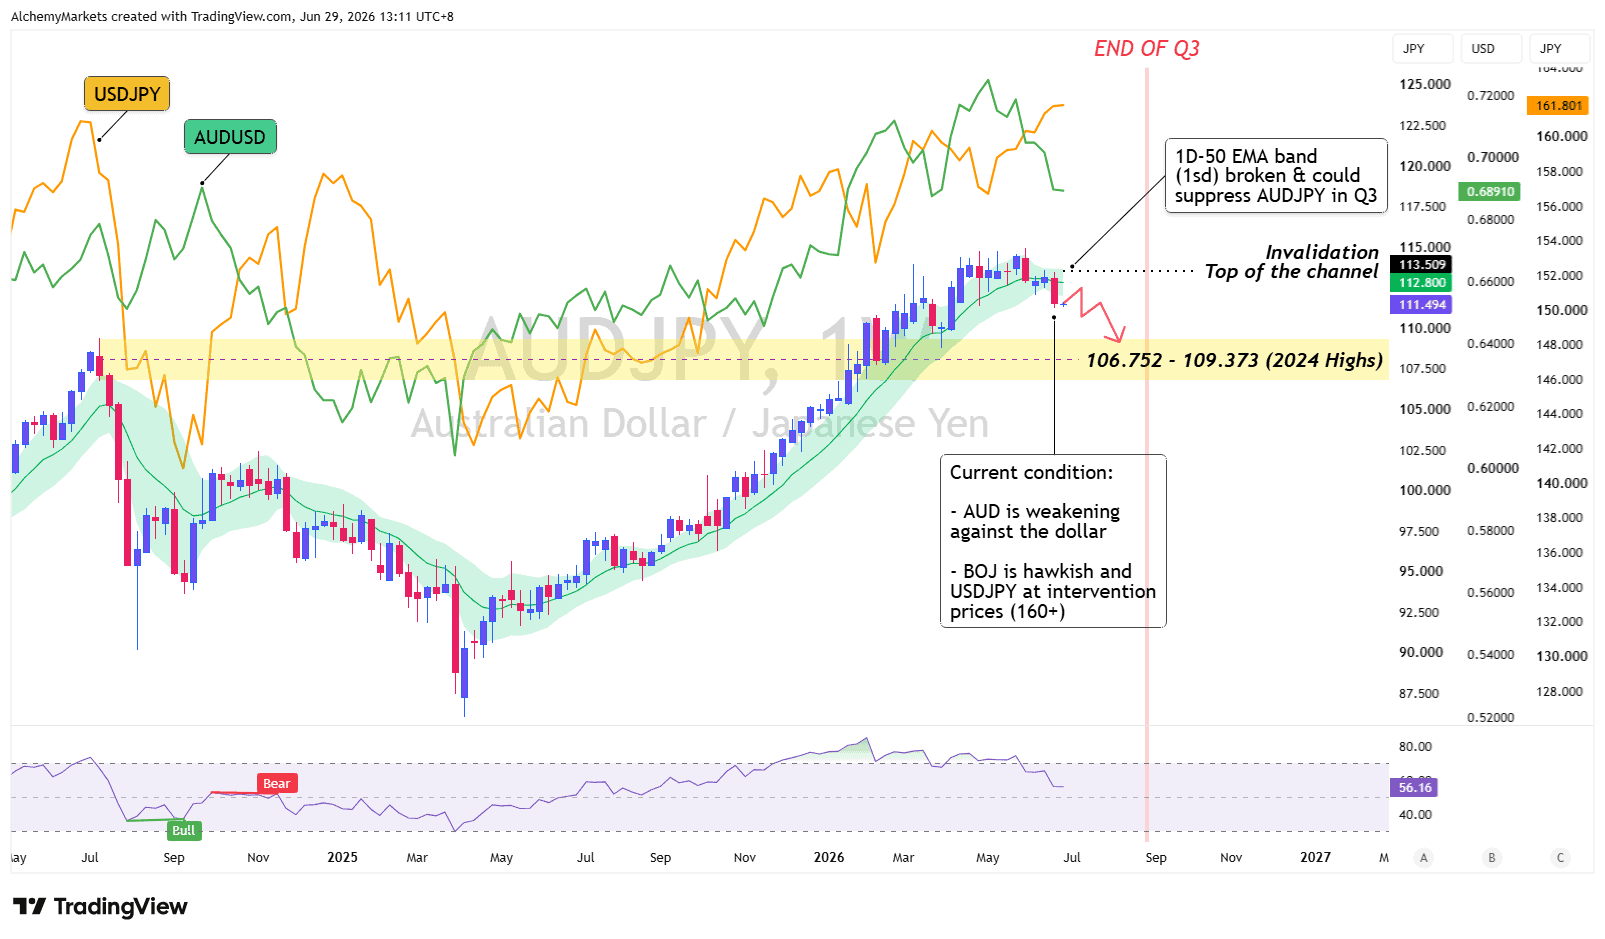
AUDJPY is a cleaner carry-stress gauge because AUD can weaken as JPY strengthens. At the 26 June chart snapshot, price had rejected channel resistance and slipped through the daily 50-EMA band, putting 109.373-106.752 in focus. A recovery above 113.509 weakens the setup.
| i. Confirmation: AUDJPY stays below the daily 50-EMA band. ii. Cross-market: USDJPY turns lower and other yen crosses break. iii. Invalidation: AUD stabilises and global volatility remains contained. |
GBPJPY: Sterling carry meets yen-unwind risk
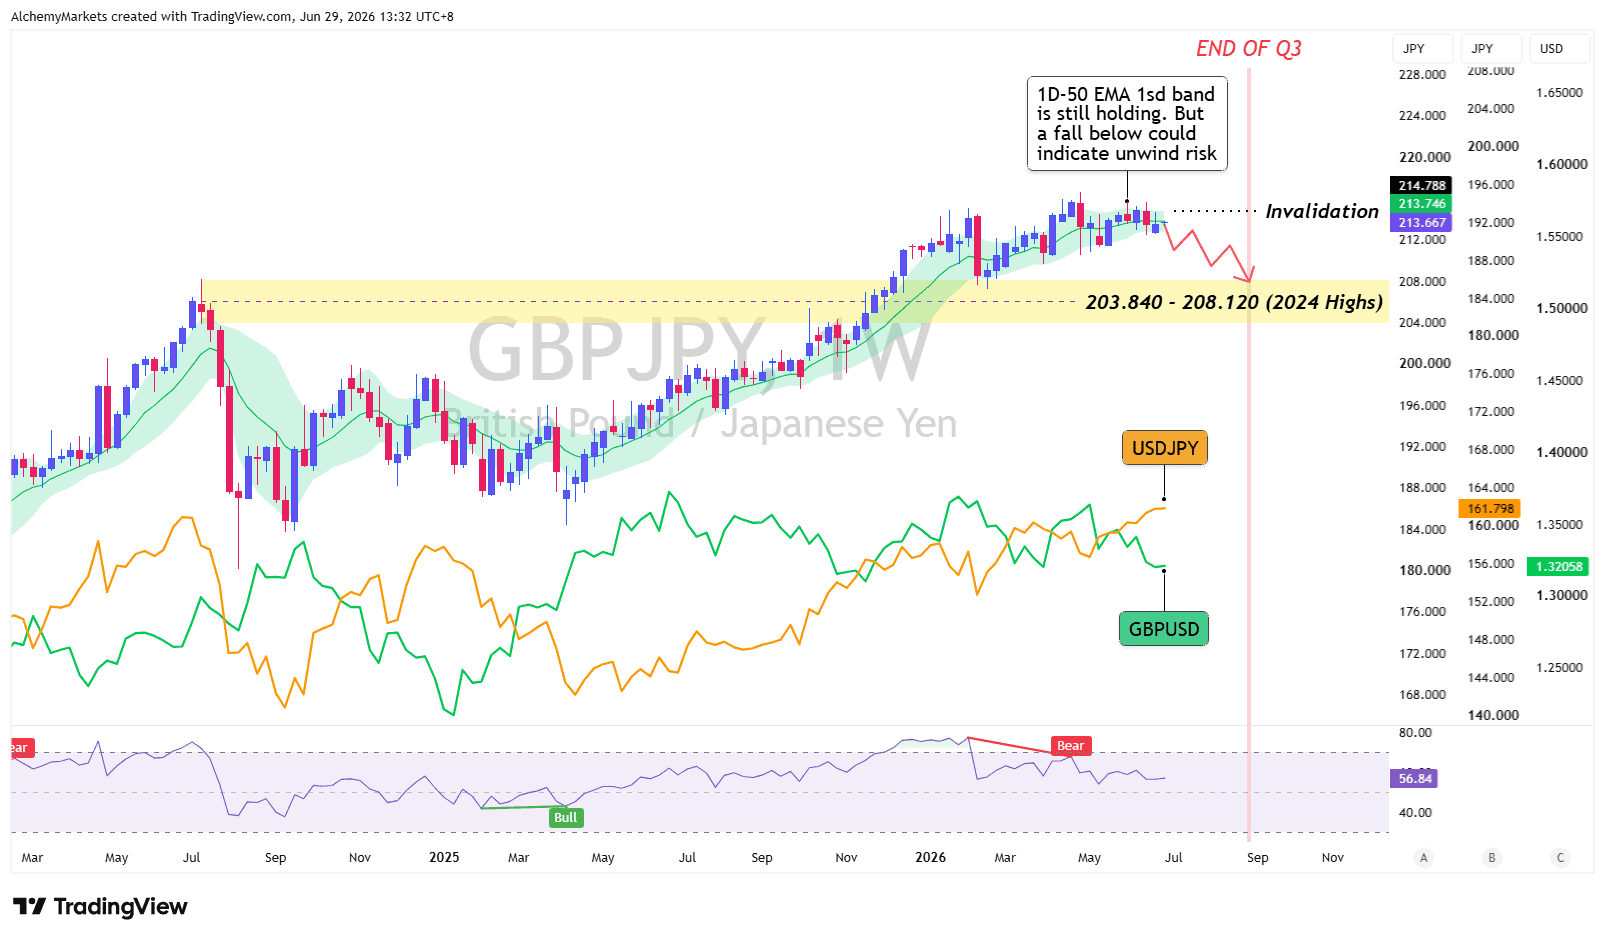
GBPJPY remained elevated because weaker sterling was offset by a weak yen. A break below the daily 50-EMA band would allow both legs to turn lower, exposing 208.120-203.840. A sustained move above 214.788 weakens the setup.
| i. Confirmation: GBPJPY closes below the daily 50-EMA band. ii. Cross-market: GBPUSD stays weak as USDJPY and other yen crosses fall. iii. Invalidation: USDJPY rises and global risk appetite remains resilient. |
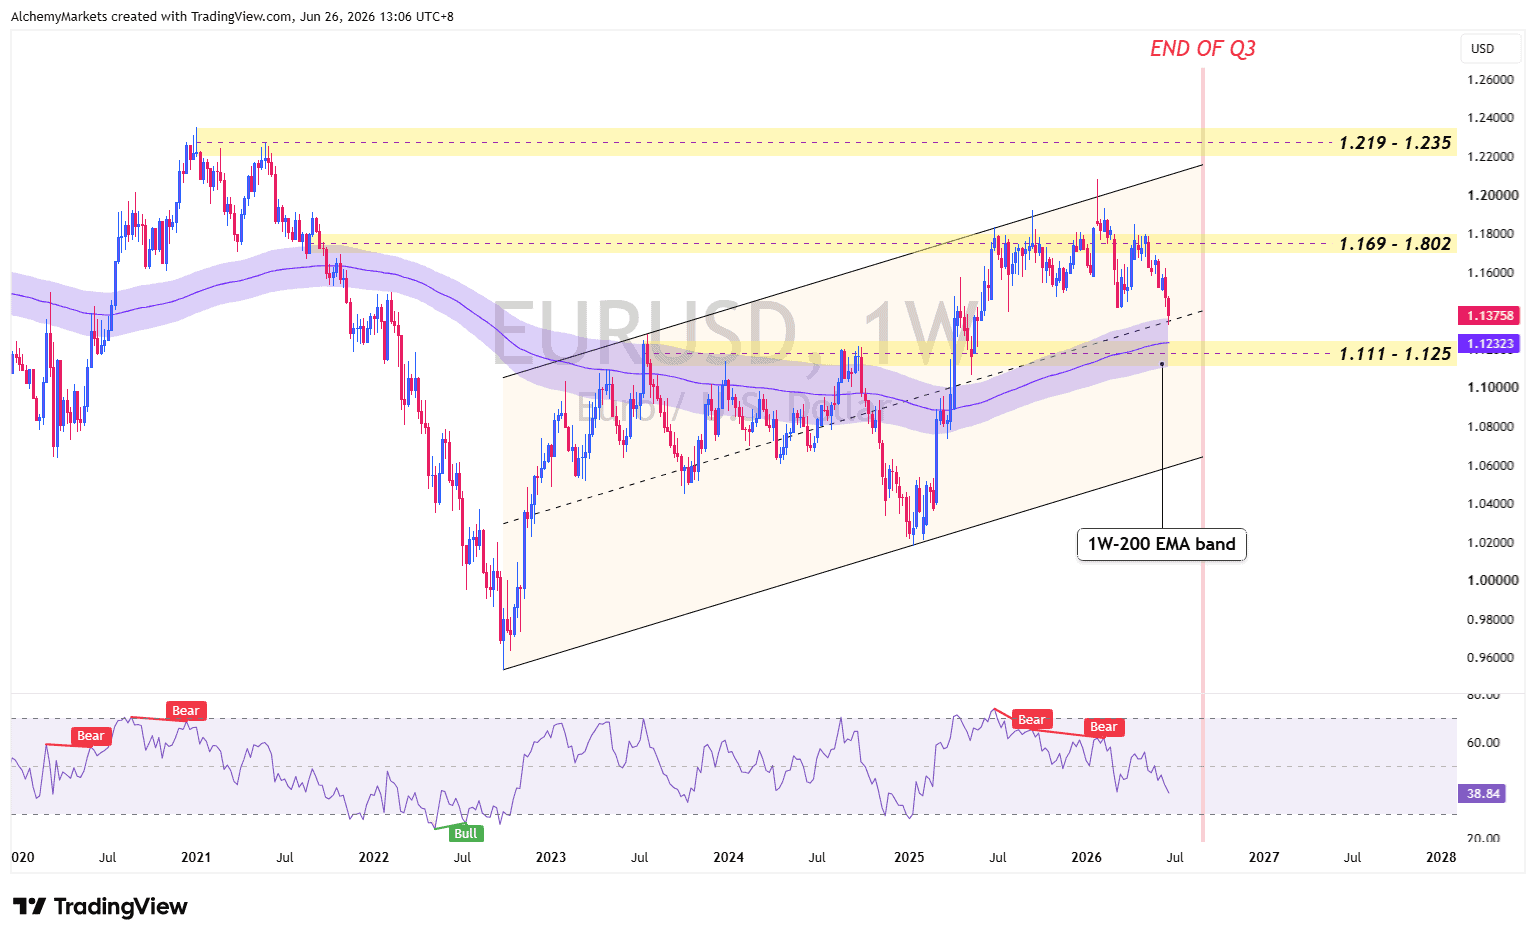
EURUSD: The 200W-EMA is the main support test
At the 26 June 2026 chart snapshot, EURUSD was testing weekly 200W-EMA support inside a rising channel. The rebound needs a DXY rejection and contained oil; stronger US yields or renewed energy stress would turn support into breakdown risk.
| i. Bullish: The 200W-EMA holds while DXY rejects resistance. ii. Target: The upper channel and next weekly resistance zone. iii. Invalidation: A weekly channel break with higher US yields or renewed oil stress. |
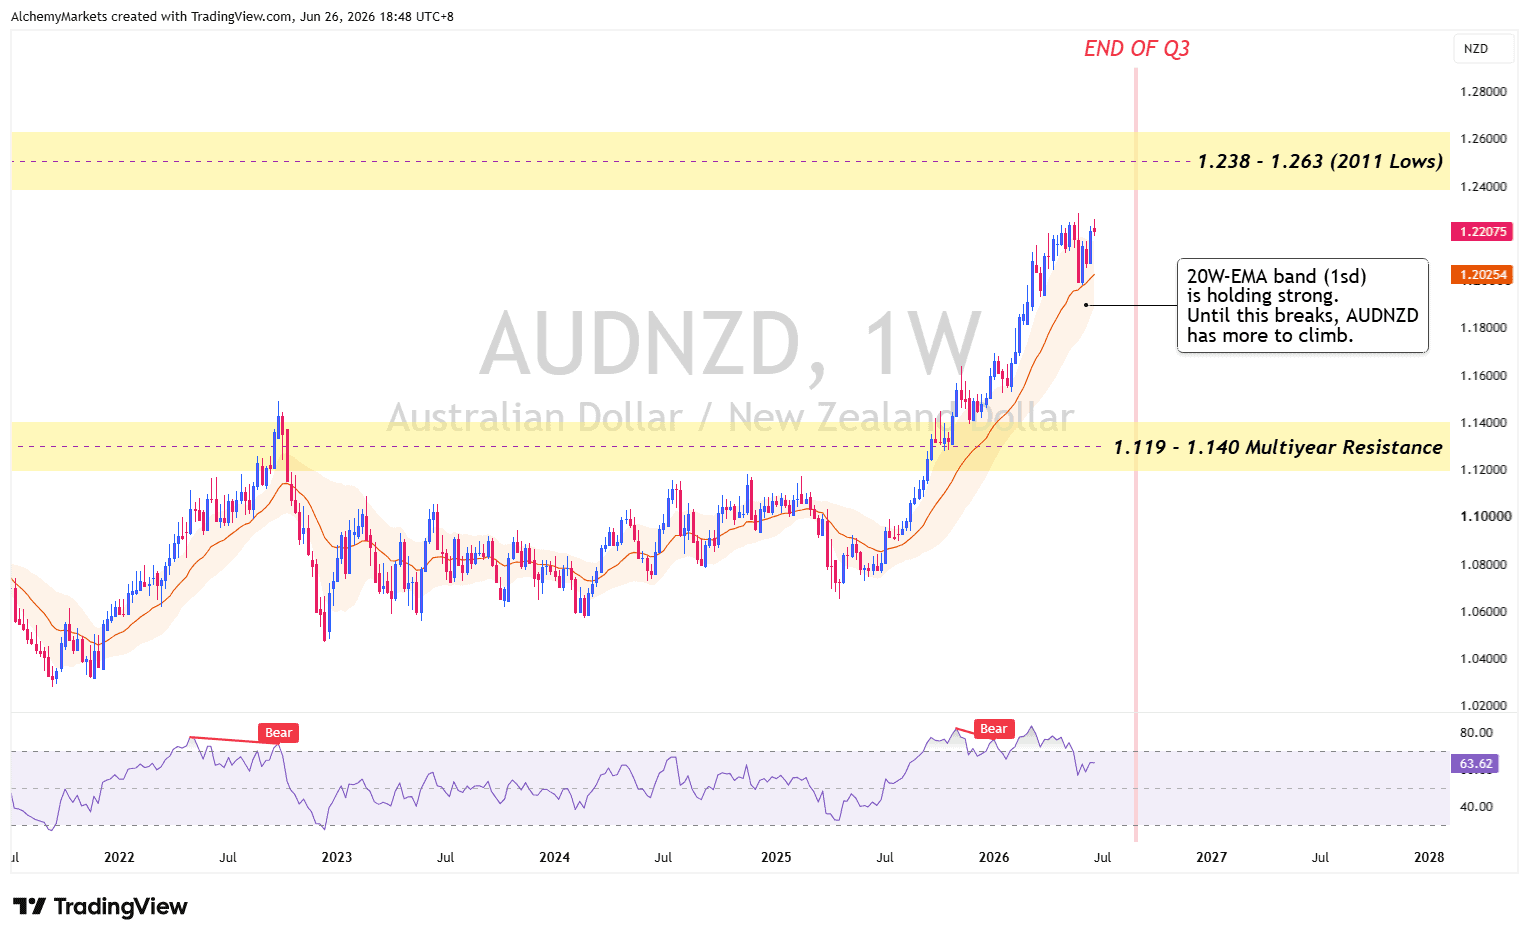
AUDNZD: The cleanest non-USD policy divergence
AUDNZD keeps the article from relying on the dollar alone. The structural breakout remains supported by the rising 20W-EMA band, but the pair is extended, so meaningful pullbacks are preferable to chasing.
| i. Approach: Wait for a meaningful pullback rather than chase. ii. Support: The rising 20W-EMA band remains the key trend reference. iii. Risk: A more hawkish RBNZ or a broad carry unwind. |
Final view
The dollar begins Q3 with a fundamental advantage. Inflation, relative growth and restrictive Fed policy support USD, while DXY must still clear weekly resistance before a broader breakout is confirmed.
The larger vulnerability lies in the assets around the dollar. If higher yields, oil volatility or geopolitical stress destabilise carry trades, USD can strengthen against cyclical currencies even as JPY outperforms through AUDJPY and GBPJPY declines.