


Verfasst von:


- Opening Bell
- September 22, 2026
- 3 Min. Lesezeit
GDX Breaks Bull Flag as Yields Retreat
Gold miners are back in focus as the market tries to work out whether the Federal Reserve’s latest hawkish shift can actually keep pushing US yields higher.
The Fed remains uncomfortable with inflation. Officials including Alberto Musalem and Austan Goolsbee have argued that persistent price pressures and strong demand could require further tightening, while markets continue to price the risk of additional rate hikes.
But the interesting development is happening in the bond market.
The US 2-year yield, which closely tracks expectations for Fed policy, initially surged on the more hawkish outlook but has since pulled back from its highs. Longer-dated yields have also eased, with the 10-year retreating below 5% as falling oil prices reduce some of the inflation premium that had built into Treasuries.
Oil has fallen sharply as reports of possible progress between the US and Iran raised hopes that the Strait of Hormuz could reopen, easing concerns around global supply. Brent has slipped back below $100 per barrel.
That creates an interesting setup for gold.
Ordinarily, higher yields and a stronger dollar are headwinds for gold, because gold produces no income and becomes relatively less attractive as real returns elsewhere increase. Indeed, gold itself has recently struggled as markets priced a higher-for-longer Fed path.
But if Treasury yields are beginning to struggle to extend higher despite hawkish Fed commentary, that pressure can start to ease.
For GDX, the VanEck Gold Miners ETF, the relationship can be amplified. Gold miners effectively have operational leverage to the gold price: once mining costs are covered, incremental moves in realised gold prices can have an outsized impact on cash flow and earnings. So a renewed move higher in gold can translate into a larger move across the miners.
Technical picture: bull flag breaks
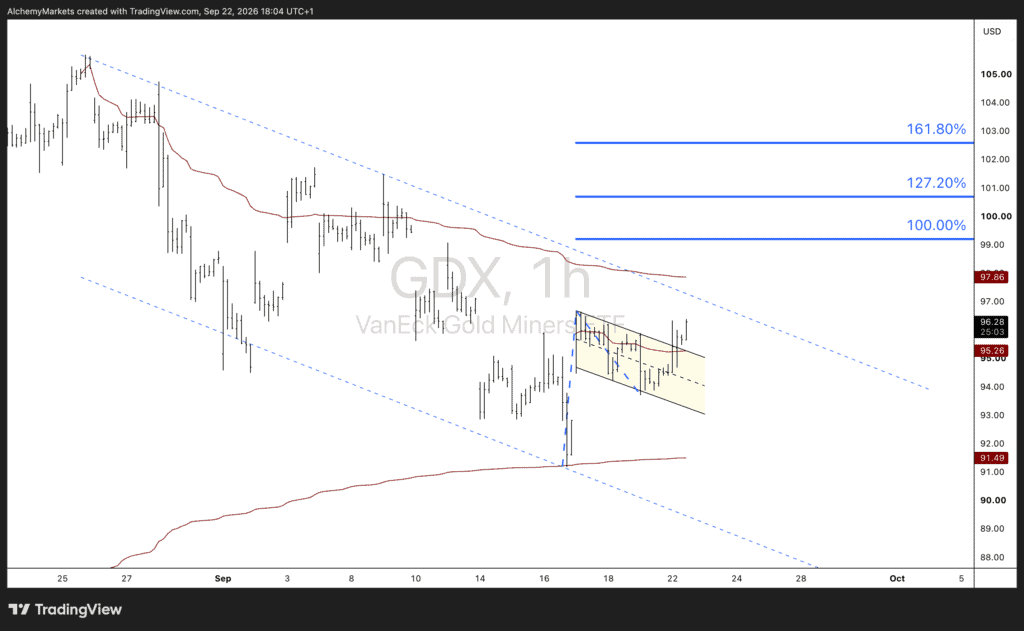
The 4-hour GDX chart is beginning to support that argument.
After the sharp rally from around $91, GDX consolidated inside a small bull flag, rather than giving back the initial move. Price has now broken above that flag structure, suggesting the correction may have been a pause within the broader recovery.
The first area to watch is around $99–100, corresponding with the 100% Fibonacci extension and nearby resistance.
Above that, the next upside zones sit around $101 and $102.5–103, corresponding approximately with the 127.2% and 161.8% extensions.
The important technical point is that GDX is attempting this breakout while holding well above the larger channel low around $91–92.
Opening Bell view
The fundamental and technical stories are beginning to line up:
Fed remains hawkish → but yields fail to extend higher → oil/inflation pressure eases → gold gets breathing room → GDX breaks its bull flag.
For now, the breakout keeps the near-term bias constructive. The next confirmation would be sustained trading above the flag and a push through the $99–100 resistance zone.
A reversal back inside the flag, particularly alongside another sharp rise in the 2-year yield and dollar, would weaken the setup.






