


Verfasst von:


- Elliott Wave
- Juli 12, 2024
- 2 Min. Lesezeit
Gold Elliott Wave: Rally Still Has Room to Run
Executive Summary
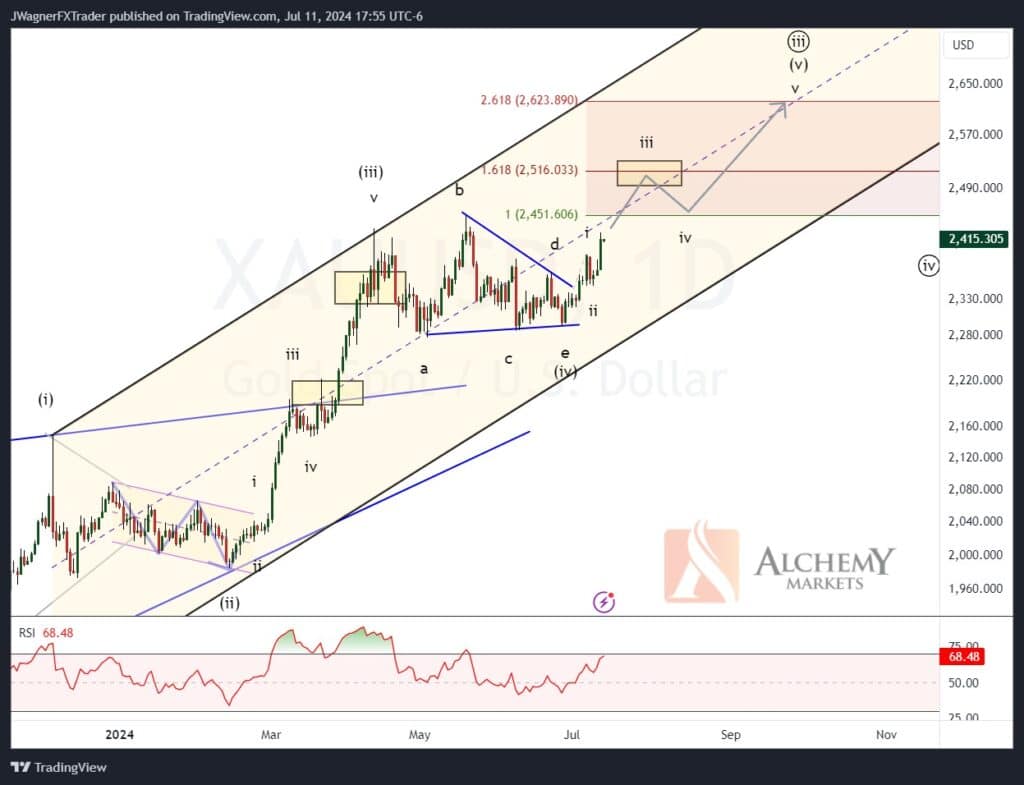
- Gold has broken higher out of a triangle pattern
- Gold may rally to $2516-2621
- Bullish key level is $2293
Gold Breaks Higher From Triangle Pattern
Gold has been rallying since late 2023 in an Elliott wave impulse pattern. The bullish impulse pattern is incomplete to the upside. However, the current impulse is on the latter half of the sequence as the rally beginning June 26 is viewed as a fifth and final wave.
In our Q3 forecast for gold, we analysed the market as nearing a bottom in a fourth wave.
Turns out, the fourth wave low was set into place on June 26 at $2293.
Therefore, the rally since June 26 is viewed as the fifth and final wave of the impulse pattern.
This fifth wave in gold should subdivide in 5-waves, either as an impulse or ending diagonal pattern. Zooming it, it appears to be shaping as a smaller bullish impulse pattern.
Current Elliott Wave Count on Gold
It appears gold is trending higher and is in wave iii of (v). We suspect wave iii will continue to press higher up to around $2516-2621 before finding a top.
Gold could rally further or not make it into that price zone. The price zone is derived using Elliott Wave best practices and Fibonacci wave relationships.
If gold falls below the June 26 low of $2293, then we’ll consider wave v complete or that another pattern was developing. In that circumstance, if it occurs, we’ll re-evaluate the pattern.
You might also be interested in:
GBPUSD – Beginning of 3rd Wave Rally?
Symmetrical Triangles – A Guide For Traders


