


Verfasst von:


- Elliott Wave
- Februar 4, 2025
- 2 Min. Lesezeit
GBP/USD Elliott Wave: Rally in Motion
Executive Summary
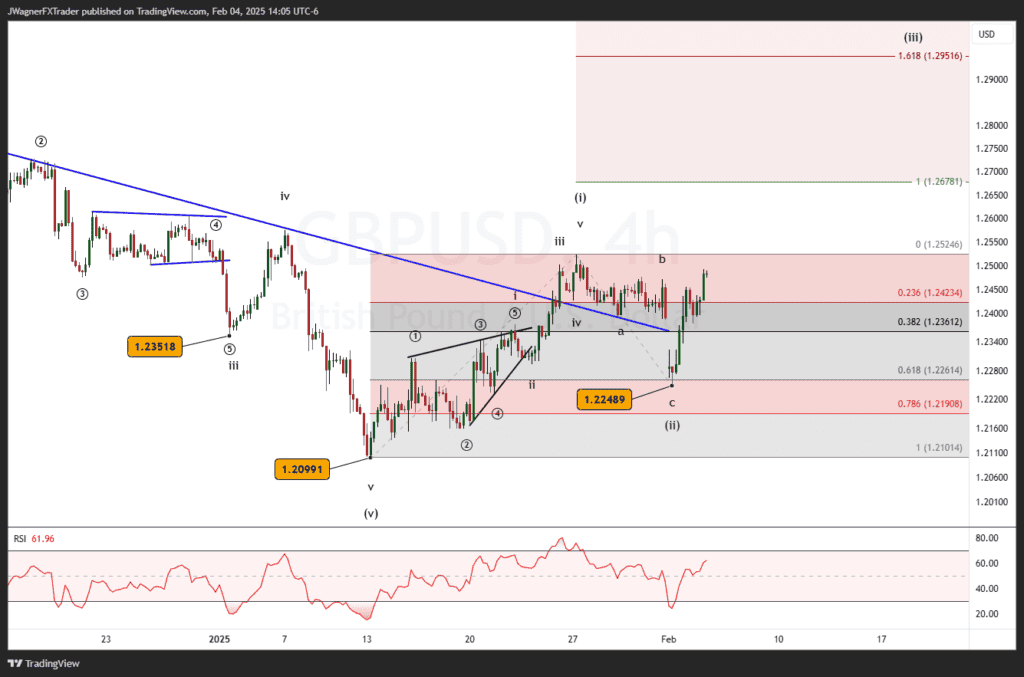
- Current Trend Bias: GBP/USD is in an impulsive rally, with Wave (iii) likely underway.
- Key Bullish Level to Watch: Bullish view while above the wave (ii) low at 1.2249.
- Target Levels: Near-term target levels at 1.2678, 1.2951, 1.3407
Current Elliott Wave Analysis
Higher Degree
The Elliott wave chart suggests that GBP/USD completed a five-wave decline at 1.2099, marking the termination of a Wave (v) at a minor degree. We were anticipating a major bullish reversal on January 10 near 1.2000. The decline could only make it to 1.2099 on January 13..
The pair has since reversed into an impulsive structure, indicative of a larger Primary Wave 3 rally (not shown) is unfolding. This aligns with the classic „impulse wave“ behavior, where a third wave is often the strongest.
Lower Degree
Zooming in, Wave (i) peaked at 1.2524, while Wave (ii) retraced deeply to 1.2249, respecting the 61.8% Fibonacci retracement level. The ongoing price action appears to be a developing Wave (iii), with the price breaking above the descending resistance trendline from earlier waves, signaling bullish momentum. Fibonacci extensions place the next resistance at 1.2951, coinciding with the 161.8% level, which is typical for extended Wave (iii) patterns.
Forecast
As long as prices remain above 1.2249, the rally should continue toward 1.2678 (100% extension) and potentially extend to 1.2951 (161.8%) or 1.3407 (261.8% extension). However, a break below 1.2249 may indicate a deeper correction, invalidating the impulsive structure.
Bottom Line
GBP/USD is in a bullish impulsive phase, with initial targets of 1.2678, 1.2951, and possibly 1.3407. Key support at 1.2249 should hold for the bullish scenario to remain valid.
You might also be interested in:


