


Verfasst von:


- Elliott Wave
- Mai 5, 2026
- 2 Min. Lesezeit
DJI Elliott Wave Forecast: Rolling Over
Executive Summary
- Trend Bias: Down as the Dow Jones Industrial Average (DJI) may have finalized its first bearish leg lower.
- Key Level: ~49,989 (start of the bearish wave).
- After a brief rally, we anticipate a decline to 47,758 – 48,409, and possibly lower levels.
While the mega cap stocks are rallying to new highs, DJI is struggling to reach its previous high of 49,988 on May 1. This divergence may signal a top developing for equities and a decline to about 48k and possibly lower levels.
Current Elliott Wave Analysis
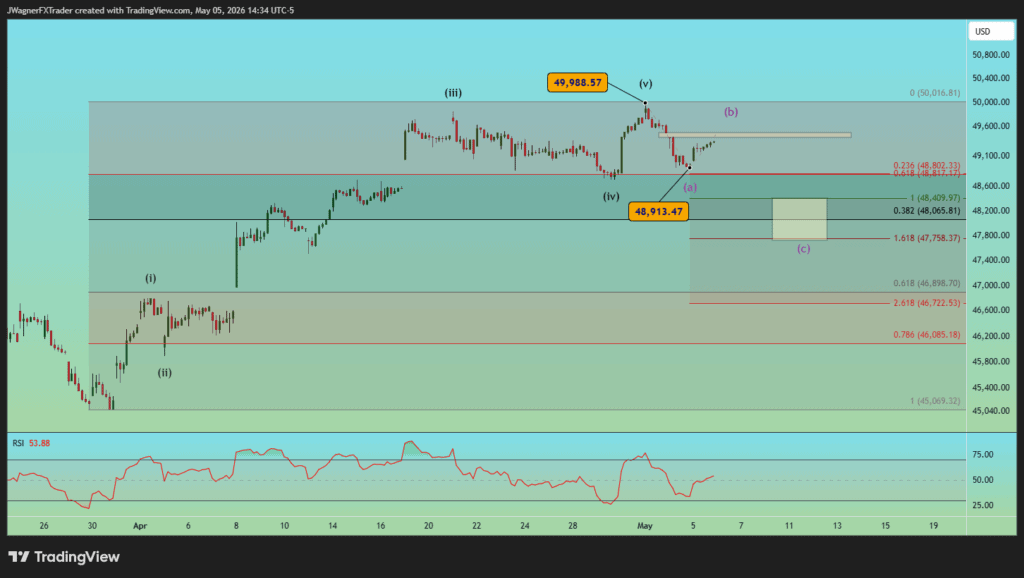
The rally from March 30 to May 1 formed a clear Elliott wave impulse pattern. This signals that a multi-week correction may have begun from 49,988.
The first leg lower of the correction trended to 48,913 shaping wave (a) or (i). Now, the rally up to today’s high is a portion of wave (b) or (ii). There is a small price gap that the current rally may try to jump up and fill. These gaps can act like magnets and eventual resistance in a downtrend.
The gap is carved between 49,441 – 49,497. Therefore, DJI may top in that price range, then begin to dig lower in wave (c ) or (iii). The downside targets range is 47,758 – 48,409 with even lower levels possible.
Embedded within this target price range is the 38% Fibonacci retracement level. It is likely the market will have a bullish reaction in this zone. Then we’ll reassess how mature the downtrend is.
Bottom Line
The DJI appears to have completed its first bearish wave lower with another secondary leg down just around the corner. DJI may rally to fill the gap between 49,441 – 49,497 and create a secondary high.
Once the next leg lower begins, we forecast it will trend down to 47,758 – 48,409 with even lower levels possible.
A print above 49,988 will cause us to reconsider the wave count.


