- Chart of the Day
- January 14, 2025
- 2 min read
S&P 500 Analysis: Elliott Wave Signals and PPI Insights

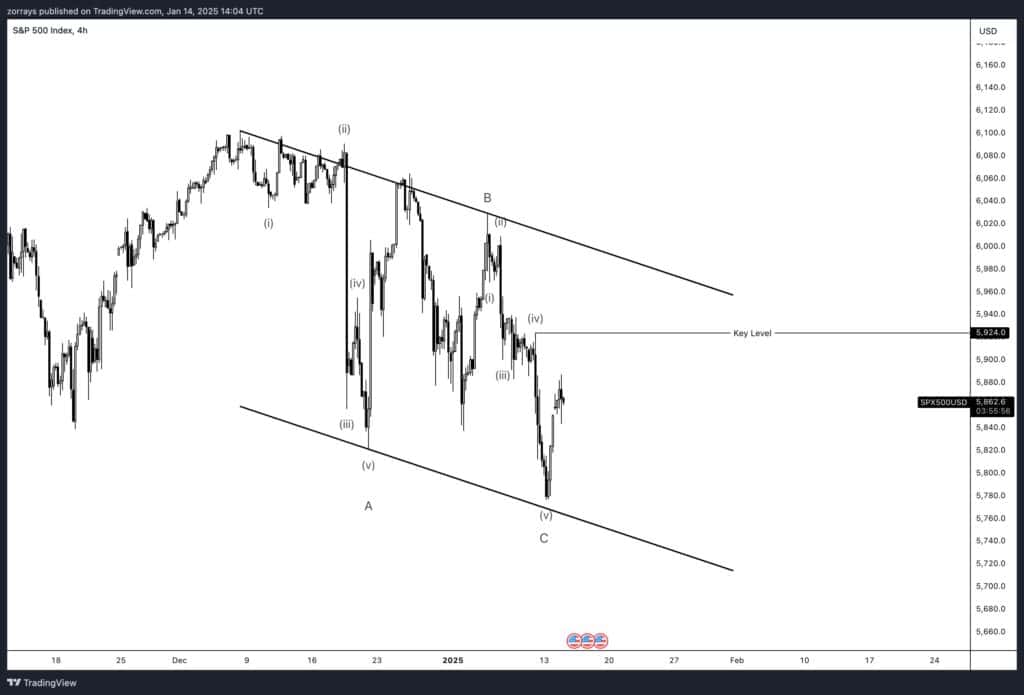
The S&P 500 (SPX) continues to reflect a corrective wave structure, with recent Elliott Wave analysis suggesting the index remains in a bearish corrective phase. The current wave count highlights a textbook zigzag pattern (ABC correction), with Wave A and Wave B completing and Wave C potentially wrapping up at the lower boundary of the channel near 5,850.
The market’s current rebound suggests a possible invalidation level at 5,924. If the SPX breaks above this level, it could indicate the beginning of a larger bullish reversal. Conversely, a failure to breach this resistance might suggest further downside, potentially extending below 5,850 to retest new lows.
Fundamental Backdrop
Today’s release of the December U.S. Producer Price Index (PPI) showed a modest 0.2% month-on-month increase, in line with expectations but below November’s 0.4% rise. This deceleration in wholesale inflation aligns with growing sentiment that inflationary pressures are easing. For equity markets, easing inflation could reduce the Federal Reserve’s urgency to cut rates aggressively.
However, with the Fed remaining cautious, its focus may shift to core inflation metrics and employment data. As the PPI feeds into the Fed’s preferred inflation measure—the core PCE—today’s figures might provide some breathing room for policymakers. That said, tomorrow’s Consumer Price Index (CPI) release will likely dictate the market’s next major move.
What It Means for the SPX
Combining Elliott Wave technicals with the fundamentals, the SPX seems poised at a critical juncture. The slowing inflation, as reflected in today’s PPI, aligns with the potential completion of Wave C in the Elliott Wave structure. If inflationary pressures ease further, it could create a favorable environment for equities to recover from their corrective phase.
For now, traders should monitor the 5,924 level closely, as a break above could indicate bullish momentum returning. Failure to do so might result in further downside, completing the corrective structure and potentially setting the stage for a more sustainable rally in the future.
In summary, the interplay between technical and fundamental factors places the SPX at a pivotal moment, with tomorrow’s CPI data expected to deliver the next critical signal.


