- Chart of the Day
- January 8, 2025
- 4 min read
Energy Market Update: Challenges for Iranian Oil and Rising Gold Demand
The energy and commodities markets are navigating a mix of challenges and opportunities, with key developments in crude oil, gas, and metals.
Crude Oil: Iranian Flows Face New Hurdles

Brent crude prices climbed above $77 per barrel, supported by a stronger physical market and concerns about Iranian and Russian oil supplies. Reports suggest a port operator in Shandong, China, may restrict tankers under U.S. sanctions. This could complicate Iranian crude oil exports, as Chinese refiners are significant buyers of this oil.
Adding to the bullish sentiment, U.S. crude oil inventories dropped by 4 million barrels last week, according to the American Petroleum Institute (API). Stocks at Cushing, a major storage hub, also fell by 3.1 million barrels. However, gasoline and distillate inventories rose by 7.3 million barrels and 3.2 million barrels, respectively, offering a mixed picture for the broader market.
The official inventory data from the Energy Information Administration (EIA) is expected later today and will provide more clarity.
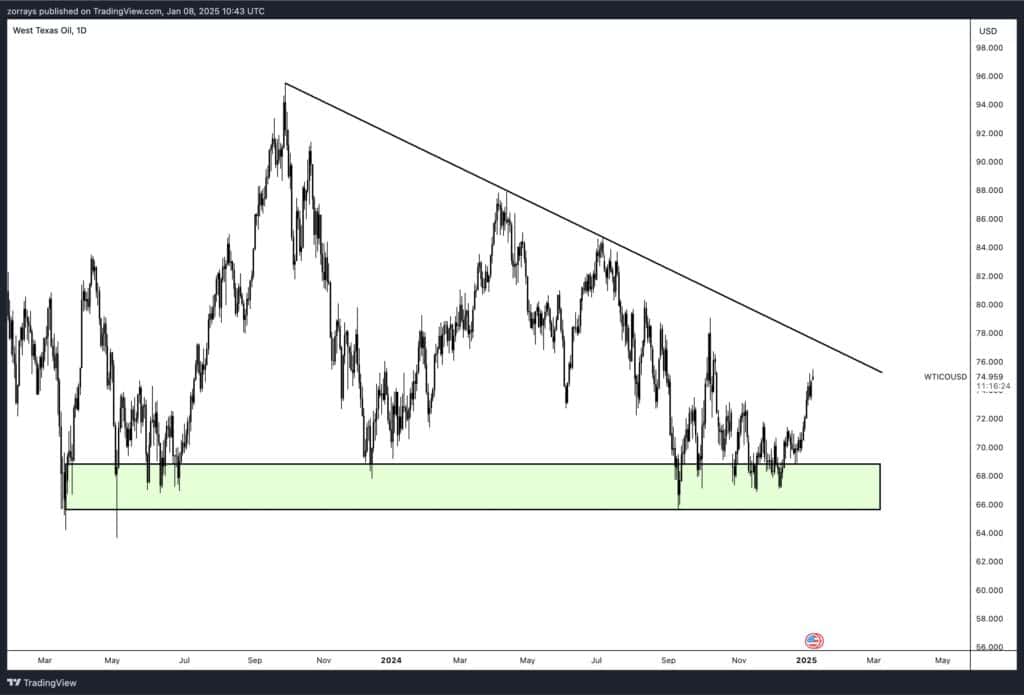
From a technical analysis perspective, the WTI crude oil daily chart shows the price currently consolidating within a critical range, bounded by a descending trendline on the upside and a strong horizontal support zone at $67–$70 on the downside.
Key Levels and Observations:
- Trendline Resistance:
The descending trendline is drawn from the series of lower highs formed since mid-2022, reflecting consistent bearish control. This line has been respected multiple times, indicating strong selling pressure at higher levels. The current price at ~$75 is approaching this trendline, which will act as immediate resistance. - Support Zone:
The horizontal support region between $67 and $70 has been tested several times and has held firm, marking it as a critical demand zone. This level represents buyers stepping in to defend further downside, creating a base for price action. - Volume Analysis:
Trading volume within this range has remained subdued, signaling a lack of conviction from both bulls and bears. A significant spike in volume would likely precede any breakout or breakdown. - Indicators:
Momentum oscillators such as the RSI are likely neutral or slightly bullish, reflecting the price recovery from support but still constrained below the trendline. Moving averages (e.g., 50-day and 200-day) may be aligning near current levels, adding further confluence to the breakout zone.
Scenarios to Watch:
- Bullish Breakout:
- A break and close above the descending trendline, accompanied by higher volume, would invalidate the bearish structure.
- Key upside targets include $78 (near-term resistance) and $85 (higher swing levels).
- Bearish Breakdown:
- A break below the $67-$70 support zone would confirm bearish continuation, with the next major support levels around $63 and $60.
- This move would align with the larger downtrend and likely attract further selling pressure.
Conclusion:
Until the price decisively breaks out of this consolidation range, WTI remains in a state of indecision. Traders should monitor price action near the trendline and support zone, as these levels are critical for determining the next directional move.
European Gas: Storage Concerns
European natural gas prices initially dipped but regained strength, with TTF gas settling slightly higher. EU gas storage levels are currently 69% full, a significant drop from 85% this time last year and below the five-year average of 75%. This decrease, coupled with colder-than-expected weather, is raising concerns about potential supply tightness during winter.
Metals: China Boosts Gold Reserves
China’s central bank continues to buy gold, increasing its holdings for the second month in December. This move comes even as gold prices hover near record highs. The central bank now holds 73.29 million troy ounces, up from 72.96 million ounces in November.
Industrial metals, on the other hand, have started the year on a weaker note. Geopolitical tensions, questions about China’s economic recovery, and concerns over potential U.S. tariffs on Chinese goods are weighing on the market. Aluminium stocks saw significant withdrawals from LME warehouses, particularly in Malaysia, while overall exchange inventories are at their lowest levels since May 2024.


