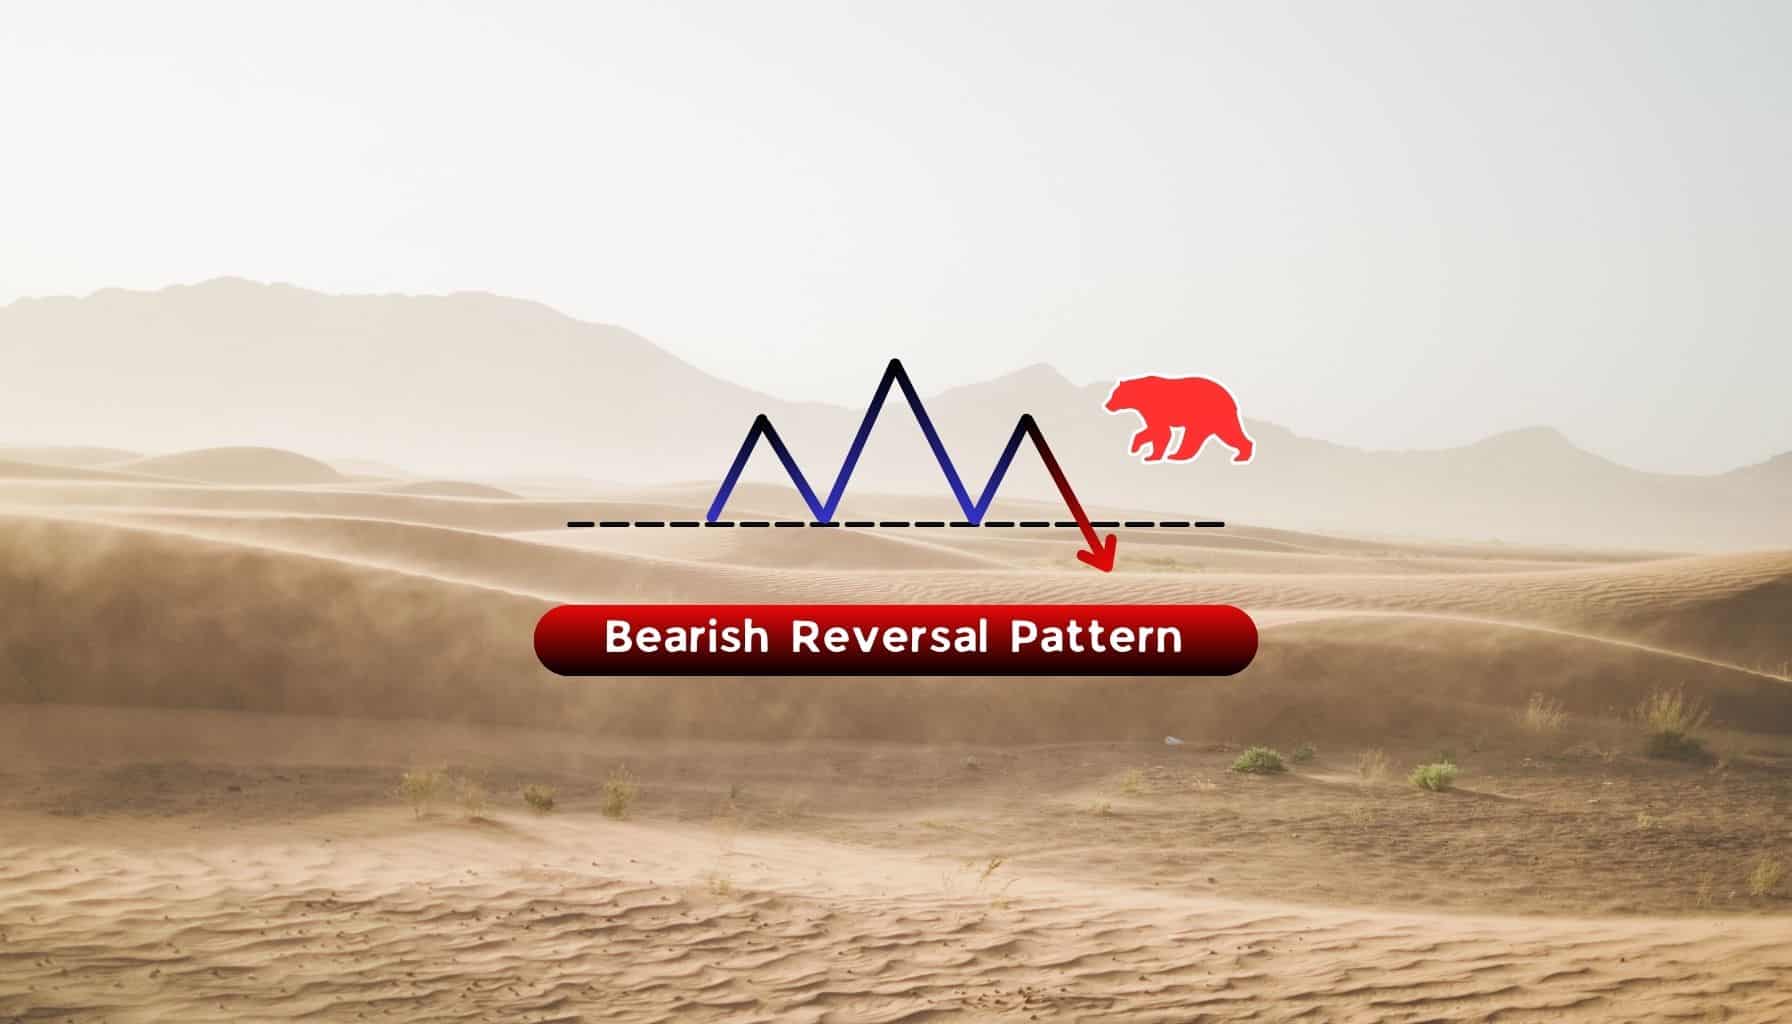
Bearish
- November 28, 2024
- 28 min read
Head and Shoulders Pattern Trading Guide
Key Takeaways
- The head and shoulders chart pattern is a widely respected indicator for signalling a trend reversal from up to down, offering traders a reliable tool for anticipating market shifts.
- This pattern features three peaks: a central, higher peak (the head) flanked by two lower peaks (the shoulders), creating a distinct and recognizable shape.
- Enhance the effectiveness of trading the head and shoulders pattern by integrating risk management strategies, such as stop losses, and combining it with other trading techniques like support and resistance levels and moving averages.
What is the Head and Shoulders Chart Pattern?
The head and shoulders is a reversal chart pattern that technical traders use to signal a shift in momentum from an uptrend to a downtrend.
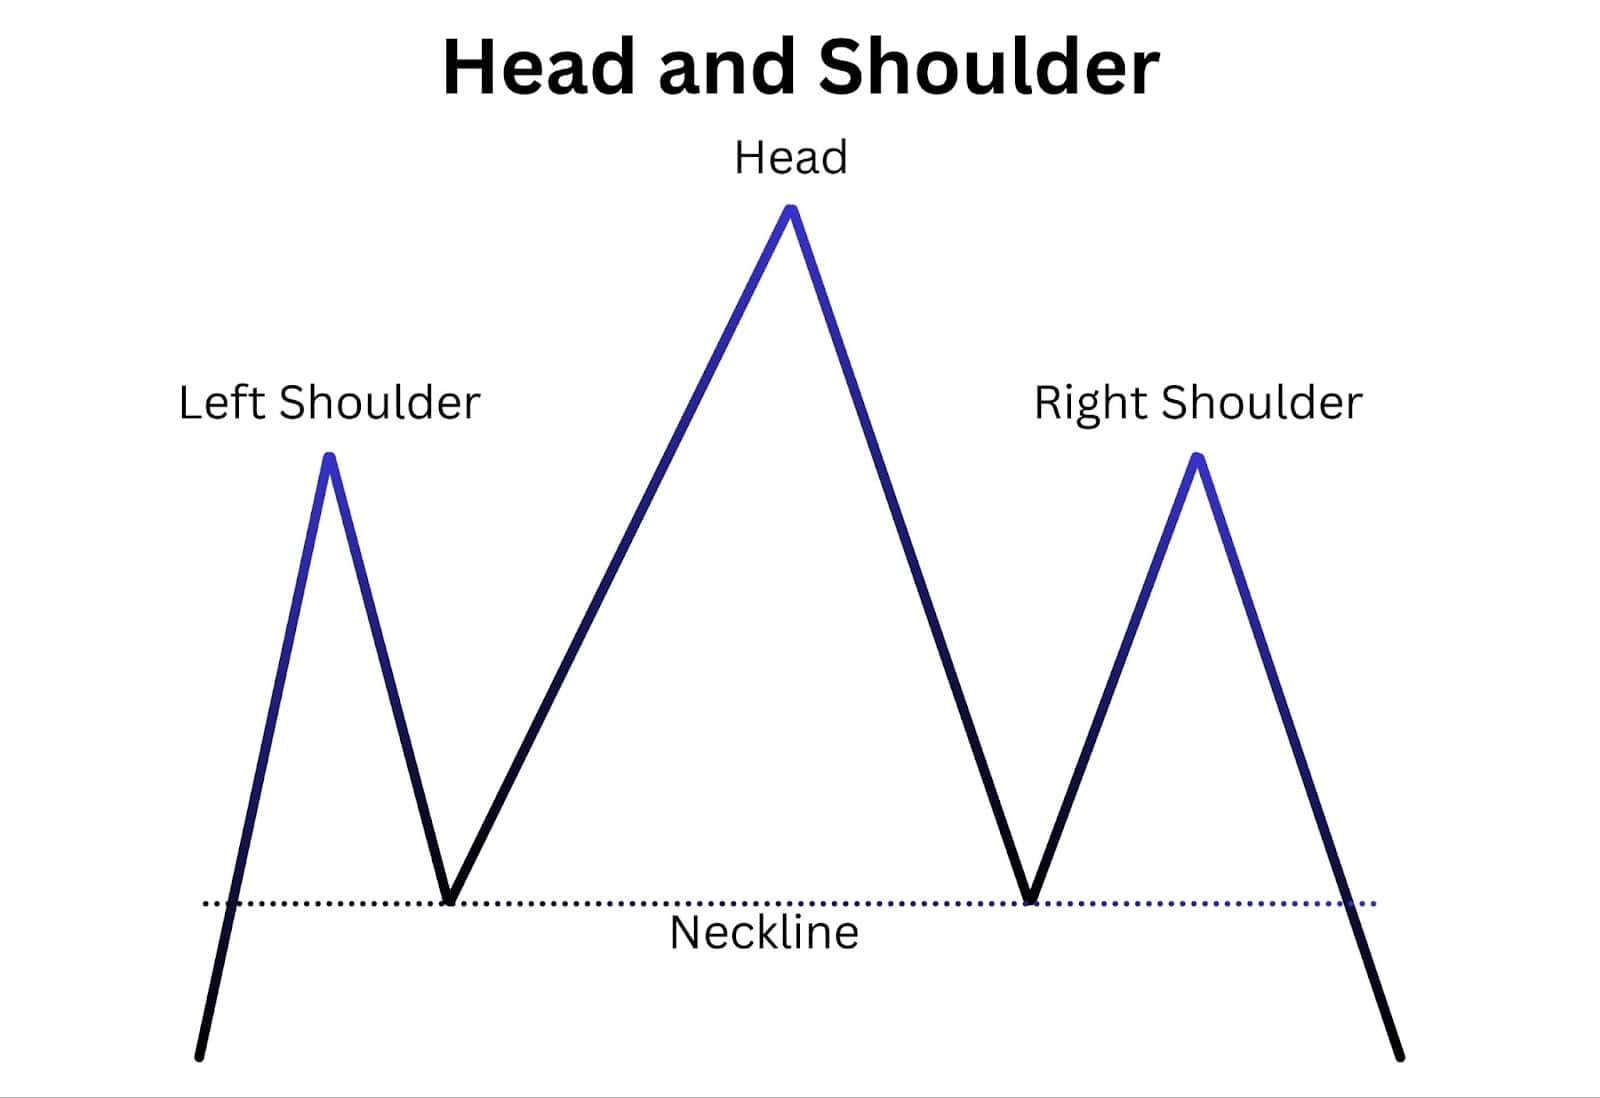
This pattern is visually distinct, featuring three peaks that resemble mountains on the horizon. The middle peak, known as the head, is the tallest, while the two outer peaks, called the shoulders, are of similar height. The pattern looks like two shoulders flanking a head, hence the name.
The formation begins with the left shoulder, where the asset’s price rises and then returns to the base level. This is followed by a surge to a new high, forming the head. Finally, the price rises again, reaching a level similar to the left shoulder, creating the right shoulder.
Recognising this pattern is crucial during an upward trend because it often precedes a bearish reversal. When you spot this formation, it’s a signal to prepare for potential downward movement in the asset’s price.
How to Identify the Head and Shoulders Pattern?
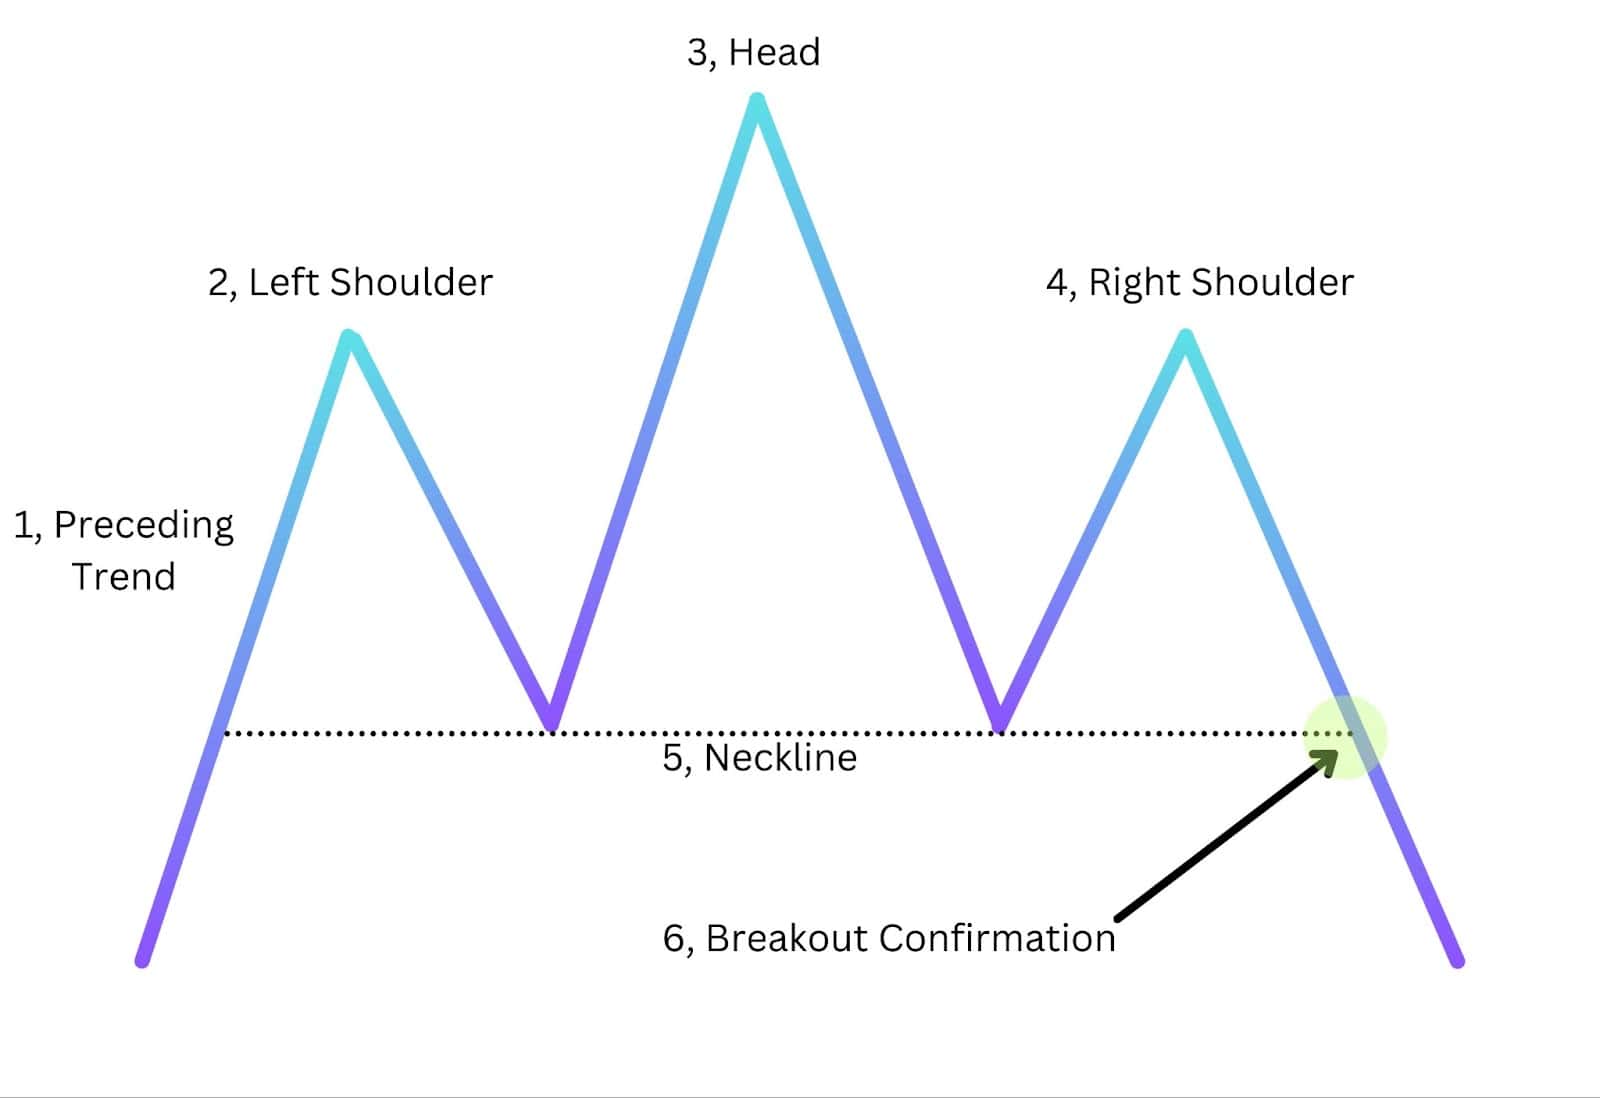
The head and shoulders pattern is a classic reversal pattern signalling a shift from an uptrend to a downtrend. This pattern is found by spotting these six components:
- Preceding Uptrend: The head and shoulders pattern begins with a significant uptrend.
- Left Shoulder: Identify the first peak followed by a trough, which sets the initial support level.
- Head: Observe a higher peak forming, followed by a decline to a similar level as the first trough.
- Right Shoulder: Look for a third peak that is lower than the head but approximately near the same price level as the left shoulder, followed by another decline.
- Neckline: Draw a line connecting the troughs after the left shoulder and before the right shoulder. The neckline must either be horizontal or with a slight upward slope. It must not be sloping in a descending fashion. More on this down below.
- Breakout Confirmation: Wait for the price to break below the neckline, confirming the pattern and signalling a potential downward reversal.
By following these steps, traders can effectively spot the head and shoulders pattern and use it to make informed trading decisions.
The image below depicts the idealised formation of the head and shoulder pattern.
What Does the Head and Shoulders Pattern Tell You?
Spotting a head and shoulders pattern can be highly beneficial for traders. Essentially, it serves as a warning sign that the bullish trend might be nearing its end, and a bearish reversal could be on the horizon. This pattern indicates a turning point in market sentiment, shifting from bullish to bearish.
When traders identify this pattern, they often see it as a chance to adjust their positions to mitigate potential losses or to take advantage of the impending downtrend. The head and shoulders pattern is more than just a visual cue; it signifies a shift in market psychology. The initial enthusiasm and buying pressure that created the left shoulder and head begin to wane, while the right shoulder represents a final attempt to push prices higher before sellers gain control.
Key Benefits of Spotting a Head and Shoulders Pattern:
- Early Warning of Trend Reversal: Recognize the end of a bullish trend and prepare for a bearish reversal.
- Adjust Trading Positions: Modify positions to mitigate losses or capitalise on the downtrend.
- Insight into Market Psychology: Understand the waning buying pressure and the shift to seller dominance.
- Strategic Decision-Making: Make informed choices, such as selling assets or shorting the market.
- Risk Management: Employ strategies to protect investments based on the pattern’s indications.
Importance of Head and Shoulders Pattern
The head and shoulders pattern is more than just a fancy name or a visible chart pattern. The head and shoulders chart marks crucial points in the market’s trend.
- Predicts Potential Trend Reversal: It alerts market participants to the potential of a trend reversal from bullish to bearish.
- Strategy Planning and Risk Management: The head and shoulder pattern provides clear signals for entries, stop losses, and profit targets for traders. This further helps traders navigate the market with good risk-to-reward ratio trade opportunities.
The importance of the head and shoulders pattern goes beyond its basic structure. For example, the duration of the trend leading up to the pattern can impact its reliability. A well-established trend is more likely to result in a significant reversal when the head and shoulders pattern appears.
Furthermore, the pattern’s versatility across different time frames makes it a valuable tool for both short-term and long-term traders. Whether you are day trading or looking at weekly charts, the pattern can provide insights into potential market movements.
Head and Shoulders vs Inverse Head and Shoulders
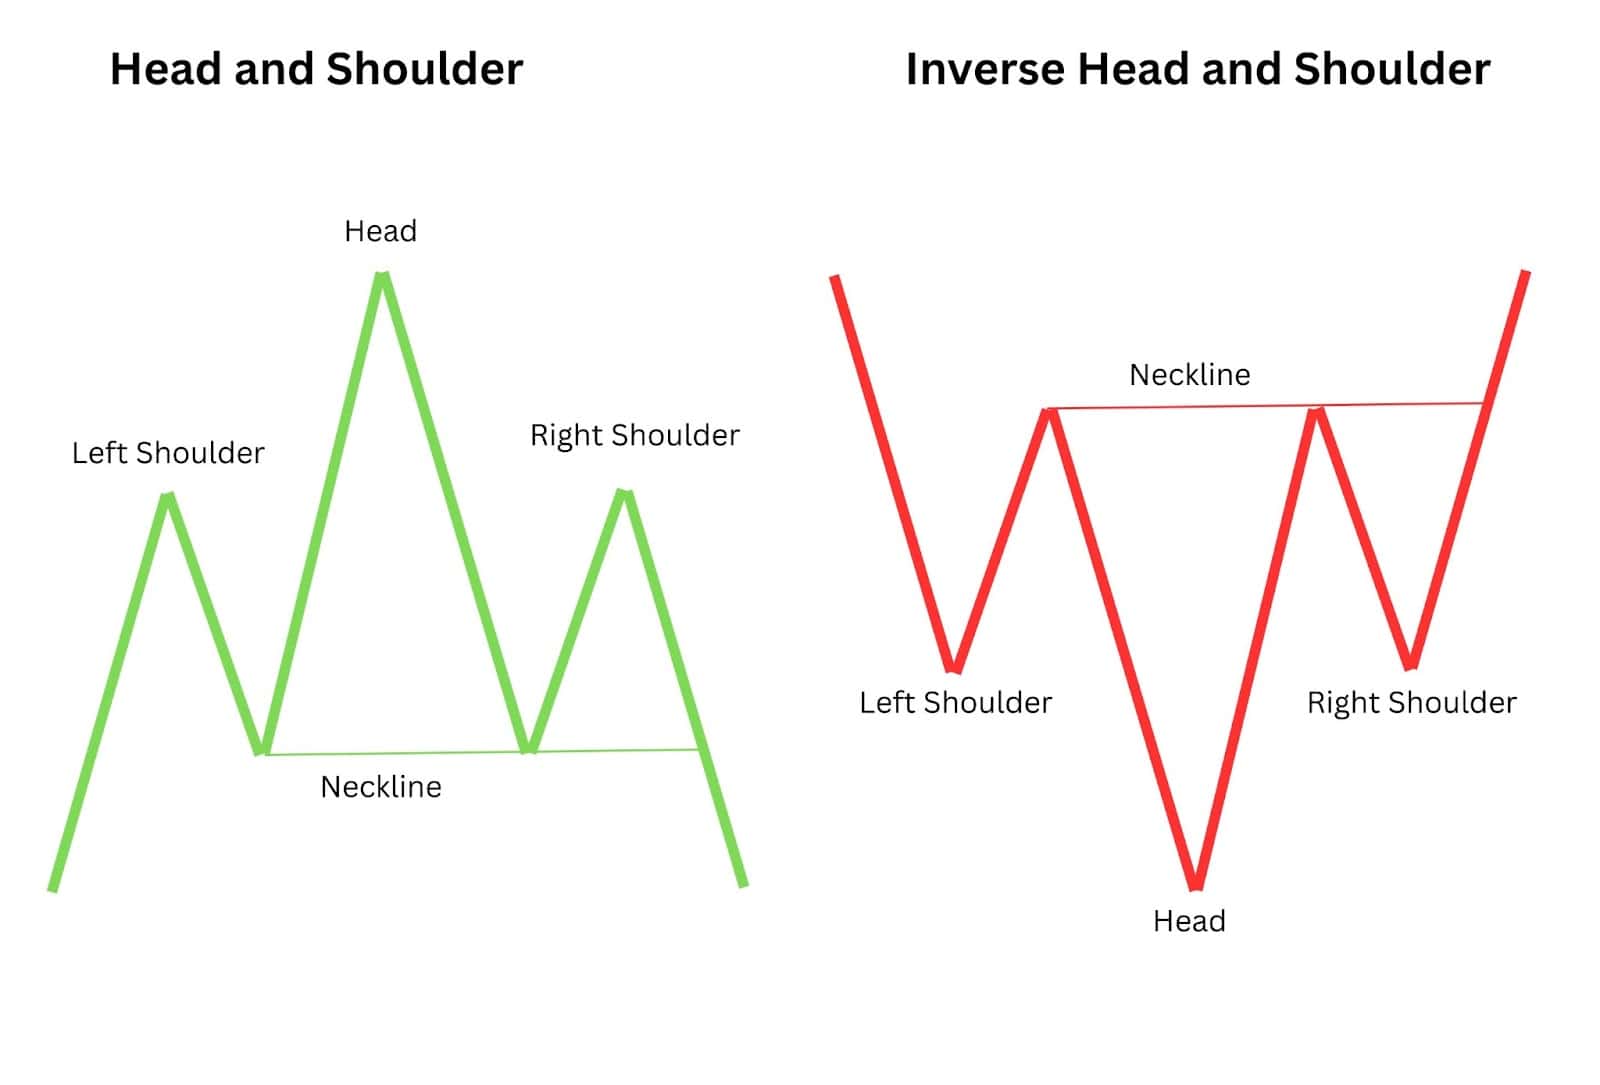
While the regular head and shoulders pattern is a harbinger of a bearish reversal, its counterpart, the inverse head and shoulders, signals the opposite—a bullish reversal. Also known as a head and shoulders bottom or upside-down head, the inverse pattern comprises three consecutive lows, with the middle one being the lowest, indicating a shift from a bearish to a bullish trend.
Regular Head and Shoulders Pattern:
- Indicates: Bearish Reversal
- Formation: Three peaks with the middle peak (head) being the highest, flanked by two lower peaks (shoulders).
- Market Sentiment: Signals that the bullish trend is ending, and a bearish trend is beginning.
- Usage: Traders use this pattern to identify potential sell-off points after an uptrend.
Inverse Head and Shoulders Pattern:
- Indicates: Bullish Reversal
- Formation: Three consecutive lows, with the middle low (head) being the lowest, flanked by two higher lows (shoulders).
- Market Sentiment: Suggests that the bearish trend is ending, and a bullish trend is beginning.
- Usage: Traders and investors look for this pattern during market corrections or bear markets to signal the end of a downtrend, providing an opportunity to buy at relatively low prices before the trend reverses and prices start to rise again.
Key Characteristics of the Inverse Head and Shoulders Pattern:
- Formation during Downtrend: Often forms during market corrections or bear markets.
- Diminishing Selling Pressure: Indicates that the selling pressure is decreasing, and buyers are starting to gain control.
- Volume Increase: Accompanied by an increase in trading volume, which further confirms the potential for a trend reversal.
- Neckline Breakout: Requires confirmation by breaking above the neckline before taking a long position. This breakout is a strong signal that the new bullish trend is underway.
- Risk Management: Proper risk management strategies, such as setting stop losses below the right shoulder, are essential to mitigate potential losses if the pattern fails to follow through.
Conclusion: In short, the head and shoulders pattern identifies potential sell-off points after an uptrend, signalling a bearish reversal. Conversely, the inverse head and shoulders pattern identifies potential buy-in points after a downtrend, signalling a bullish reversal.
How Head and Shoulder Patterns Signal Reversals

The true strength of the head and shoulders formation lies in the pattern’s exhaustion or weakness. To understand this better, think of the head and shoulders pattern like a story of a mountain climber:
The First Climb (Left Shoulder):
- Initial Ascent: Our climber starts climbing up a hill and reaches a certain height.
- Preparation for Bigger Climb: Realising it’s not the peak, he descends a little to prepare for a more significant climb.
The Big Climb (Head):
- Taller Mountain: Now, he climbs a much taller mountain, reaching higher than the first hill.
- Temporary Retreat: Unable to stay at the peak, he descends again to around the same place where he started after the first hill.
The Last Climb (Right Shoulder):
- Final Attempt: He gives it another go and climbs another hill.
- Exhaustion: This time, after already climbing two mountains, he is exhausted and cannot go as high as the tallest peak.
- Descent: After reaching the top of the third hill, he descends once more.
In this story, the climber’s journey up and down the hills and mountains forms a pattern that looks like a person’s head and shoulders. In trading, when we see this pattern on a chart, it’s like the climber telling us, “I’ve tried climbing three times, and I can’t go any higher because I’m exhausted and weak.” This signals that the price, which has been climbing, is now likely to start going down, just like our climber.
These shoulders pattern signals indicate potential trend reversals, particularly emphasising the shift from bullish to bearish trends.
Technical Analysis on the Price Chart:
- Neckline and Support: On the price chart, up until the neckline is broken, we are witnessing higher highs and higher lows. Many traders see the neckline as a base of support, hoping the uptrend will continue.
- Trend Reversal Signal: However, similar to the mountain climber’s exhaustion, the inability to reach new heights signals a trend reversal.
Summary:
The head and shoulders pattern is a powerful indicator of market reversals. The climber’s story illustrates how this pattern signals exhaustion and the inability to maintain upward momentum, leading to a bearish reversal. Recognizing this pattern on a chart helps traders anticipate a shift from an uptrend to a downtrend, allowing for strategic adjustments in their trading approach.
Head and Shoulder Pattern Examples
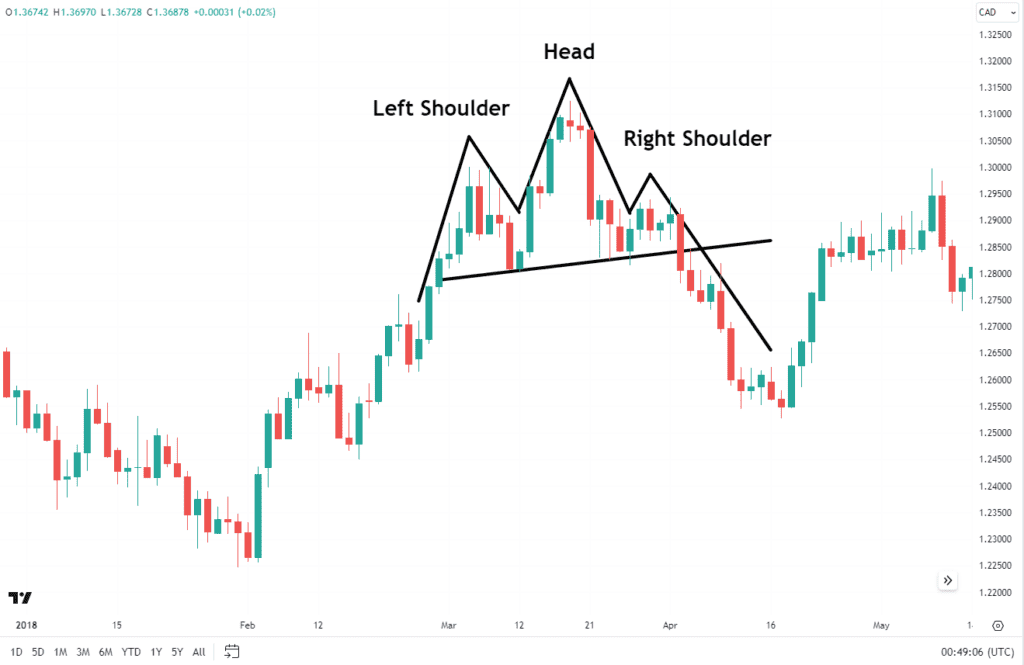
USD/CAD – Daily Timeframe
Source: TradingView
For better understanding, let’s delve into a real-life example of the head and shoulders pattern. Consider a Daily USD/CAD chart above featuring:
- A shoulders top at 1.3000, forms the left shoulder.
- A retrace to the neckline at around 1.2800
- A subsequent middle peak rises above 1.31200, forming the ”Head” of the Pattern.
- A retracement to the neckline just above the 1.2800 level.
- The right shoulder forms as both shoulders top near 1.29400 almost matching the left shoulder height.
The decisive drop through the neckline indicates a downtrend. Let’s take a look at another example, this time on the EURUSD Daily chart below.
EURUSD – Daily Timeframe
Source: TradingView
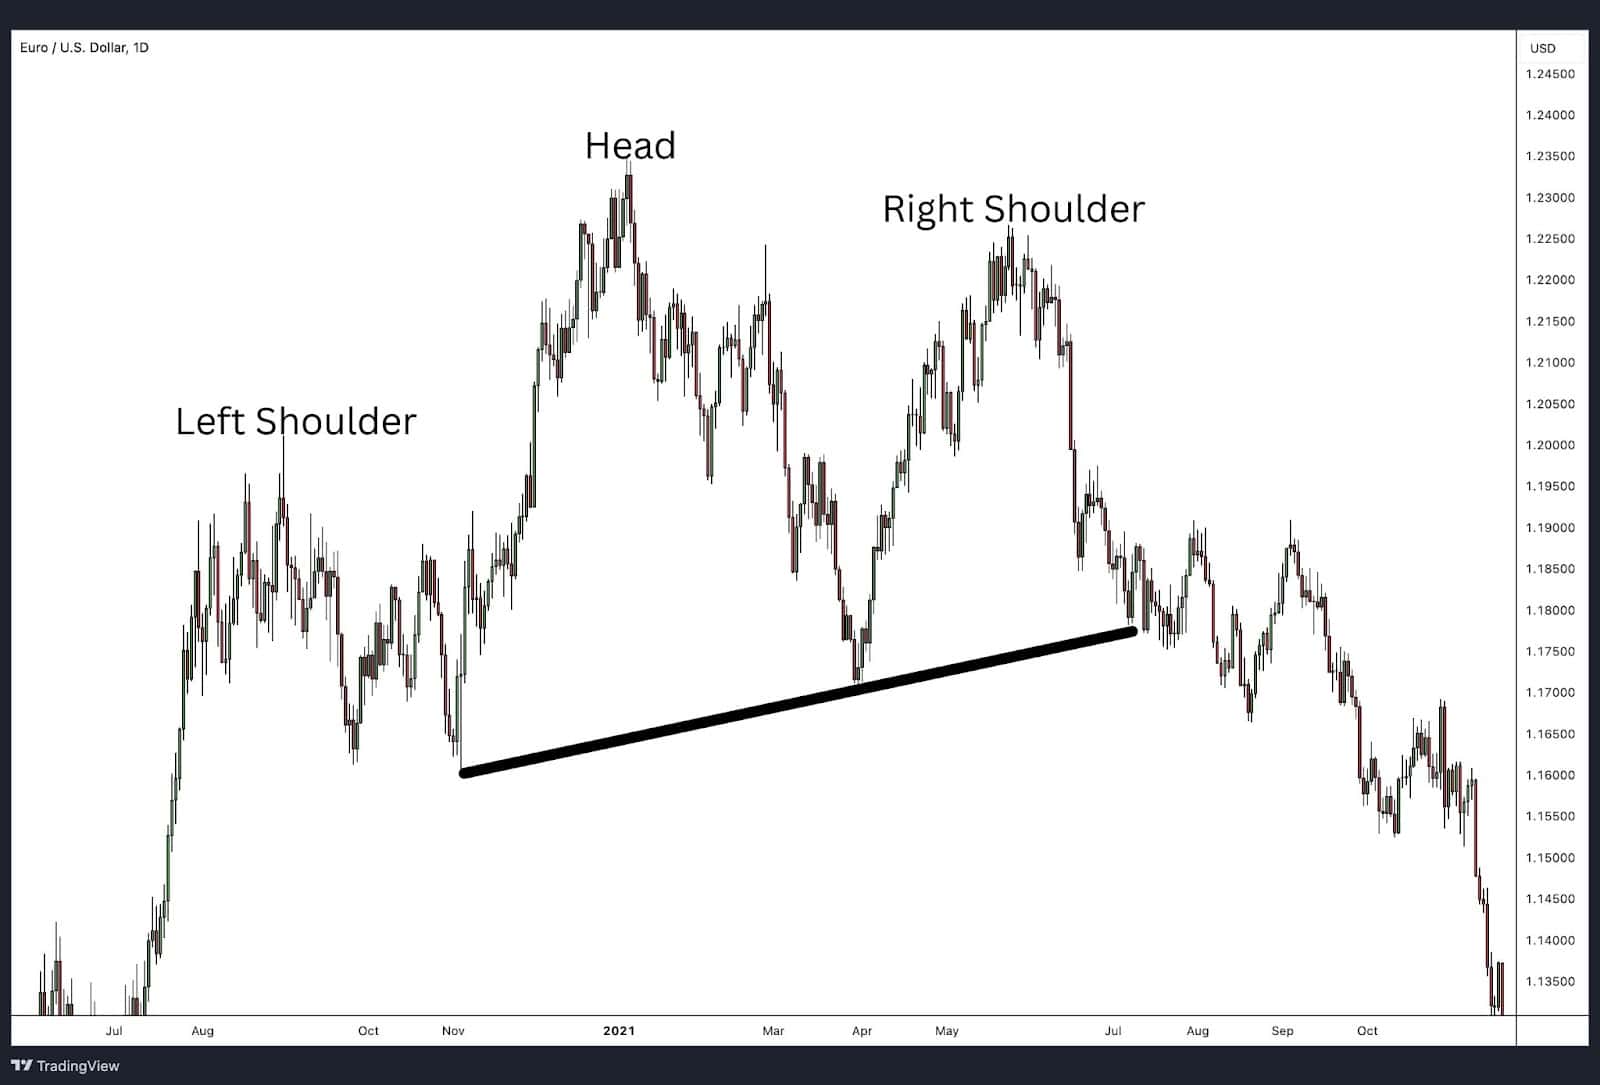
This chart illustrates a classic head and shoulders pattern on the EUR/USD daily chart, forming after an extended bullish trend. The key elements of this pattern are as follows:
- The left shoulder forms as the price peaks near 1.2050, followed by a retracement.
- The price then surges to a higher middle peak around 1.2350, forming the head.
- Another correction leads the price back down to the neckline, followed by a rise to about 1.2250, creating the shoulders top.
- Finally, the price breaks below the upward-sloping neckline, indicating a reversal and the start of a bearish trend.
GBPUSD – Daily Timeframe
Source: TradingView
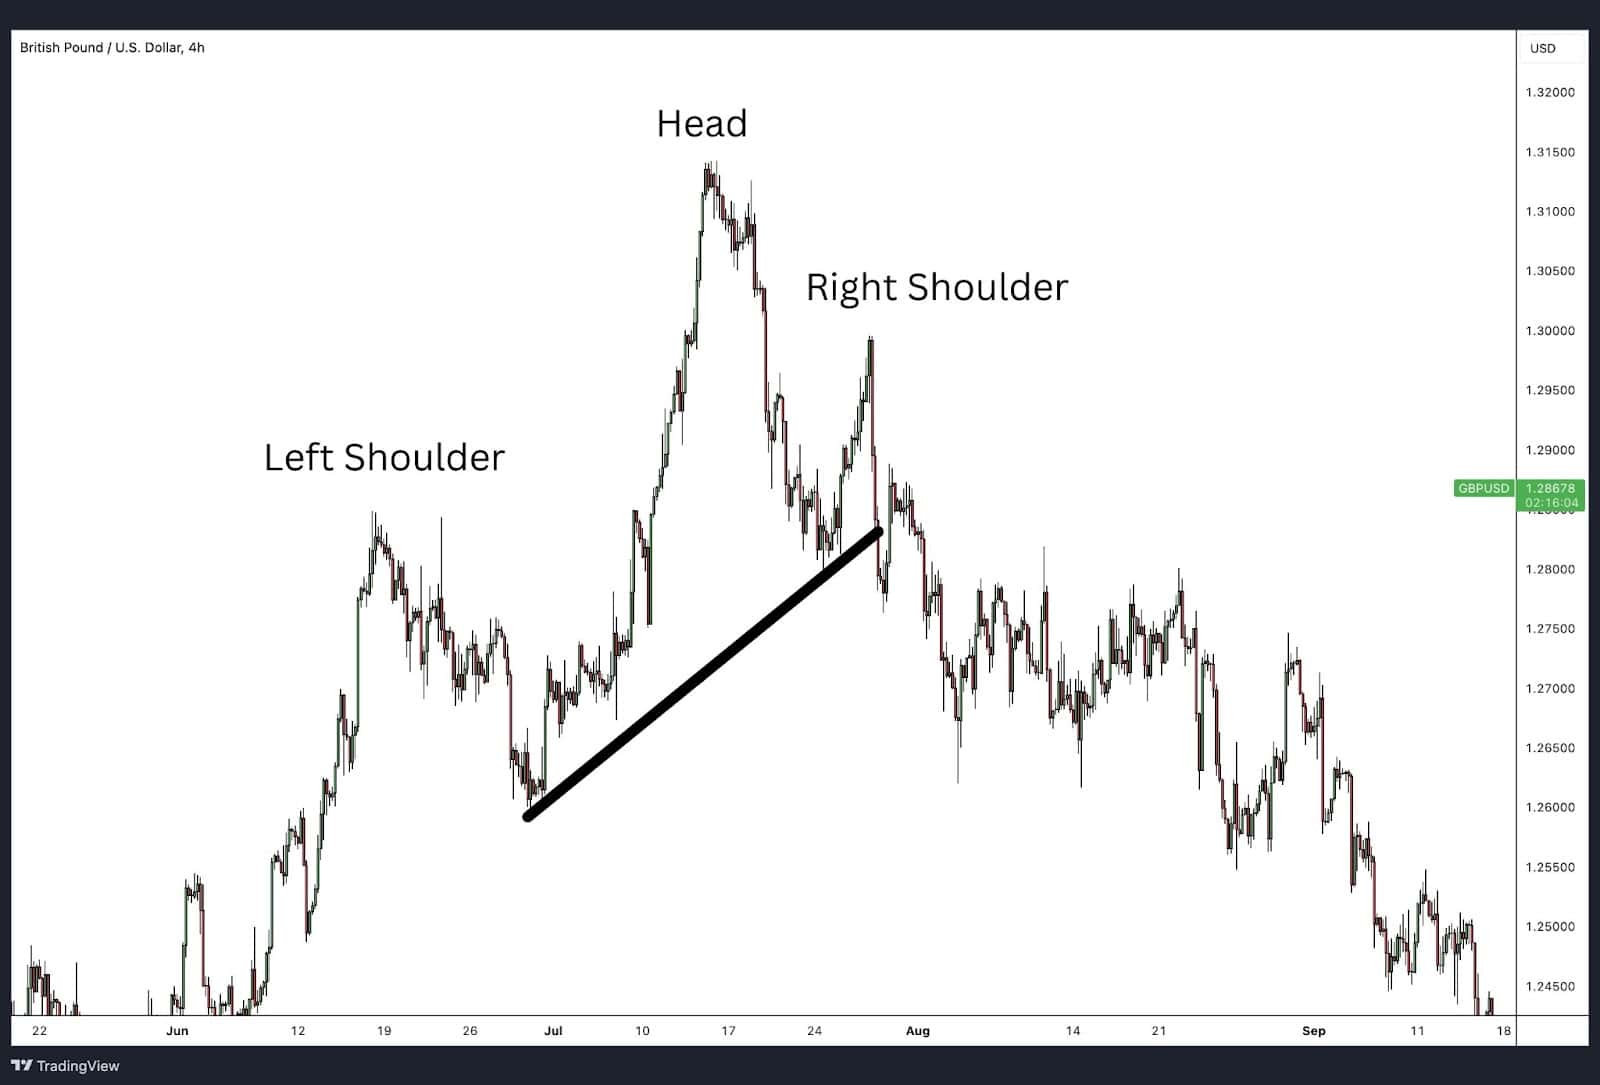
This 4-hour chart of the GBP/USD pair showcases a head and shoulders pattern, developing after a strong upward trend. The pattern’s key characteristics include:
- The price reaches a peak around 1.2850, forming the left shoulder, followed by a pullback.
- The pair then surges to a higher high near 1.3150, creating the peak head.
- A correction brings the price down to the neckline, followed by a rise to approximately 1.3050, forming the right shoulder.
- Eventually, the price breaks below the ascending neckline, signalling a reversal and the onset of a downward trend.
Amazon (AMZN) – 1-Hour Timeframe
Source: TradingView
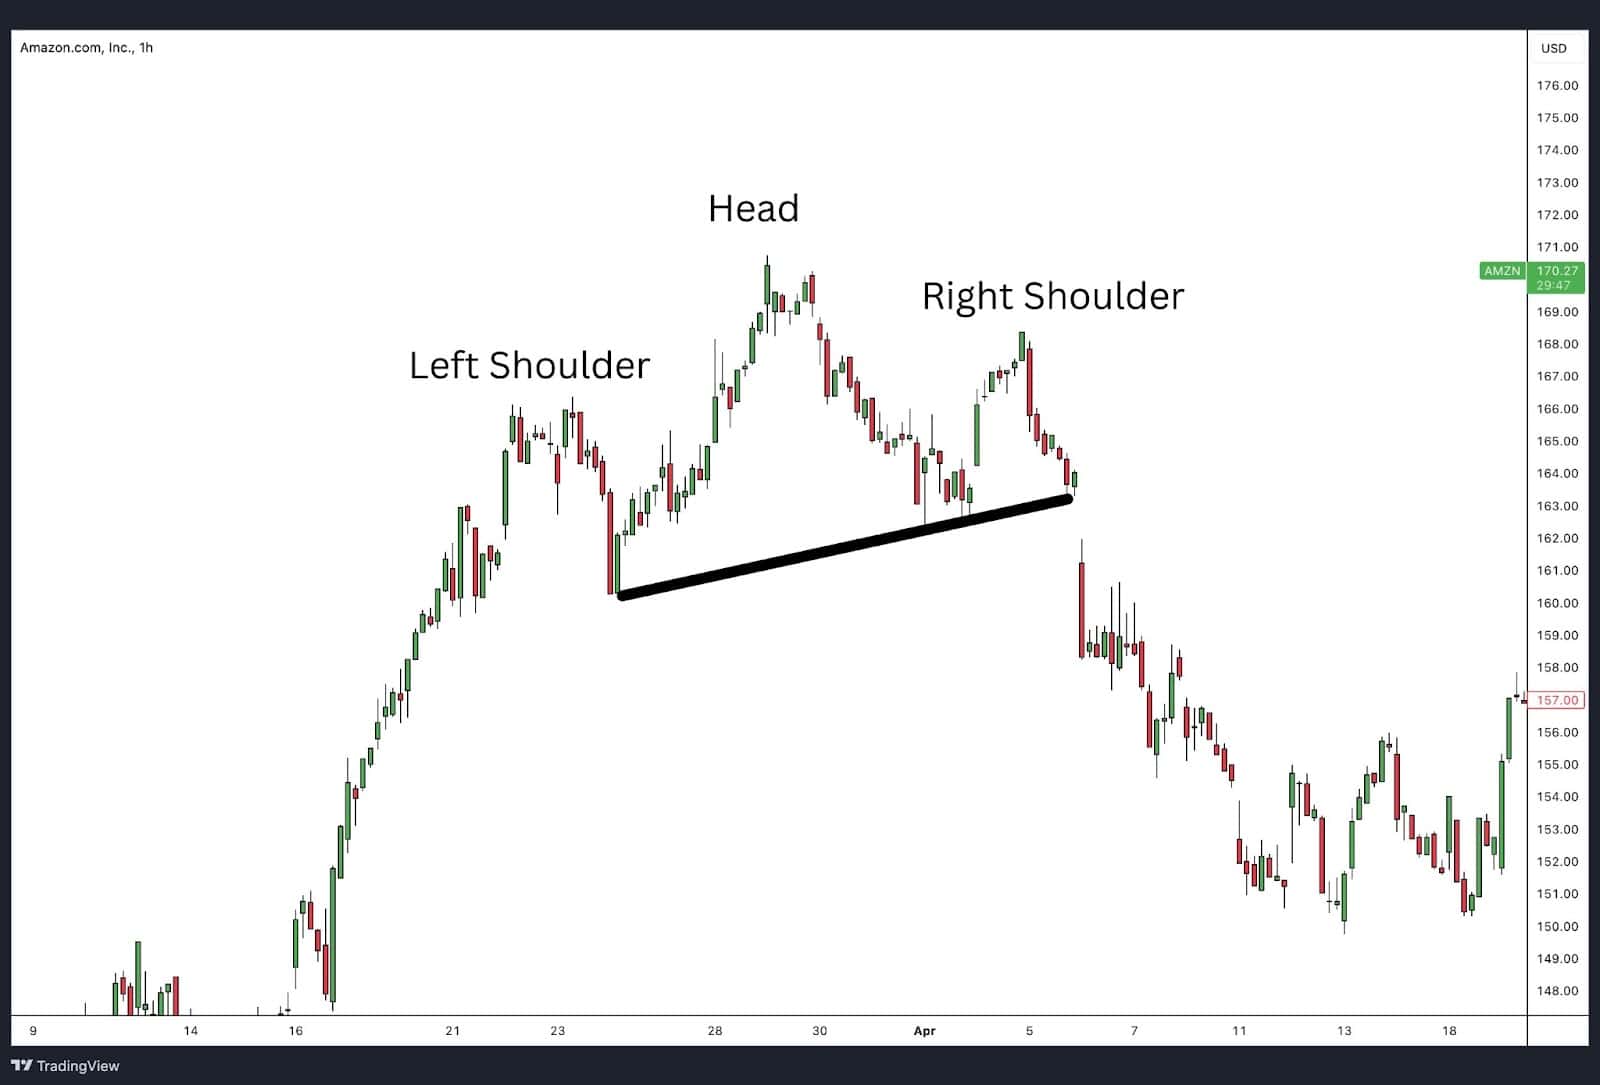
This 1-hour chart of Amazon (AMZN) stock displays a clear head and shoulders pattern, emerging after a strong upward trend. The pattern is characterised by the following elements:
- The price rises to a peak near $165, forming the left shoulder, followed by a pullback.
- The stock then climbs to a higher peak around $172, establishing the head.
- A subsequent correction brings the price down to the neckline, followed by a rise to approximately $167, forming the right shoulder.
- The price then breaks below the ascending neckline, confirming the pattern and indicating a potential shift to a bearish trend.
Head and Shoulders Trading Strategies
The head and shoulders pattern, while being a reliable indicator on its own, can be leveraged further when integrated with various other indicators and price action.
Let’s explore some of these strategies in the following subsections.
Support and Resistance Levels
Support and resistance levels are a foundational pillar of technical analysis with paramount importance. The support and resistance levels within the head and shoulders pattern are no exception. These levels can act as strategic areas for placing orders.
Strategic Use of Support and Resistance Levels:
- Key Areas for Orders: Support and resistance levels are crucial for placing buy or sell orders.
- Enhancing Conviction: The formation of the head and shoulders pattern near an area of longer-term resistance can be a powerful combination. This strengthens the conviction of market participants that a potential trend change may be on the way and that the head and shoulders pattern has a higher probability of completing and providing a trade setup.
Example Analysis:
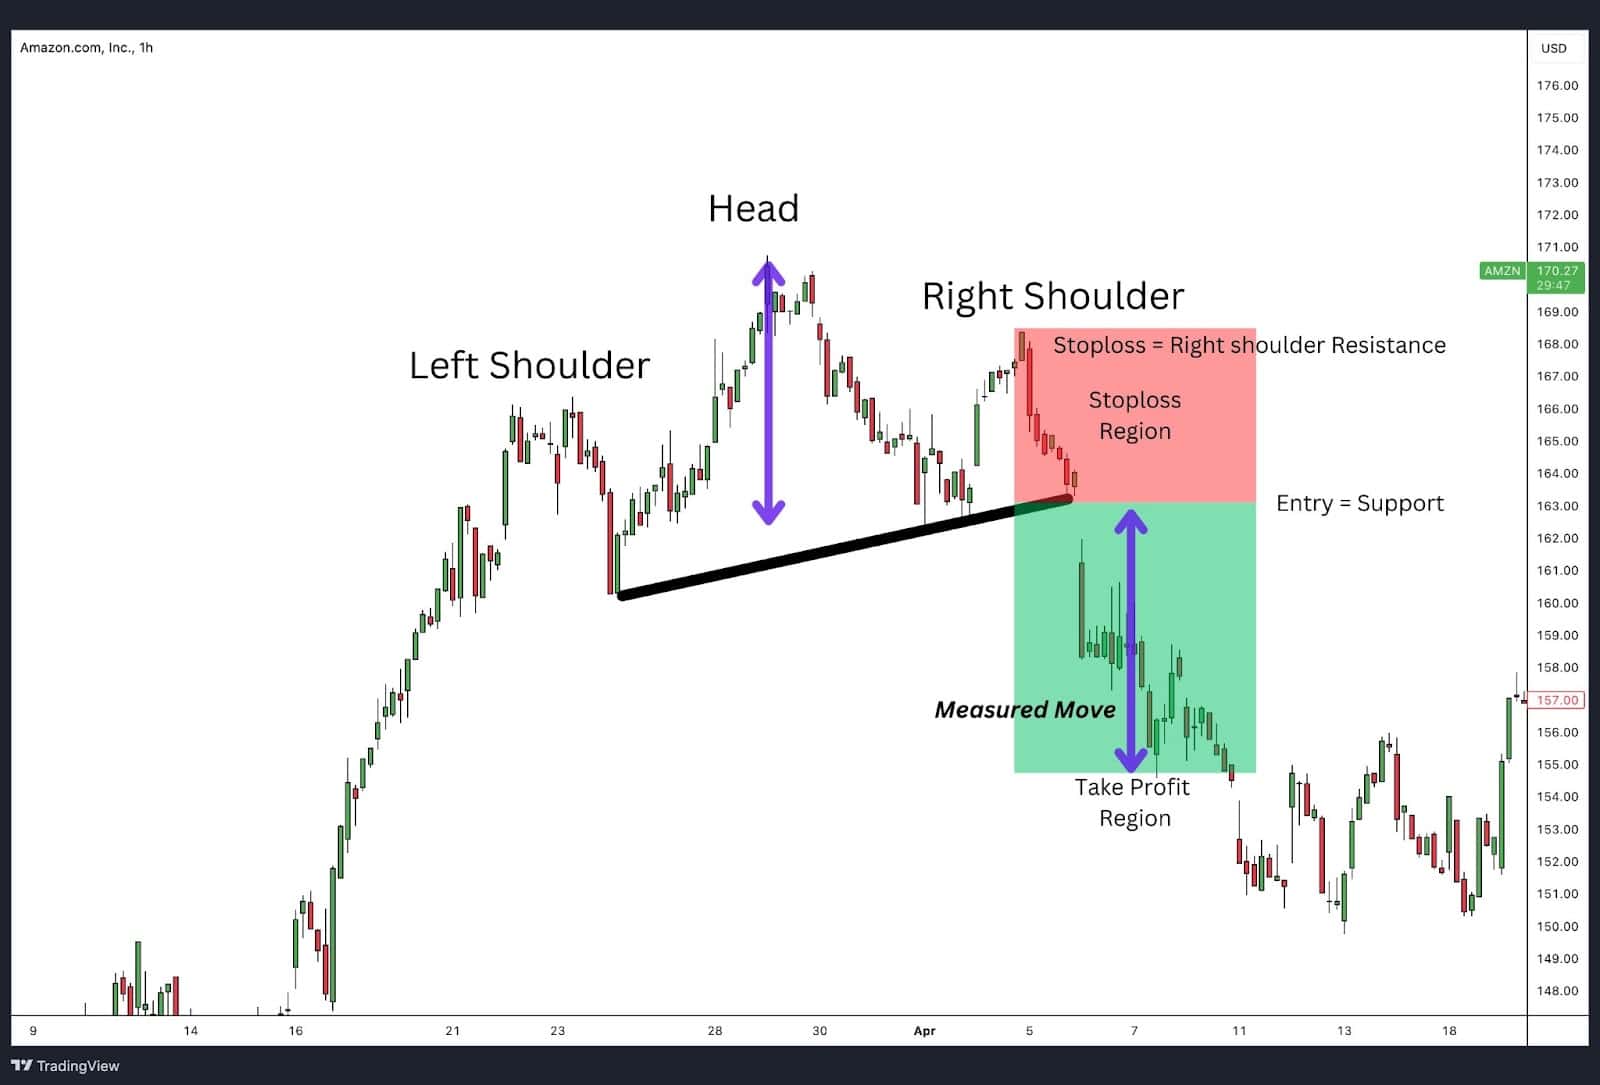
- Pattern Formation and Key Levels: In this example, we analyse a Head and Shoulders pattern on the Amazon (AMZN) 1-hour chart. The pattern forms after a significant upward move, with the peak head topping near $172. The neckline, which connects the lows between the shoulders and the head, is slightly upward-sloping, indicating a critical level to monitor for potential breakdowns.
- Entry Point: An ideal entry occurs once the price breaks and closes below the neckline. This confirms the pattern and suggests a potential bearish reversal.
- Take Profit Level: The take profit level is calculated by measuring the distance from the head’s peak to the neckline. This distance is then projected downward from the neckline break, providing a target area for profit-taking. In this chart, the take profit region is highlighted below the neckline, indicating where traders might aim to close their positions.
- Stop Loss Placement: The stop loss is strategically placed just above the swing high of the right shoulder. This position allows for a buffer in case of a brief upward move while minimising potential losses if the pattern fails to complete as expected.
Summary of Strategy:
When the head and shoulders pattern forms near a significant resistance level, it signals a higher likelihood of a trend reversal. By placing entry orders on the neckline break, setting take profit targets based on the pattern’s height, and positioning stop losses strategically, traders can enhance their trading setups’ effectiveness.
By integrating support and resistance levels with head and shoulders patterns, traders can develop a robust strategy for identifying and capitalising on potential market reversals.
Moving Averages
EURUSD Daily Timeframe
Source: TradingView
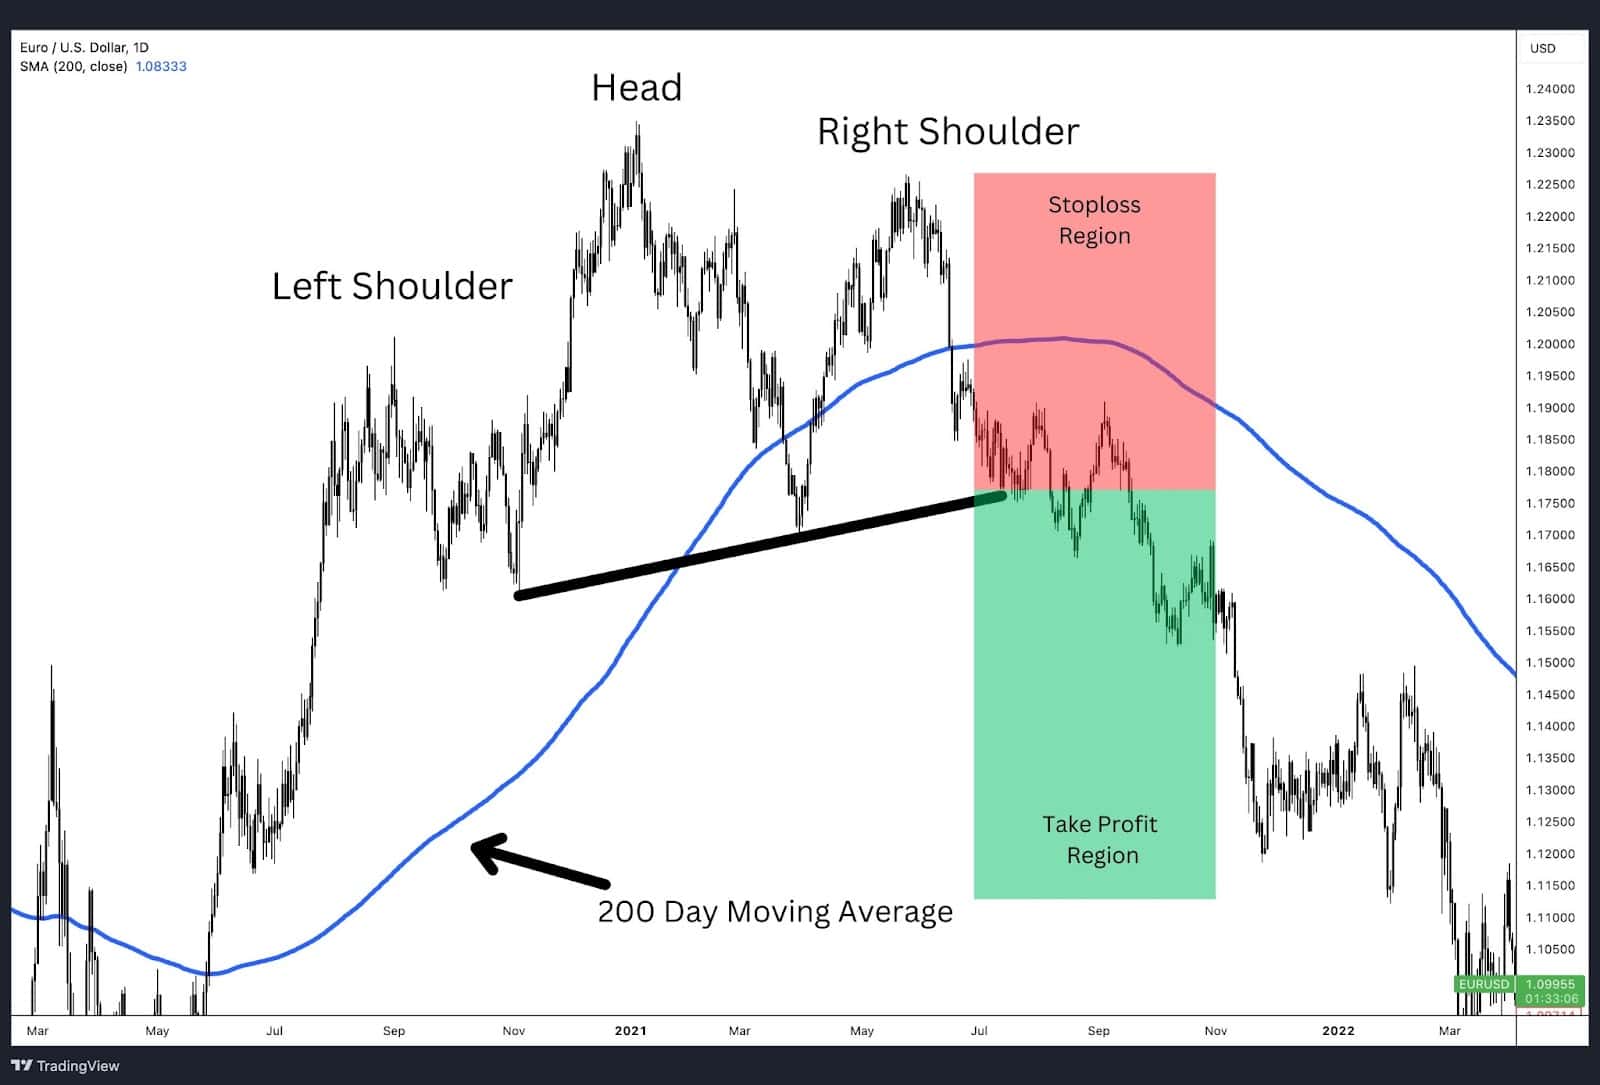
A simple moving average or exponential moving average serve as an excellent tool for confirming the current market trend and provide additional confluence for trading decisions. Traders can apply moving averages to enhance their success when trading the head and shoulders pattern.
Steps to Follow:
- Trend Identification:
- Use of Moving Averages (MAs): The first method involves using one of the 50, 100, or 200-day simple moving averages as a trend identification tool.
- Price Relation to MA: Traders monitor where the price is in relation to the simple moving average. If the price is trading below the moving average, it indicates a downtrend.
- Neckline Break Confirmation: A break of the neckline strengthens the case for the price to continue lower.
- Entry, Stop-Loss, and Take Profit Levels:
- Entry Point: Entry occurs when a candle closes below the neckline.
- Stop-Loss Placement: The stop loss can be placed above the swing high of the right shoulder or above the head, depending on your risk appetite and risk-to-reward ratio.
- Take Profit Level: The take profit level is determined by measuring the distance between the neckline and the head, then replicating that distance from the neckline break. This gives an appropriate target for the take profit level.
Chart Analysis:
The chart below illustrates:
- Entry Point: The specific candle close below the neckline indicates the entry.
- Stop-Loss Level: Placement above the swing high of the right shoulder or the head, showcasing different risk approaches.
- Take Profit Level: The calculated target based on the measured distance between the neckline and the head.
Summary of Moving Average Strategy:
Using moving averages in conjunction with the head and shoulders pattern provides traders with a robust framework for confirming trend direction and making informed trading decisions. By identifying the trend with moving averages and using the head and shoulders pattern for precise entry, stop-loss, and take profit levels, traders can improve their trading effectiveness and manage risk more efficiently.
Stop Losses
Risk management is a critical aspect of trading, and using stop losses is a prudent way to mitigate potential losses. In the context of the head and shoulders pattern, stop losses can be strategically placed above the neckline level, the right shoulder, or above the head, depending on the trader’s risk-to-reward appetite and risk management practices.
The image below shows a GER40 (DAX) daily chart, the stop loss has been placed just above the neckline.
GER40 Daily Chart

Source: TradingView
Trailing Stops
Trailing stops offer an effective way to lock in profits while allowing for potential further gains.
This can be done in various ways. Traders may set a take profit target and close a portion of their position when the price reaches this level before activating a trailing stop. This approach allows the trader to benefit if the position continues in the same direction.
Drawing the Neckline
The neckline, connecting the troughs of the left and right shoulders, plays a vital role in the head and shoulders pattern. Correctly drawing the neckline is essential for identifying a valid pattern and establishing the trade entry point.
Step-by-Step Guide to Drawing the Neckline Correctly:
- Identify the Peaks and Troughs:
- Locate the Peaks: Find the three peaks that form the head and shoulders pattern, with the middle peak (the head) being the highest and the two side peaks (the shoulders top) being lower and roughly equal in height.
- Find the Troughs: Identify the two troughs that occur after the formation of the left shoulder and the head. These are the low points before the price rises to form the head and after it declines from the head before rising again to form the right shoulder.
- Draw the Neckline:
- Connecting the Troughs: Connect these two troughs with a straight line. This line is your neckline. The slope of the neckline can sometimes indicate the market’s future direction.
- Confirmation:
- Break and Close Below: A price break and close below the neckline is used by traders to confirm a head and shoulders pattern. This indicates a potential trend reversal.
Best Neckline Patterns to Trade
The neckline is a critical component of the head and shoulders pattern, as it plays a pivotal role in confirming the reversal of a trend. Understanding the type of neckline is essential for traders, as it can significantly impact the pattern’s reliability and the effectiveness of trading strategies. Below, we explore the different types of necklines—downward-sloping, upward-sloping, and horizontal—and discuss how each affects the validity of the head and shoulders pattern.
Downward Sloping Neckline
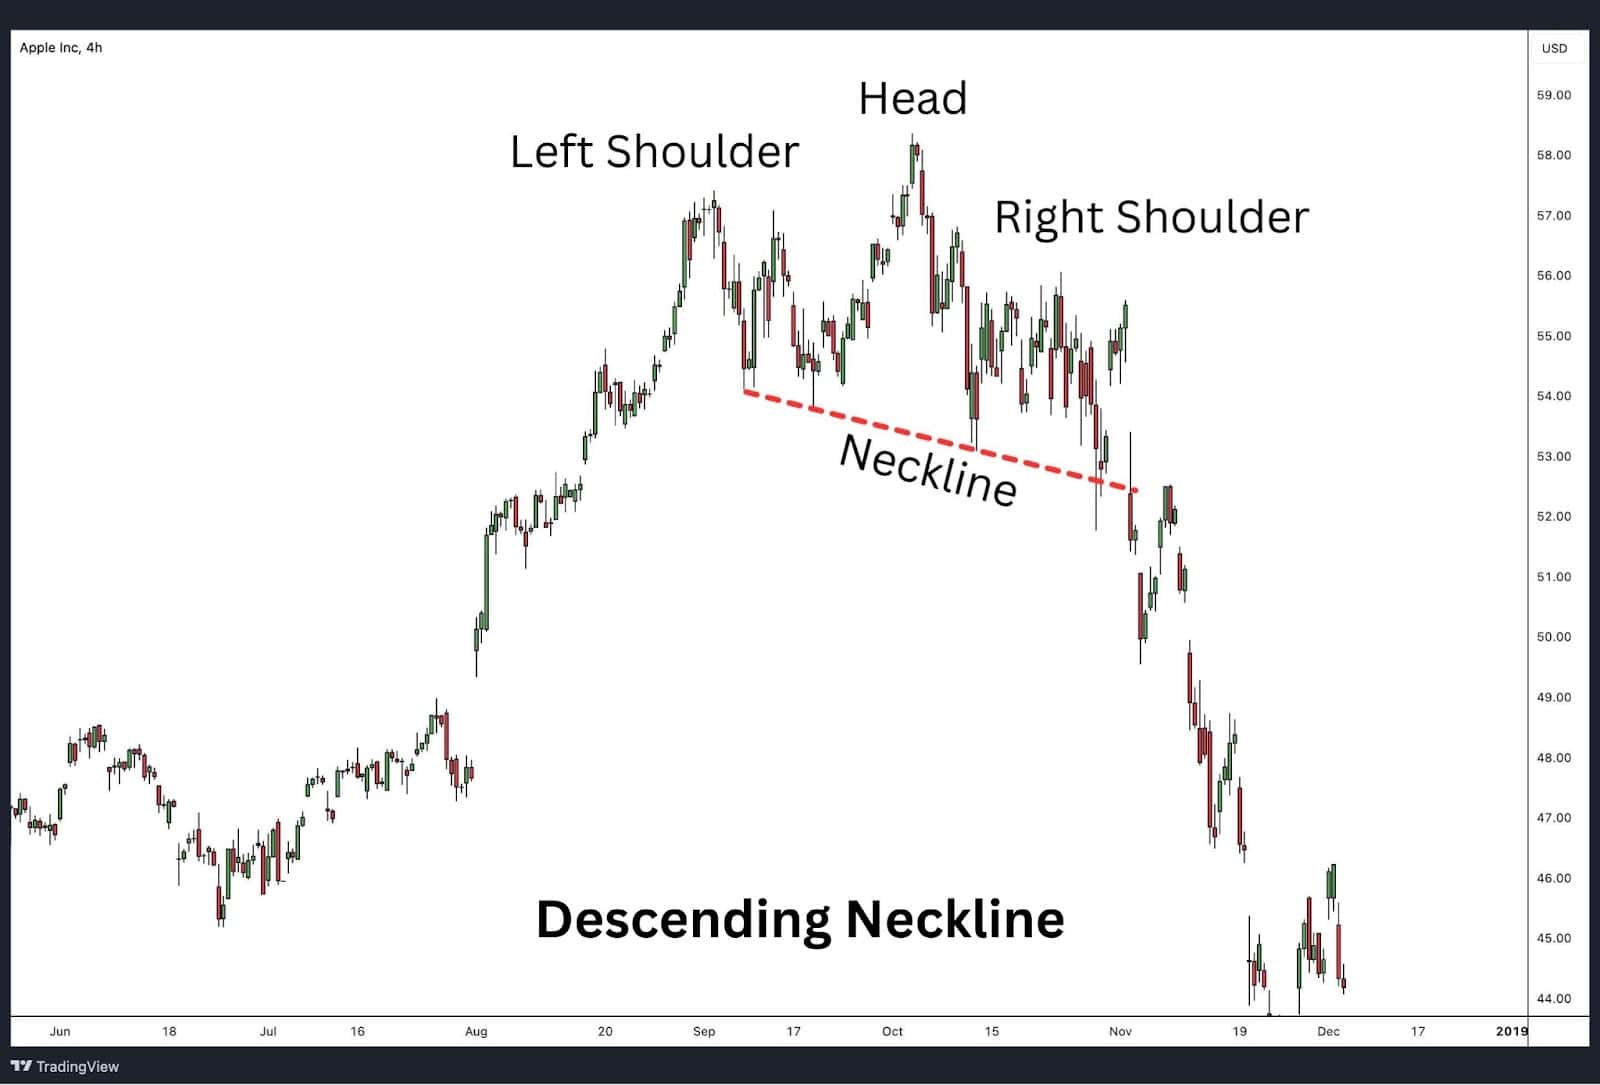
A downward-sloping neckline, as seen in the chart above, often reduces the reliability of the head and shoulders pattern as a reversal signal. This type of neckline may suggest that the downtrend has already begun before the pattern fully develops, leading to a sub-optimal entry and risk management of the reversal. The downward slope would indicate a continuation of the downtrend, making a bearish trade set up with a poor risk to reward ratio.
Upward-Sloping Neckline

An upward-sloping neckline, as illustrated in the chart above, aligns well with the principle of trend reversal. This neckline shows that while prices attempted to rise, they failed to sustain the upward momentum, making the subsequent reversal more reliable. Additionally, this type of neckline offers a better risk-to-reward ratio, allowing traders to set clear boundaries for stop losses, which enhances the significance of the reversal pattern.
Horizontal Neckline
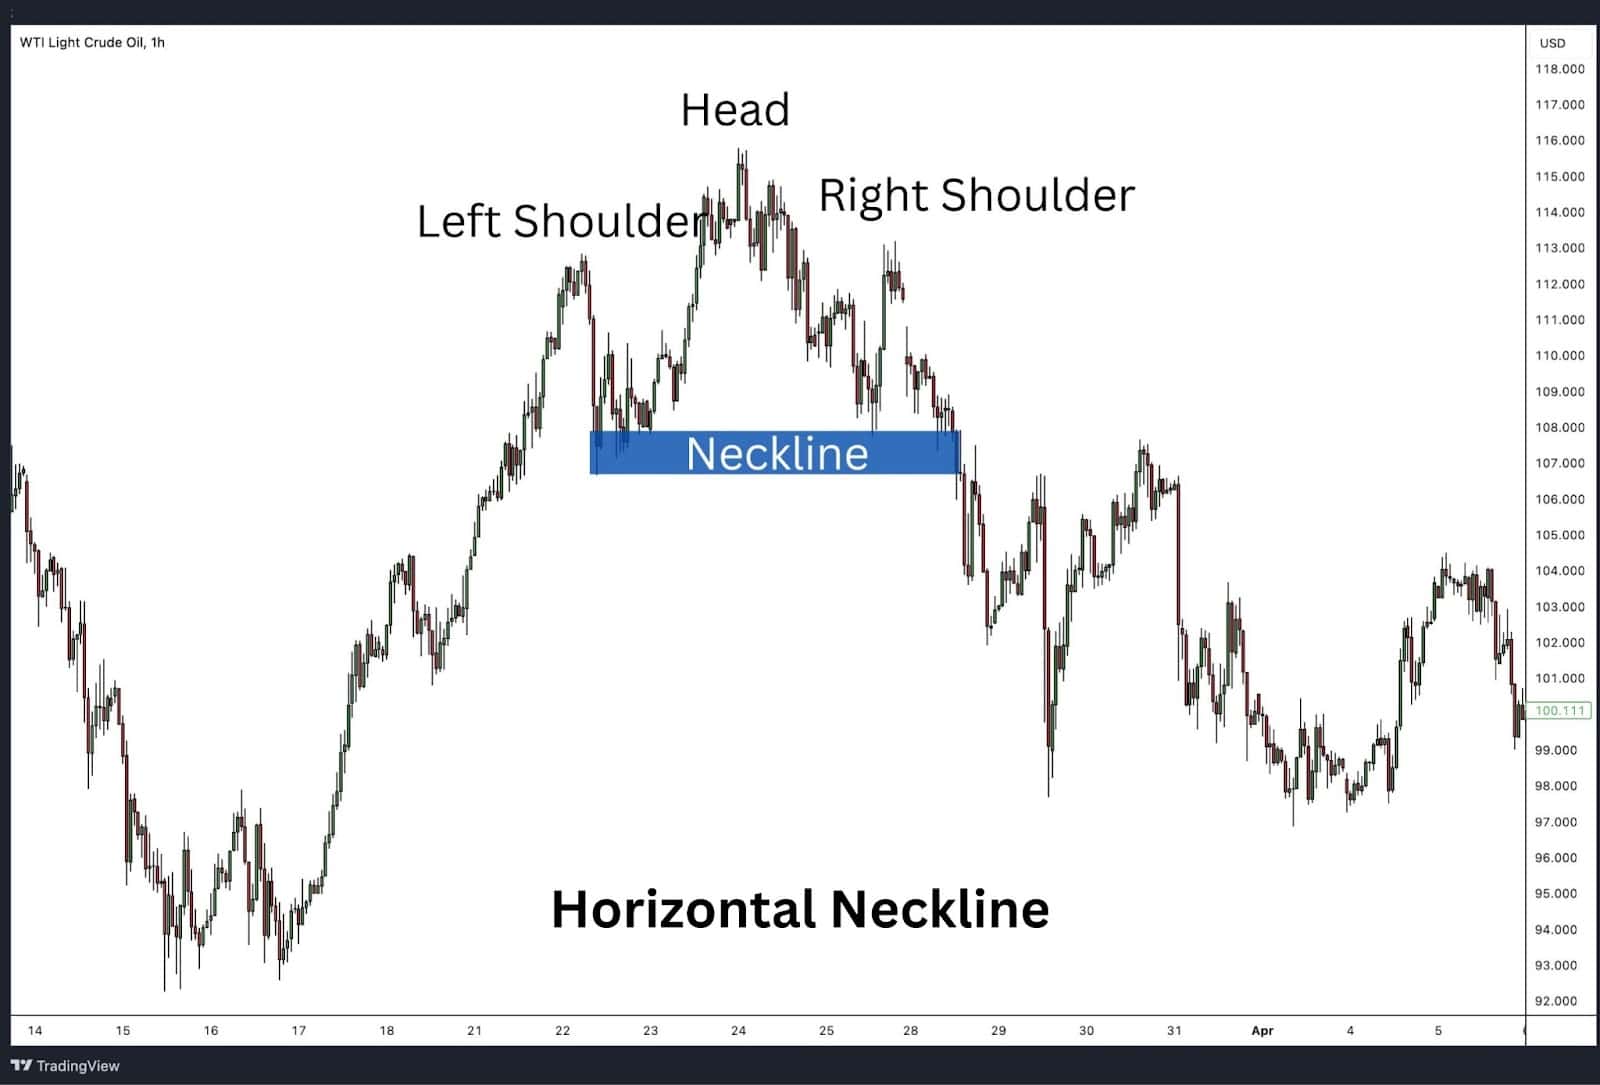
A horizontal neckline, as shown in the chart above, provides one of the most reliable confirmations of a trend reversal. This type of neckline clearly indicates a shift in market sentiment, as it shows that the price is unable to break above or below a consistent level. The clarity provided by a horizontal neckline is crucial for making informed trading decisions, as it signals a precise point where the trend has likely reversed, allowing traders to accurately time their entries and exits.
By understanding the correct placement and slope of the neckline, traders can better utilise the head and shoulders pattern to predict potential market reversals and make strategic trading decisions.
What is the Psychology Behind the Head and Shoulders Pattern?
The head and shoulders pattern is a visual representation of the shifts in market psychology that occur as a bullish trend begins to weaken.
Initially, the formation of the left shoulder reflects strong optimism, with traders confidently driving prices higher. However, as prices reach a peak, savvy traders start taking profits, causing a pullback.
Despite this, many remain bullish, leading to another rally that forms the head. This rally, however, is marked by weakening momentum, with some indicators flashing bearish signals, suggesting that the market’s enthusiasm is fading.
As the pattern progresses, the right shoulder forms, but the rally is even weaker, reflecting a significant shift in sentiment. Traders are now more cautious, with many anticipating that the uptrend is losing steam.
When the price breaks below the neckline, it confirms the pattern and signals the start of a bearish trend. The head and shoulders pattern, therefore, captures the market’s psychological journey from optimism to caution, culminating in a potential reversal.
Summary Psychology of Head and Shoulders:
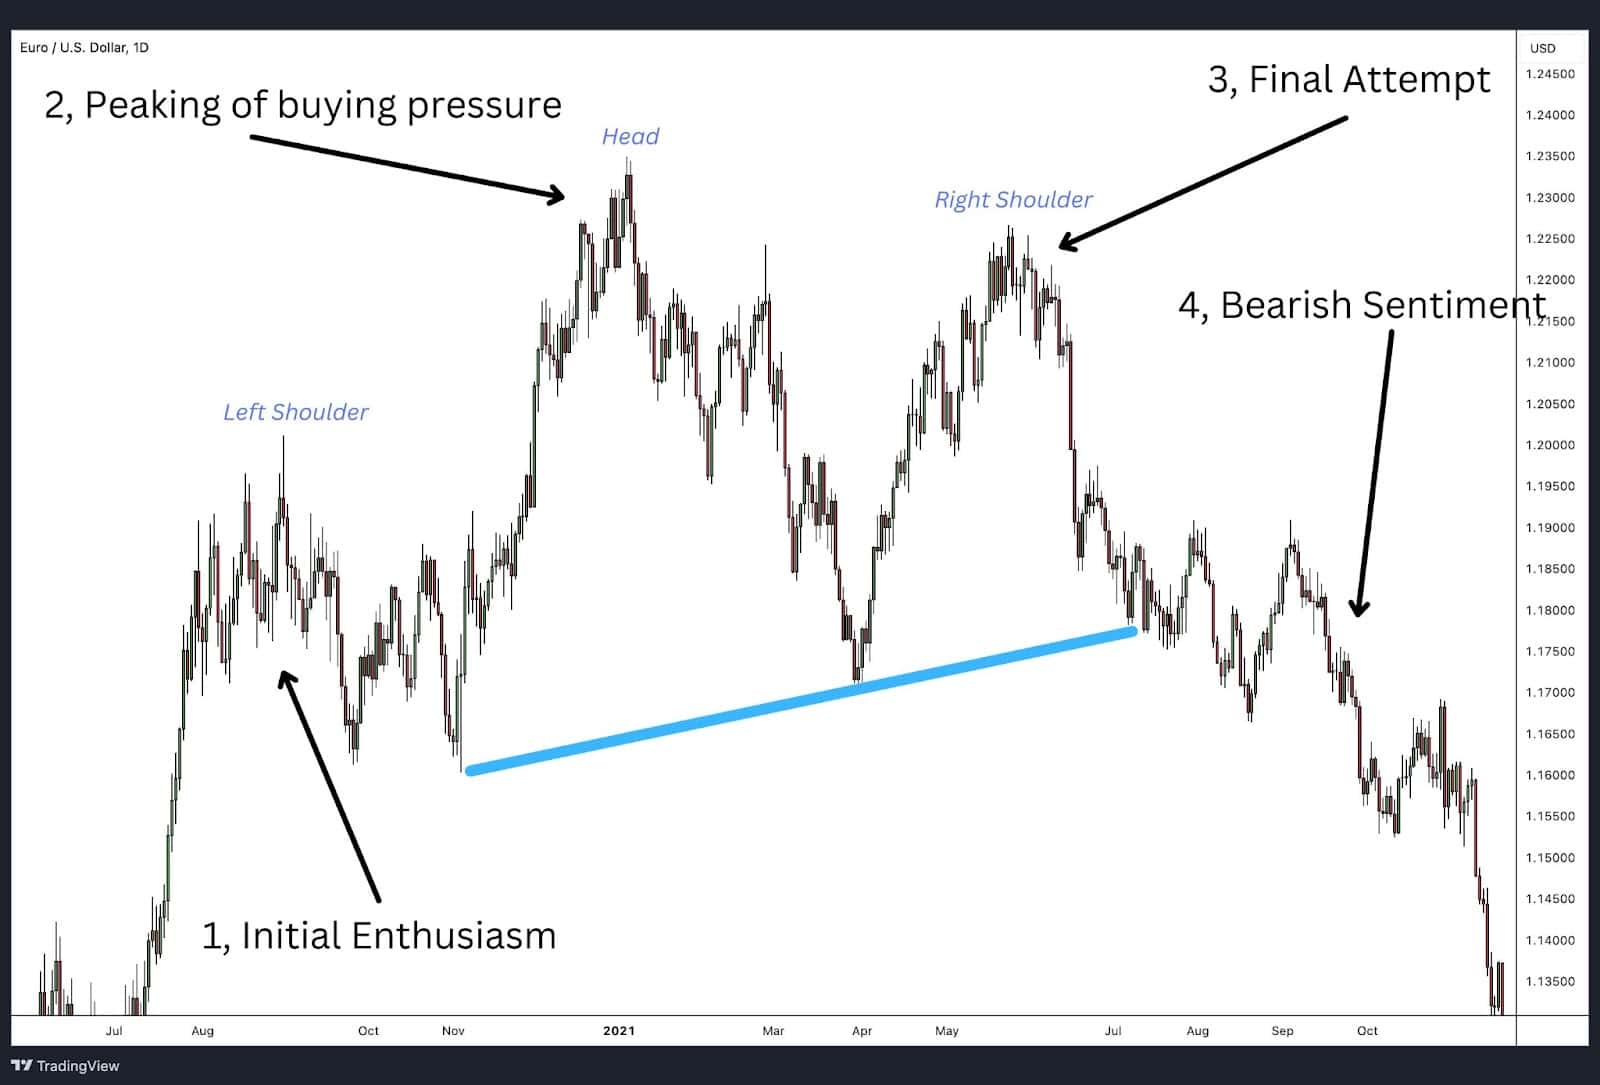
- Initial Enthusiasm: The left shoulder forms as buyers push prices up, showing strong market enthusiasm.
- Peak of Buying Pressure: The head forms during the middle peak as prices surge to a new high, but this new high is not met with the same buying enthusiasm as momentum divergences begin to appear.
- Final Attempt: The right shoulder represents a last effort to push prices higher, but it typically fails to reach the head’s height, showing reduced buying power.
- Shift to Bearish Sentiment: As the pattern completes, sellers begin to dominate, leading to a price drop and confirming the bearish reversal.
Advantages of Trading on the Head and Shoulders Pattern
Trading based on the head and shoulders pattern has several advantages. It is one of the more commonly occurring patterns in day trading, making it a familiar sight to many traders.
Why the Head and Shoulders Pattern Works:
- Simplicity of Identification: The head and shoulders pattern provides a clear and recognizable structure that is simple to identify, even for novice traders.
- Clear Game Plan/Strategy: It offers clear levels for entry, stop-loss, and take profit, making the pattern easy to implement.
- Versatility: The pattern works whether you are trading stocks, forex, or cryptocurrencies. It also appears on any timeframe, but higher timeframes tend to provide the most accurate signals.
- Reliability: The pattern is highly reliable and has a strong track record of indicating trend reversals.
Disadvantages of Trading on the Head and Shoulders Pattern
While the head and shoulders pattern has its advantages, it also comes with its own set of challenges. One of the main difficulties is the possibility of false signals, a common occurrence in any form of technical analysis. Let’s break it down below.
The Pitfalls of Trading Head and Shoulders:
- Lack of Confirmation: Many traders, upon identifying the head and shoulders pattern, may jump the gun and enter before a neckline break, which serves as the confirmation to enter a trade.
- False Signals: As with any indicator or pattern, there is always the possibility of false signals. Sticking to higher timeframes helps to drown out the market noise and tends to be more accurate.
- Risk to Reward: The head and shoulders pattern often involves relatively large stop losses, which can sometimes affect the risk-to-reward ratio.
- Neckline Identification: Traders may misidentify the neckline, which is crucial for entry confirmation. This can lead to premature entries before actual confirmation occurs.
As with all trading patterns and indicators, the head and shoulders pattern is not without its pitfalls. Understanding both the advantages and the potential drawbacks would allow you to utilize the benefits while mitigating any drawbacks the pattern allows in trading strategies.
Common Head and Shoulders Pattern Mistakes to Watch out
When trading the head and shoulders pattern, it’s essential to be mindful of common mistakes.
Confirmation of Neckline Break:
- Premature Entry: One common mistake is not waiting for confirmation. Entering a trade prematurely based on this pattern can lead to potential losses. Ensure the price breaks and closes below the neckline before entering the trade.
Lack of Risk Management:
- Essential Strategy: Implementing proper risk management is essential when trading the head and shoulders pattern to ensure long-term success. To effectively manage risk, start by placing a stop loss just above the high of the right shoulder. This placement helps protect your position in case the pattern fails and the price resumes an upward trend. For your profit target, measure the distance from the head to the neckline and project that distance downward from the neckline break. This method provides a clear, objective target for exiting the trade, ensuring you capitalise on the potential reversal while minimising losses.
Misreading Market Conditions:
- Overall Market Dynamics: Understanding the overall market dynamics is important. For example, if you are trading a US dollar pair and the fundamentals point to long-term US dollar appreciation, it might not be wise to take a position against the US dollar.
Not Determining the Take Profit Level Ahead of Entry:
- Profit Target Formula: There is a simple formula to determine the take profit level or price target. Measure the distance between the neckline and the top of the head. Use this distance from the neckline break to determine the profit target or take profit level.
By avoiding these common mistakes, traders can increase their chances of successfully trading the pattern and improve their overall trading strategy.
What Indicator is Best to Trade with a Head and Shoulders Pattern?
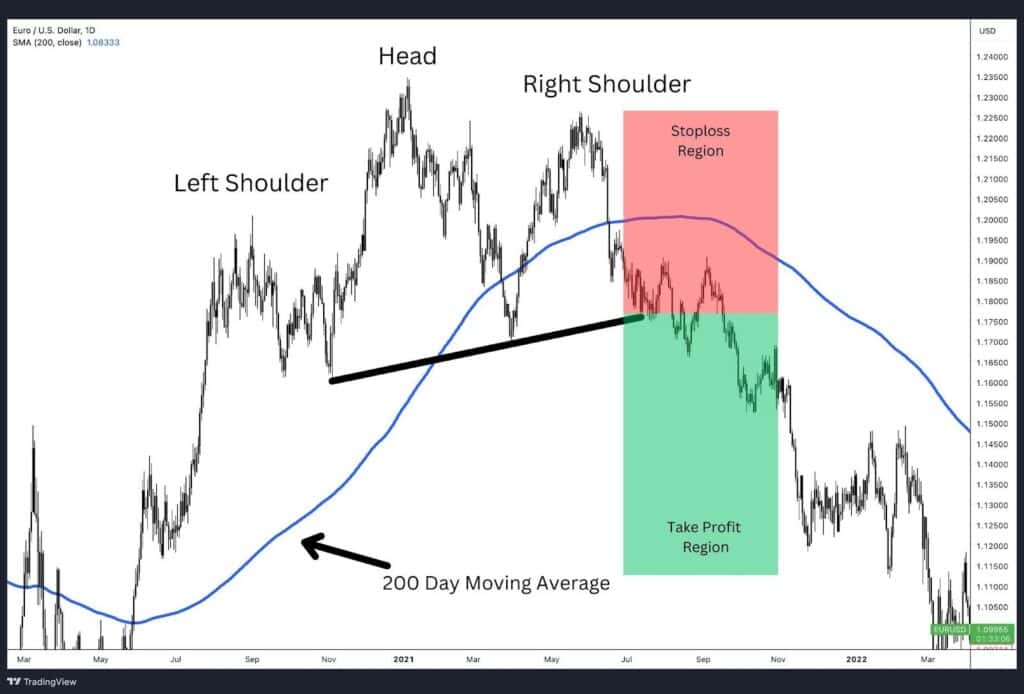
The best indicator to trade with a head and shoulders pattern largely depends on individual trading preferences and strategies. However, one commonly used indicator is moving averages like the simple moving average (SMA) or exponential moving average (EMA).
Using Moving Averages:
- Overlaying MA on the Chart: Traders often overlay a moving average on the chart in question. The most commonly used are the 50, 100, or 200-day simple moving averages.
- Monitoring the Pattern Completion: As the head and shoulders pattern completes, traders monitor if the pattern converges with a break below the moving average.
- Extra Confirmation: If the head and shoulders pattern breaks below the moving average, it serves as an extra confirmation of a shift in sentiment.
Head and Shoulders Pattern vs Quasimodo Pattern
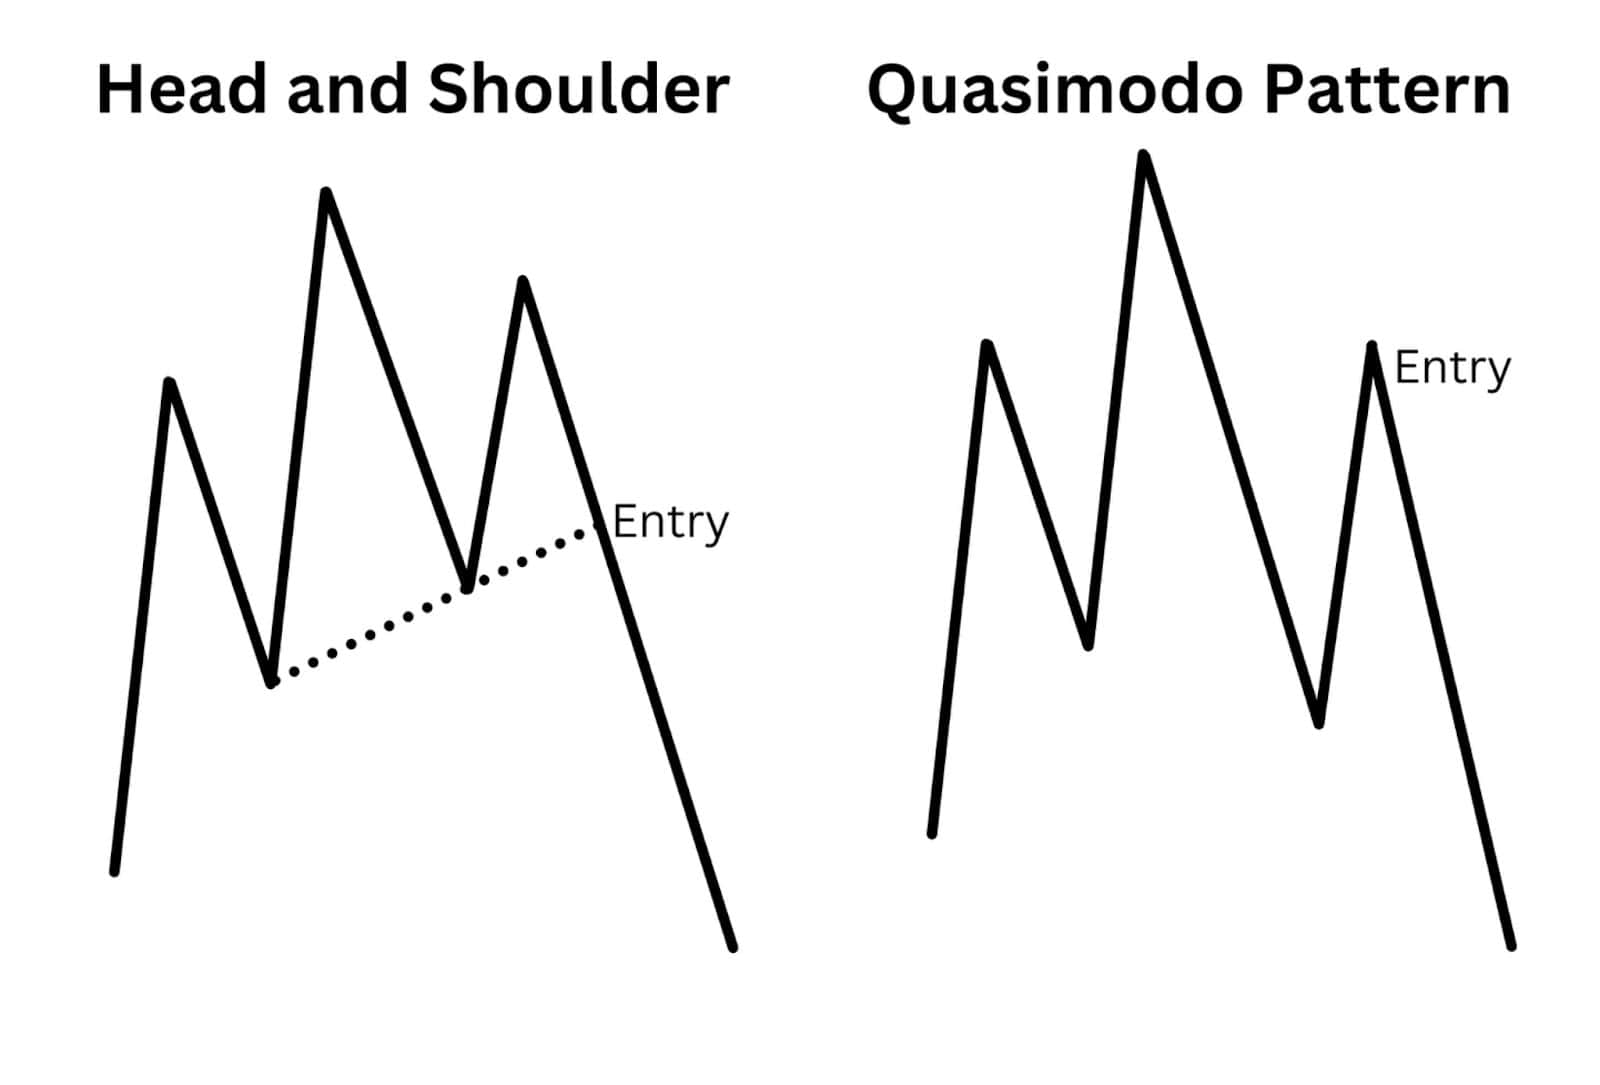
The Head and Shoulders (H&S) pattern and the Quasimodo pattern share some similarities as reversal setups, but their differences primarily revolve around the neckline and the nature of their price action. Here’s how they differ:
1. The Role of the Neckline
- Head and Shoulders (H&S) Pattern:
- The neckline in an H&S pattern must remain parallel or slightly sloped above the left neckline. The price does not break down into a new low until the neckline itself is first broken.
- The neckline’s integrity is vital because the trade entry occurs only after its break, allowing traders to trade the reversal with a defined risk-reward (R:R) ratio.
- Quasimodo Pattern:
- In a Quasimodo pattern, the neckline must be broken and the price must close below the left neckline (in bearish setups). This break forms a new low, confirming the start of a new down trend.
- The break of the neckline signals a continuation of the newly forming trend, and the Quasimodo is traded based on a pullback rather than the neckline break itself.
2. Trend Dynamics
- H&S Pattern:
- The H&S pattern is a pure reversal pattern. The focus is on the shift in trend direction, with no new low formed before the neckline break. This ensures traders enter with better R:R, as they are trading the reversal move itself.
- Quasimodo Pattern:
- Although the Quasimodo appears after a reversal, it is technically a continuation pattern. The price action breaks into a new low and the pattern is traded on the pullback to the left shoulder level or a key Fibonacci retracement (often 78.6% of the new impulse).
- The true test for the new trend occurs as the price holds this pullback and resumes in the new trend direction.
3. Entry Levels
- H&S Pattern:
- Entries are made after the neckline break, often with a retest of the neckline for additional confirmation. This makes it a slightly delayed entry but ensures the trend reversal is established.
- Quasimodo Pattern:
- Entries are based on the left shoulder level or the 78.6% Fibonacci retracement of the new impulsive move to the downside. Traders position themselves earlier, aiming to catch the continuation of the trend rather than waiting for a confirmation of reversal.
Conclusion
While the H&S and Quasimodo patterns are structurally related and often referred to as “cousins,” their roles and execution differ.
- The H&S is a pure reversal pattern, where the focus is on trading the break of the neckline for a better R:R setup.
- The Quasimodo is a continuation pattern after the initial reversal has already occurred, offering an earlier entry based on pullbacks and requiring confirmation of the new trend’s strength.
Does Head and Shoulders Have to be Symmetrical?
The head and shoulders pattern, while relatively easy to recognise, does not require perfect symmetry between the shoulders. This lack of symmetry is one of the more challenging aspects of identifying the pattern, but it doesn’t necessarily diminish its effectiveness.
The left and right shoulders do not need to be identical in height or width; slight variations are common and can still result in a valid pattern. To illustrate, think of it like a sandwich—the two slices of bread (representing the shoulders) are rarely the exact same size or shape, yet they still function together to create a sandwich. Similarly, the pattern can remain effective even if the shoulders aren’t perfectly matched.
The degree of asymmetry is important to consider. If the shoulders are significantly out of balance—where one shoulder is much higher or broader than the other—it could indicate a weaker pattern. Extreme asymmetry might suggest that the market lacks clear consensus or that the pattern is less reliable as a reversal signal.
In such cases, traders should be cautious and consider additional factors, such as volume, trend strength, and other technical indicators, before making trading decisions. The overall structure should maintain a recognisable form; otherwise, the pattern might be misinterpreted, leading to less predictable outcomes.
Frequently Asked Questions
Is head and shoulders pattern bullish or bearish?
The head and shoulders pattern is a bearish reversal pattern consisting of three unequal peaks with the middle peak reversing at the highest price in the pattern. The shoulders formation would carve highs lower than the middle peak.
Can head and shoulders turn bullish?
No, a regular head and shoulders pattern is a bearish pattern and does not suggest a bullish reversal. It typically signals a shift from an uptrend to a downtrend.
How reliable is the head and shoulders pattern?
The head and shoulders pattern is widely regarded as one of the most dependable patterns in technical analysis due to its ease in spotting and clarity for trade ideas. However, like all trading strategies, it is not foolproof and requires proper confirmation and risk management for successful application. Incorporating other indicators and price action analysis can help improve the pattern’s reliability.
What invalidates a head and shoulders pattern?
A head and shoulders pattern can be invalidated if the price fails to break below the neckline. Additionally, if the structure of the pattern is not clearly identifiable as a head flanked by two shoulders, the pattern can be deemed invalid.
How does the head and shoulders pattern fail?
A head and shoulders pattern may fail if traders do not:
- Wait for Proper Confirmation: Entering a trade prematurely, such as before the right shoulder completes or before a confirmed break of the neckline, can lead to failure.
- Identify the Neckline Correctly: Incorrectly identifying the neckline can result in a false reading of the pattern and potential losses.
Implement Proper Risk Management: Failure to place appropriate stop losses and manage risk can undermine the effectiveness of the pattern.


