- Opening Bell
- November 4, 2024
- 4min read
2024 US Election Day Tomorrow: What to Expect
With just one day to go in the US presidential race, the world is on the edge of its seat to see who ultimately becomes the next president of the United States – the current Vice President, Kamala Harris? Or the former president, Donald Trump?
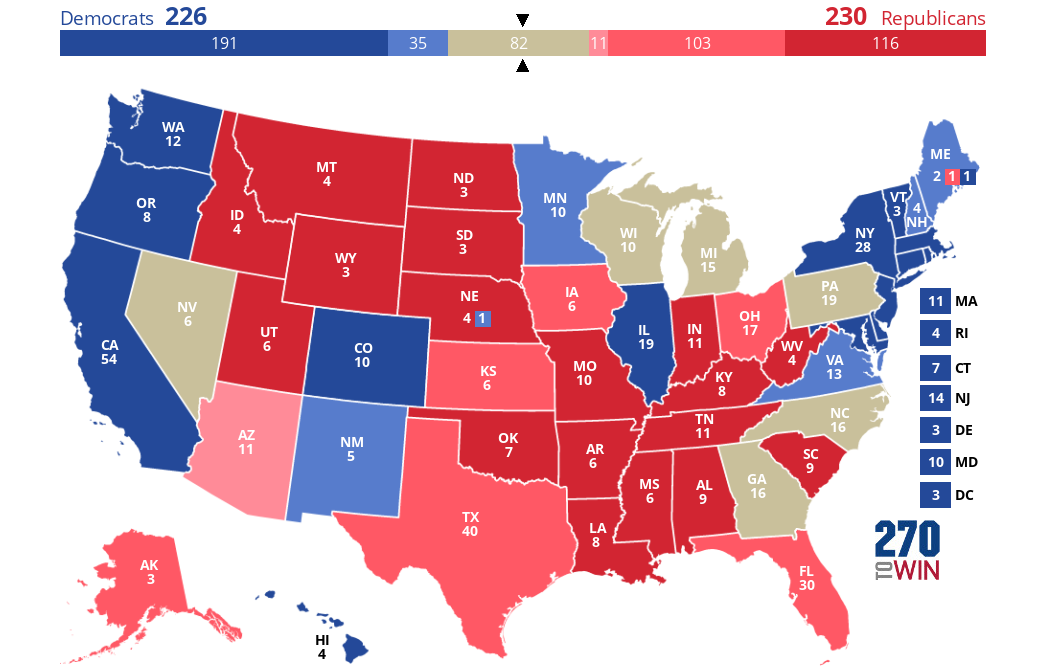
To be clear, the final results will not be announced tomorrow. However, the initial results will begin to emerge as polls close on election night – while undecided swing states will serve as key battlegrounds for the Harris and Trump campaign in coming days and weeks.

Ultimately, investors are looking at the initial results to get a taste of who is likely to win; and allocate their funds accordingly to the winning electee’s supported sectors, and economic policies.
2-Day Historical Volatility on S&P 500 and DXY

Taking a look at the historical price action over the past four elections, we see that, within a 2-day period from Election Day, market volatility tends to spike, particularly on the S&P 500.
Notably, the 2008 and 2016 elections showcased some of the most unexpected market reactions, highlighting how the S&P 500 and DXY can exhibit short-term correlation during these periods of heightened volatility:
- 2008 Election: Despite Obama’s expected win, the market reacted with a strong bearish movement, with the S&P 500 dropping by 8.92% and the DXY by 4.83%, as the global financial crisis amplified uncertainty beyond what betting odds had anticipated.
- 2016 Election: Trump’s unexpected victory led to an initial market sell-off, but quickly turned bullish as the S&P 500 rose 3.21% and the DXY climbed 3.39% over two days, highlighting how betting odds can misjudge market reactions to surprise outcomes.
Betting Odds: What the Populus Expects
As of November 4, 2024, the U.S. presidential race between Vice President Kamala Harris and former President Donald Trump remains highly competitive, with betting odds reflecting a closely contested election.
According to BetOnline, Trump is favoured with odds of -175, implying a 63.6% chance of victory, while Harris holds odds of +150, indicating a 40% chance. Similarly, Betfair and Polymarket show Trump leading with a 52% probability compared to Harris’s 44%.
These figures suggest that, on average, Trump leads Harris by approximately 10% in current betting markets, making a Harris win the unexpected result and potentially resulting in a more volatile market.
Stance Check: Kamala Harris’s Economic Manifesto
Kamala Harris’s economic plan focuses on supporting lower- and middle-income households through expanded tax credits, increased corporate taxes, and targeted price regulation. Her manifesto includes caps on healthcare costs, particularly for essential medicines, and incentives for affordable housing development.
| Sector | Stance |
|---|---|
| Bullish | Healthcare, affordable housing developers, renewable energy (solar and wind), consumer staples focused on lower-income markets |
| Bearish | High-margin consumer discretionary, large-cap tech (tax-sensitive), real estate firms not involved in affordable housing |
Stance Check: Donald Trump’s Economic Manifesto
Donald Trump’s economic manifesto emphasises tax reductions, regulatory rollbacks, and strong support for traditional energy sectors. His speculated “Project 2025” initiative aims to further stimulate growth through corporate tax cuts, promoting U.S. fossil fuel production and reducing renewable energy mandates.
| Sector | Stance |
|---|---|
| Bullish | Oil, gas, and coal sectors, financial services (benefiting from deregulation), U.S.-based industrial manufacturing, high-end consumer discretionary (boosted by tax cuts) |
| Bearish | Renewable energy (potential subsidy cuts), tech (potential trade restrictions), healthcare (if ACA expansions are repealed) |
Closing Thoughts
No matter who leads in the presidential race tomorrow, traders must keep their eyes peeled for the following:
- An unexpected Harris initial win.
- A decoupling of the usual inverse correlation between the S&P 500 and DXY.
- Potential sharp declines or rises in relevant markets related to the winner.
You may also be interested in:


