


Written by:


- Chart of the Day
- October 14, 2024
- 3 min read
Uber Surges to New ATH Areas to Watch for Bullish Investors
On Friday, October 11th, Uber’s stock gapped to new all-time-highs at $87.00 dollars per share. This dramatic rise was likely due to a disappointing reveal of Tesla’s autonomous ridesharing service, the Cybercab, on Thursday.

As fears of a new normal for e-hailing gets dispelled, the Uber stock rose by over 11% in a single day, while Tesla’s stock dropped by 9%. Investors have reinvigorated trust in Uber’s “Traditional” ridesharing service, and this momentum could push the Uber stock prices even higher.
Technical factors on the Uber price chart point to more upside, with a major support zone being the daily price gap between $78.30 to $82.00 dollars, and a potential topping target at the $100.00 dollar mark.
UBER Daily Chart: Key Levels to Watch
After a fakeout scare in August 2024, the Uber stock price has steadily regained key price levels and even formed an Inverse Head and Shoulders, a bullish reversal pattern.
The price has already broken out of the pattern, which puts the HNS breakout target at approximately $91.70. Traders or investors may take profit here, so expect some resistance to kick in.
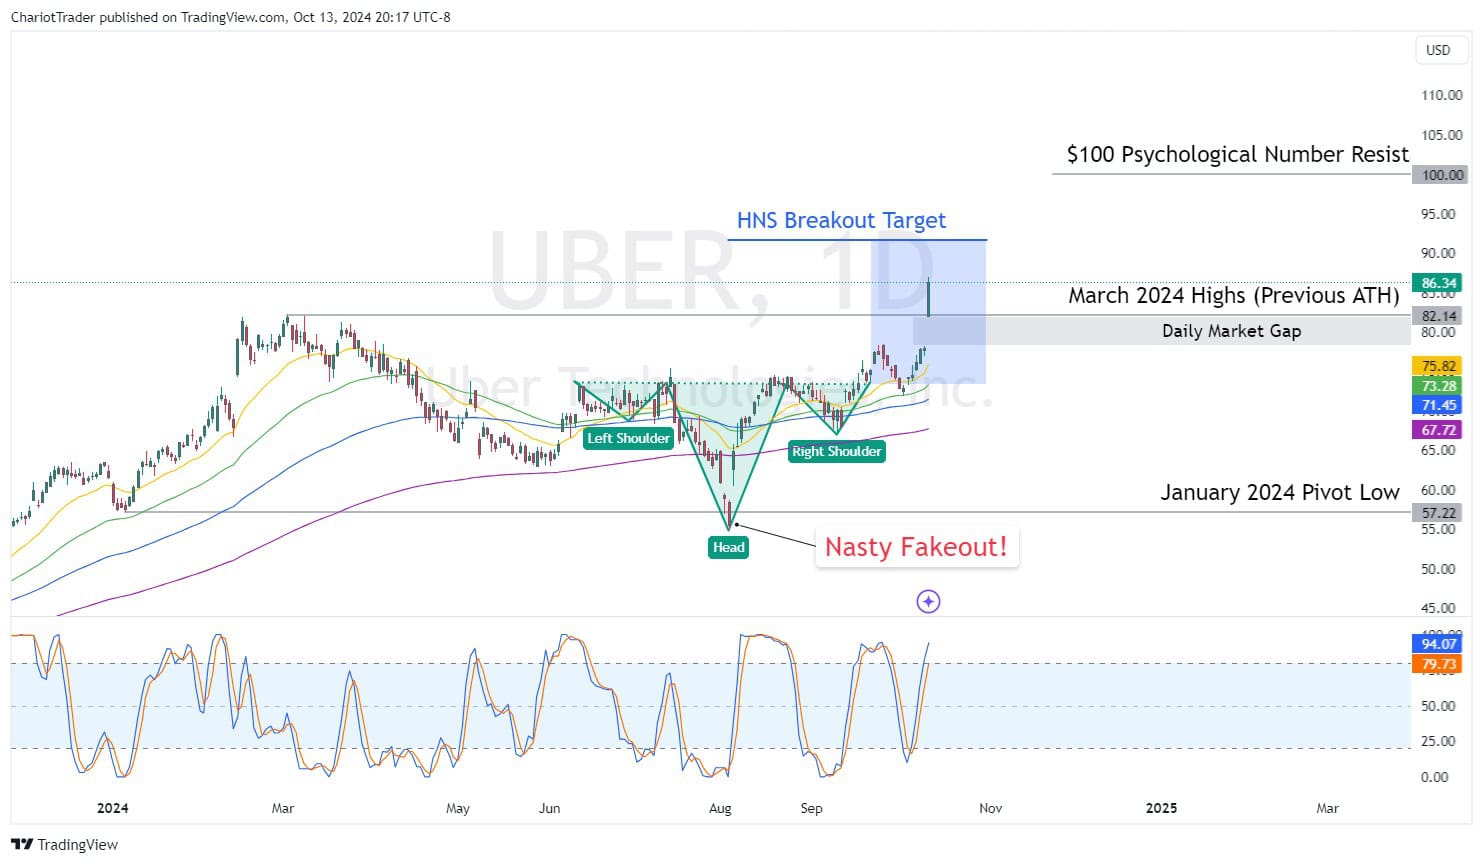
Below the current price is the Previous ATH (All-Time Highs) at $82.14, which is also positioned closely to a daily price gap from $78.30 to $82.00 dollars. These areas would be key support areas to watch for a potential continuation of Uber’s bullish price action.
The current daily Stochastic RSI hints that the rise may not yet be finished, so traders looking for a long position should remain patient before hastily jumping in.
UBER Fibonacci Extension and Other Confluences
Draw a Fibonacci Extension from Uber’s previous major leg up – from $54.84 to $74.48, and you’ll notice that Uber stock is currently positioned to reach at least $90.00 dollars.
The stock is currently finding resistance at the 1 Fib Extension Level ($87.10), but if the price moves higher, the next major extension of 1.238 at $91.87 would align with the inverse head and shoulders’ breakout target.
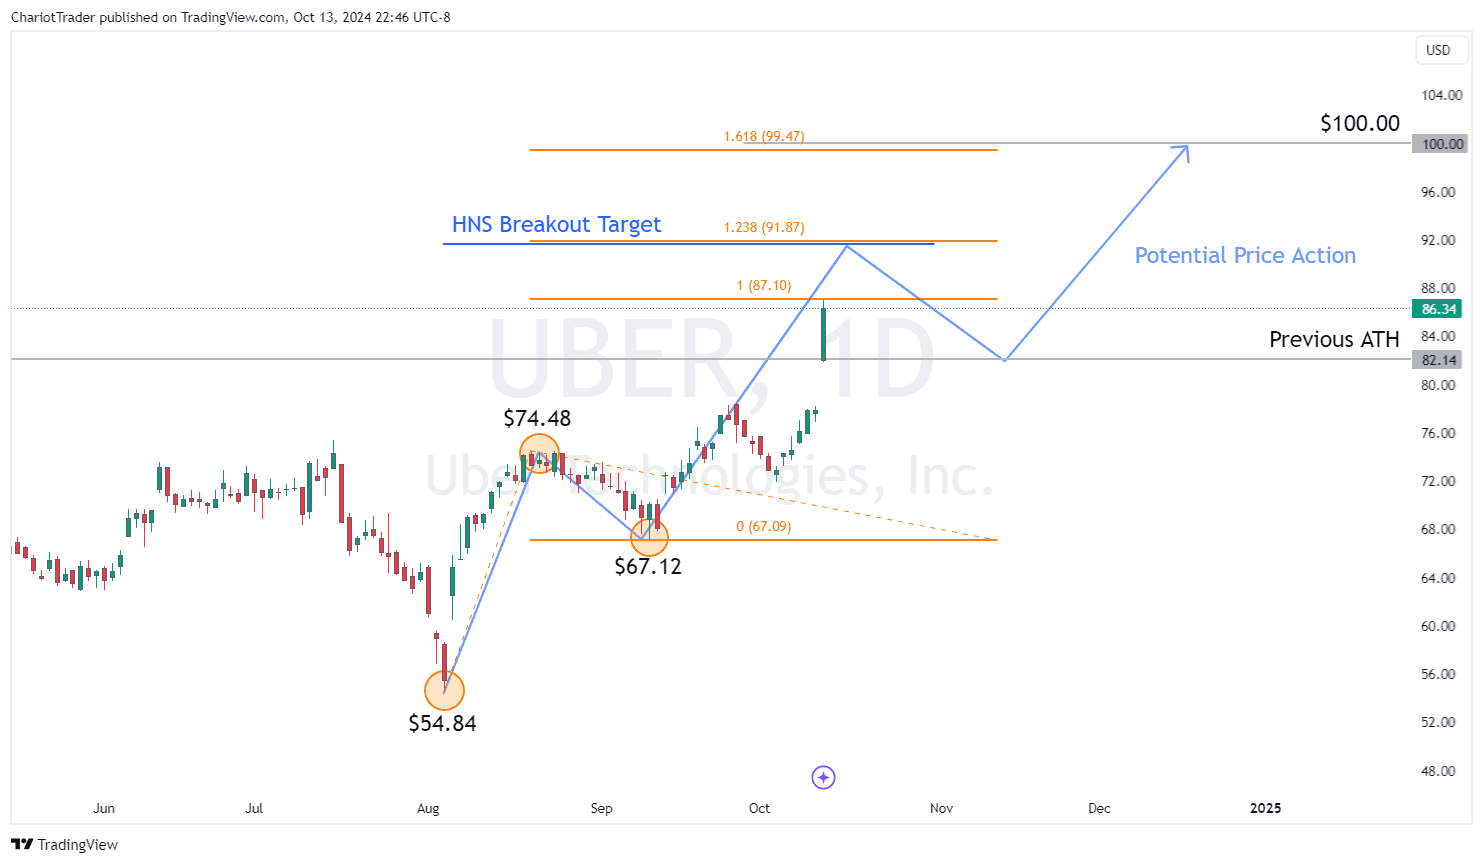
Additionally, should the price of UBER bounce at its previous ATH and daily price gap area, between $82.34 to $78.30, we may see a rise towards the 1.618 Fib Extension Level at $99.47.
Once again, this key extension level closely aligns with yet another key psychological number. These factors suggest the $100.00 price zone would serve as a critical take profit zone for investors and traders.
If the stock price moves higher, all round numbers above the current price should be taken as potential resistances, which means traders should keep an eye on $90, $95, $100 price levels.
| Key Support to Watch on UBER: • Previous ATH at $82.34 • Daily Price Gap from $78.30 to $82.00 |
| Key Resistance to Watch on UBER: • Inverse Head and Shoulders Breakout Target at $91.70 • Fib Extension Level 1.238 at $91.87 • Fib Extension Level 1.618 at $99.47 • Major Psychological Level at $100.00 |
Keep in mind that this analysis is meant to provide traders with key data points to watch, and not influence your overall strategy. Traders should still rely on their own strategic setups to look for entries into the Uber Stock CFD, available for trading on Alchemy Markets.
You may also be interested in:
USDCAD Analysis: What to Expect


