


Written by:


- Chart of the Day
- September 23, 2024
- 2 min read
Blow the Horns: Bullish Reversal Indications on USDJPY
For the last two months, USDJPY has found itself taking a hit to the downside after an extreme rise to the upside. Finally finding some footing at its previous low around the ¥139.50 to ¥140.00 levels, USDJPY is now showing signs for a bullish reversal.
This Chart of the Day from Alchemy Markets lays out the possible scenarios which can occur in the upcoming days and weeks for USDJPY.
Trade USDJPY on Alchemy Markets Today: Zero Commissions* and Institutional Spreads.Bullish Signs on USDJPY Daily Chart (September 23rd, 2024)
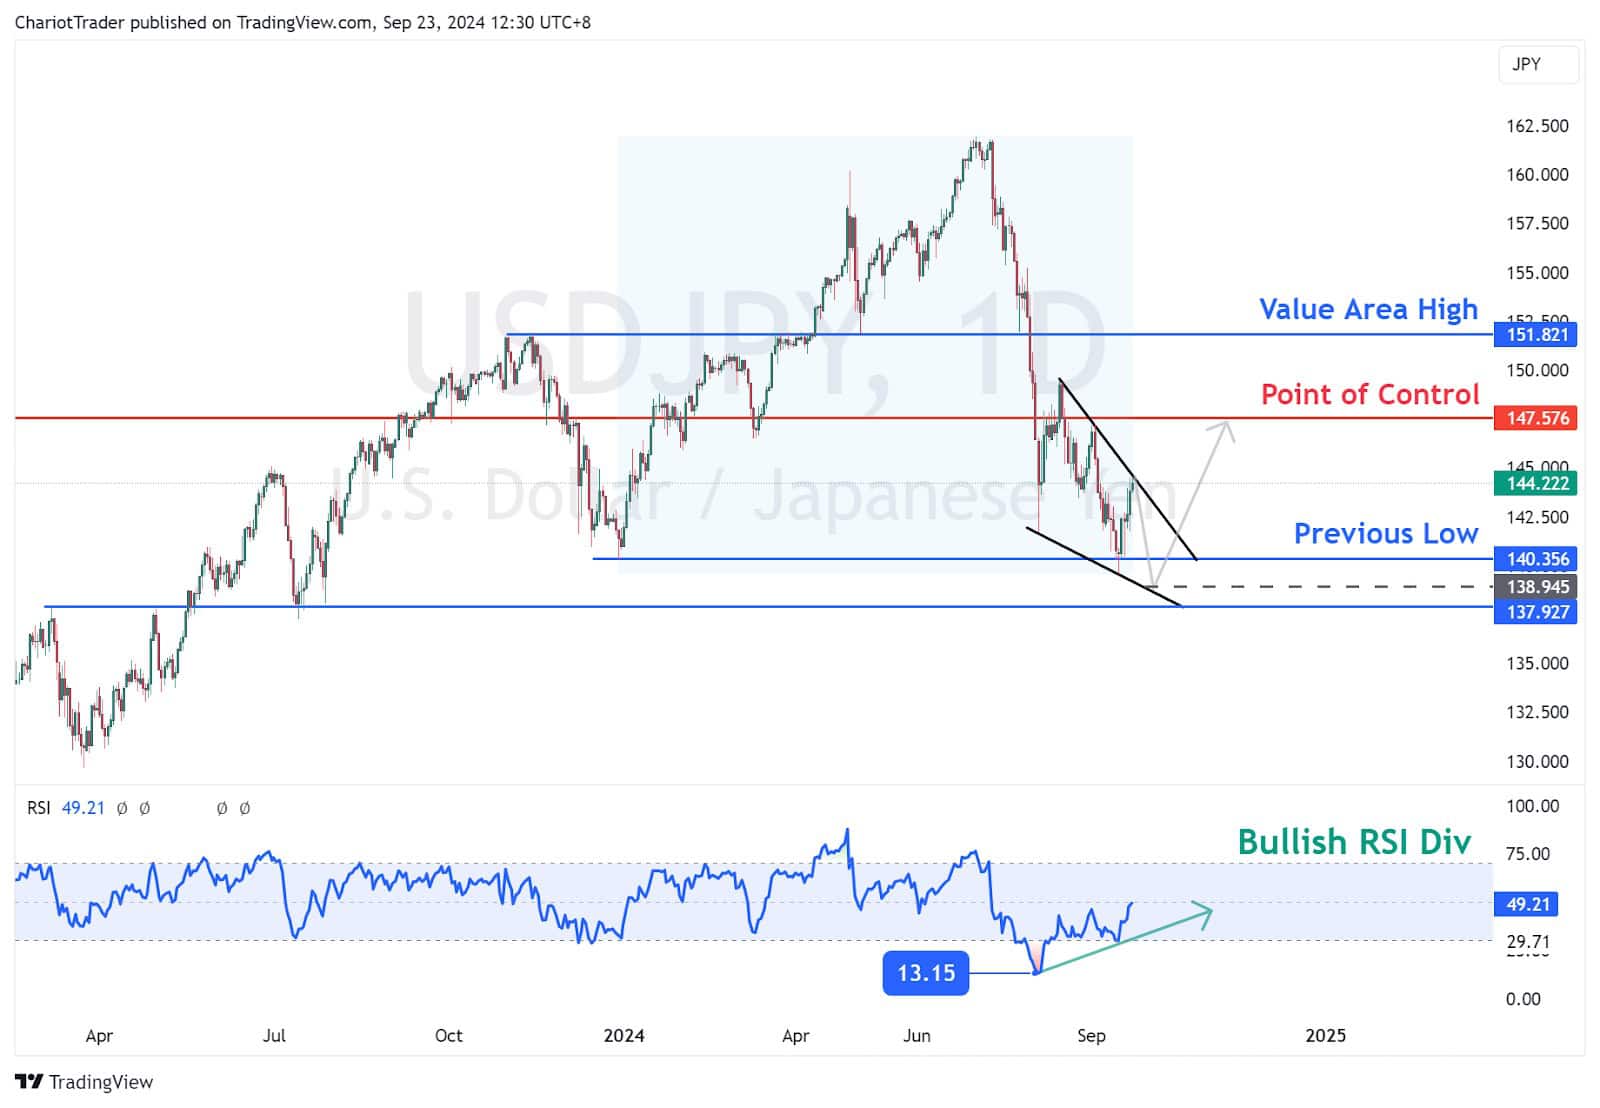
After forming a new low at approximately ¥139.551, USDJPY has seen a rise in the past few days towards a trendline resistance at around ¥144.500.
This comes in tandem with the potential formation of a falling wedge, a bullish reversal pattern, and also the creation of a bullish RSI divergence after being severely oversold on the daily timeframe.
When paired together, the falling wedge and RSI divergence could signal a temporary reversal if USDJPY manages to break the pattern towards the upside.
The targets of this breakout would be as follows:
- 2024’s Point of Control at ¥147.576
- Top of Falling Wedge Pattern at ¥149.399
Despite these bullish signals, we’re still at trendline resistance, which could trigger a downside move towards the lower trendline of the failing wedge. These levels are:
- Approximately sub ¥139.000
- Or even lower at another previous low, at approximately ¥137.900
Sub ¥139.000, or as low as ¥137.900, would complete the five-wave structure within the wedge, setting up an ABC correction towards the wedge’s high (a conservative target), with an extended target at ¥152.000, which aligns with the Value Area High and a resistance level.
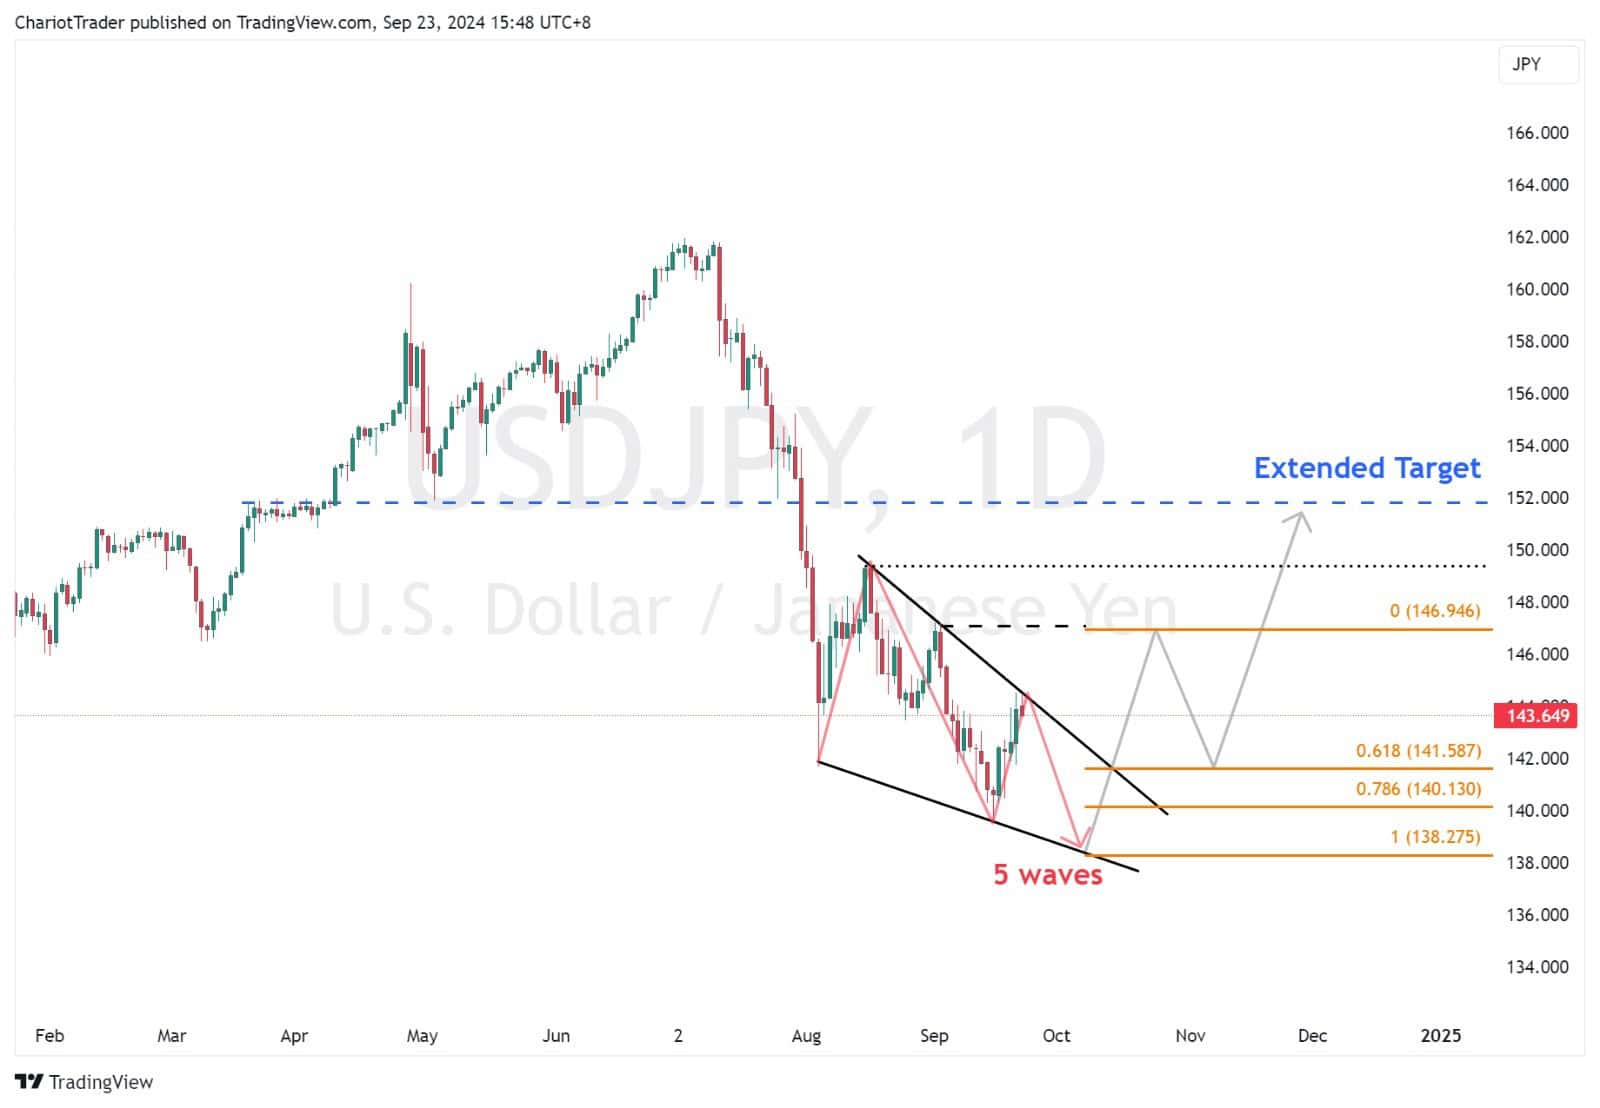
This may align with a continued bullish divergence if the price drops below the new low of ¥139.551, while the RSI stays above 13.15.
Support Levels to Watch on USDJPY: ➡ Sub ¥139.000 – Lower trendline of the falling wedge ➡ ¥137.900 – Previous low, potential key support if price continues to decline ➡ ¥139.551 – New low formed, could act as near-term support |
| Resistance Levels to Watch on USDJPY: ➡ ¥144.500 – Trendline resistance currently being tested ➡ ¥147.576 – 2024’s Point of Control, potential breakout target ➡ ¥149.399 – Top of the falling wedge pattern, key upside target if breakout occurs ➡ ¥151.800 – Value Area High, which aligns with a consolidation zone and resistance level |
You may also be interested in:
Central Banks Playing Limbo – How Low Will They Go?


