


Written by:


- Chart of the Day
- August 27, 2024
- 3 min read
CHF/JPY Poised for a Breakout
Today’s Chart of the Day features the Swiss Franc against the Japanese Yen (CHF/JPY), where the currency pair is currently exhibiting a compelling technical setup that should be monitored closely. The 4-hour chart shows a potential breakout scenario as CHF/JPY approaches a critical juncture.
Forecast of Policy Rates: BoJ vs. SNB
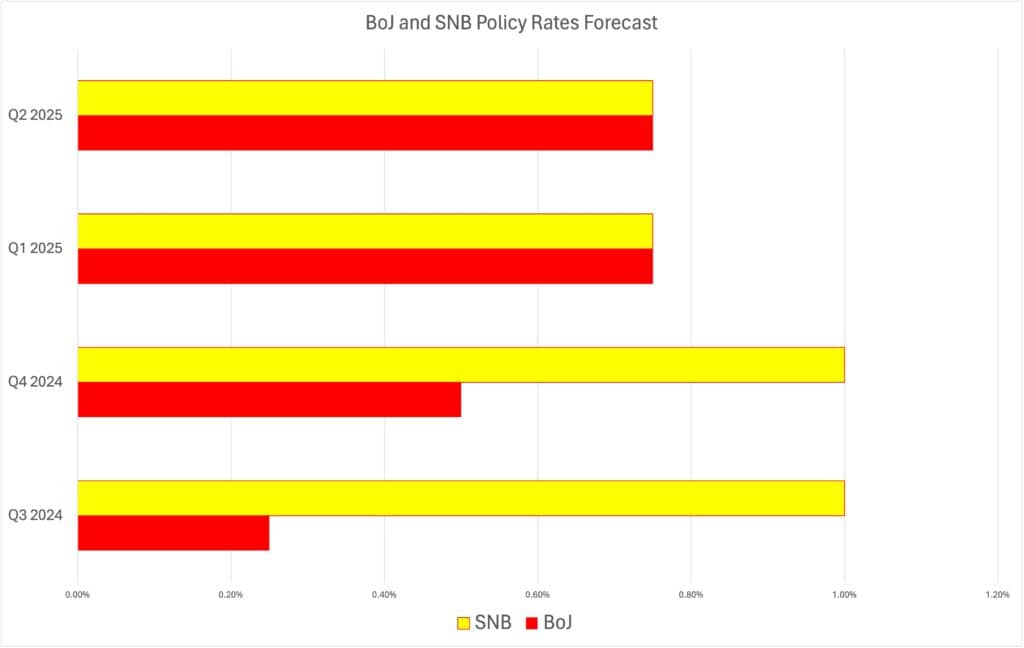
Source: Alchemy Markets
We believe Bank of Japan (BoJ) is expected to incrementally raise its rates, reflecting its hawkish turn. This shift is aimed at curbing inflation, which has begun to edge above the bank’s target, and ensuring that the economic recovery does not lead to an overheating economy.
In contrast, we also forecast Swiss National Bank’s (SNB) rates to remain lower, highlighting its commitment to a dovish policy. The SNB’s strategy is driven by concerns over economic stagnation and a strong Swiss Franc, which poses challenges for the country’s export-driven economy. The bank’s lower rates are intended to keep borrowing costs down, encourage spending, and support economic activity.
Key Projections
- Q3 2024: The BoJ is projected to increase its policy rate to approximately 0.20%, while the SNB is expected to maintain a rate around 1.00%.
- Q4 2024: Further divergence is anticipated as the BoJ raises its rate close to 0.50%, while the SNB holds steady, reflecting its ongoing dovish stance.
- 2025 Outlook: By Q1 2025, the BoJ is forecasted to reach a policy rate of nearly 0.60%, continuing its path of gradual tightening. The SNB, on the other hand, will likely maintain its rate just above 1.00%, prioritising economic stimulus over rate hikes.
Technical Overview
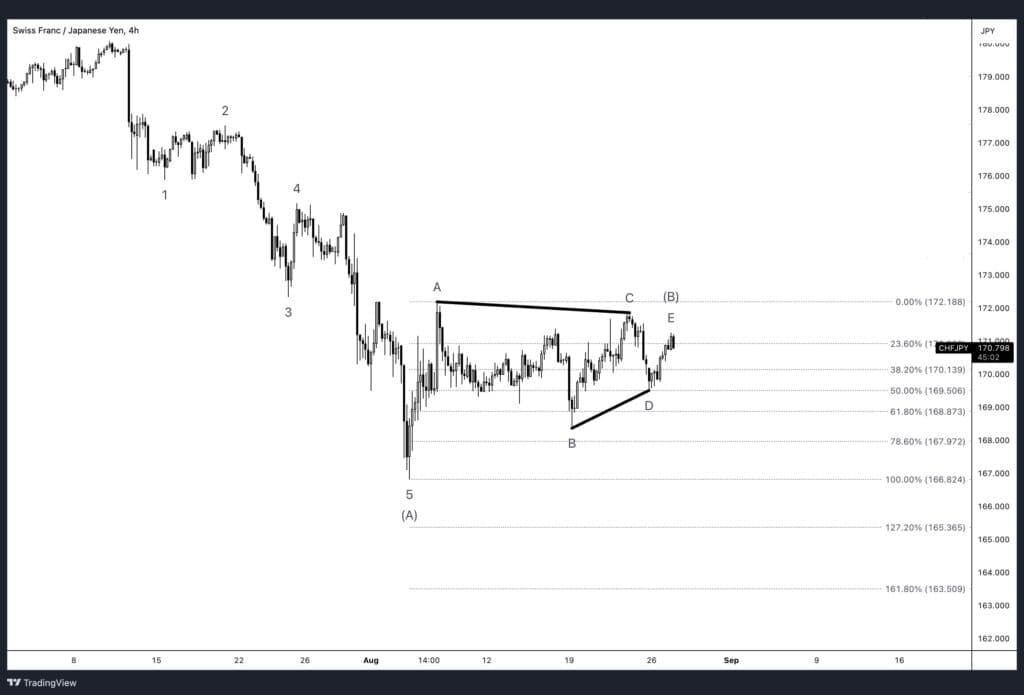
Following a pronounced five-wave decline, CHF/JPY appears to have completed a corrective phase in what seems to be an Elliott Wave Theory triangle pattern. This pattern is characterised by the convergence of the trendlines connecting points A, C, and B, D, forming a symmetrical triangle. This pattern is often indicative of a continuation move, which in this context suggests a resumption of the prior downtrend.
Currently, the price has reached the apex of the triangle, where it has the potential to either break to the upside or downside. Given the context of the preceding downtrend, a bearish breakout is more likely, aligning with the broader market sentiment.
Initial and Secondary Targets
Initial Target: The first target for this setup is derived from the base of the triangle, which provides a measured move projection. The base of the triangle measures the distance from point A to point B, suggesting that upon a confirmed breakdown below the lower trendline (point D), the pair is likely to target levels near the 50% Fibonacci retracement around 169.506.
Secondary Target: Should CHF/JPY continue to decline and break below the 78.6% Fibonacci retracement level at 167.972, the next logical target would be just below 167.000. This target corresponds to the 100% Fibonacci extension of the previous wave, which also aligns with significant support levels observed on the daily chart.
Key Levels to Watch
- Immediate Resistance: 172.188 (0% Fibonacci retracement)
- Immediate Support: 170.139 (23.6% Fibonacci retracement)
- Critical Support: 167.000 (100% Fibonacci extension)
Conclusion
As CHF/JPY hovers near the crucial support levels within the triangle, traders should be vigilant for a breakout confirmation. A downside move would align with the broader downtrend, offering potential short opportunities. Monitoring price action as it interacts with key Fibonacci levels will be essential to capturing the impending move.


