


Written by:


- Opening Bell
- August 13, 2024
- 3 min read
U.S. PPI Data Could Set the Tone for Global Equities Today
Today, all eyes are on the U.S. Producer Price Index (PPI) as it presents the first inflation-related challenge of the week for global equity markets. As stocks continue their recovery, the PPI data for July will provide an early glimpse into inflation trends ahead of tomorrow’s key Consumer Price Index (CPI) figures. We’re expecting a 0.2% month-on-month increase in PPI, which should help calm investor concerns and support a smooth, gradual decline in the U.S. dollar.
PPI July Data: Key Insights
The market is anticipating a 0.2% month-on-month increase in both the headline and core PPI for July. This aligns with the consensus view and should reassure investors that inflation is under control, avoiding any shocks that could disrupt the recent recovery in global stock indices. A stable PPI reading is crucial as it may signal that tomorrow’s CPI and the following Personal Consumption Expenditures (PCE) won’t spike, which would otherwise negatively impact market sentiment.
With these expectations in mind, we’re forecasting a continued decline in the U.S. dollar, especially against currencies like the Australian dollar (AUD). This downward trend in the dollar could also interrupt the recent correction in USD/JPY, possibly leading to a resumption of its downward trend.
AUD/USD: Technical Analysis and Outlook
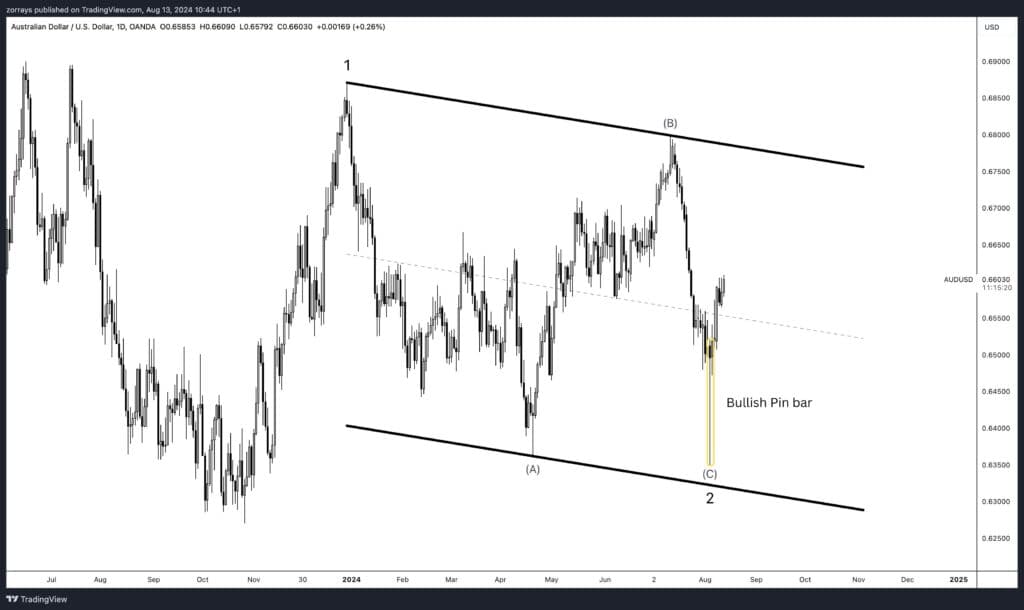
Looking at the Australian dollar against the U.S. dollar (AUD/USD) chart, it appears that Wave C of the corrective structure is complete supported by a Bullish Pin Bar candle stick pattern. This signals that AUD/USD could continue its upward movement, potentially breaking out of the current descending channel. This outlook is supported by the anticipated decline in the U.S. dollar, making AUD/USD a pair to watch for further gains.
Energy Market: OPEC Lowers Oil Demand Forecast
Yesterday, OPEC released its latest report and adjusted its predictions for global oil demand growth, lowering expectations for both this year and next. They now foresee demand increasing by 2.11 million barrels per day in 2024, slightly less than their previous estimate. This change is mainly due to weaker demand from China. Despite the revision, OPEC’s outlook is still more positive than other agencies like the EIA and IEA. On the supply side, OPEC’s production in July increased, driven by higher output from countries like Saudi Arabia and Iraq. Meanwhile, in Europe, natural gas prices dipped slightly as storage levels continue to rise, even though tensions between Ukraine and Russia persist..
Oil Market Outlook: Bearish Triangle Formation
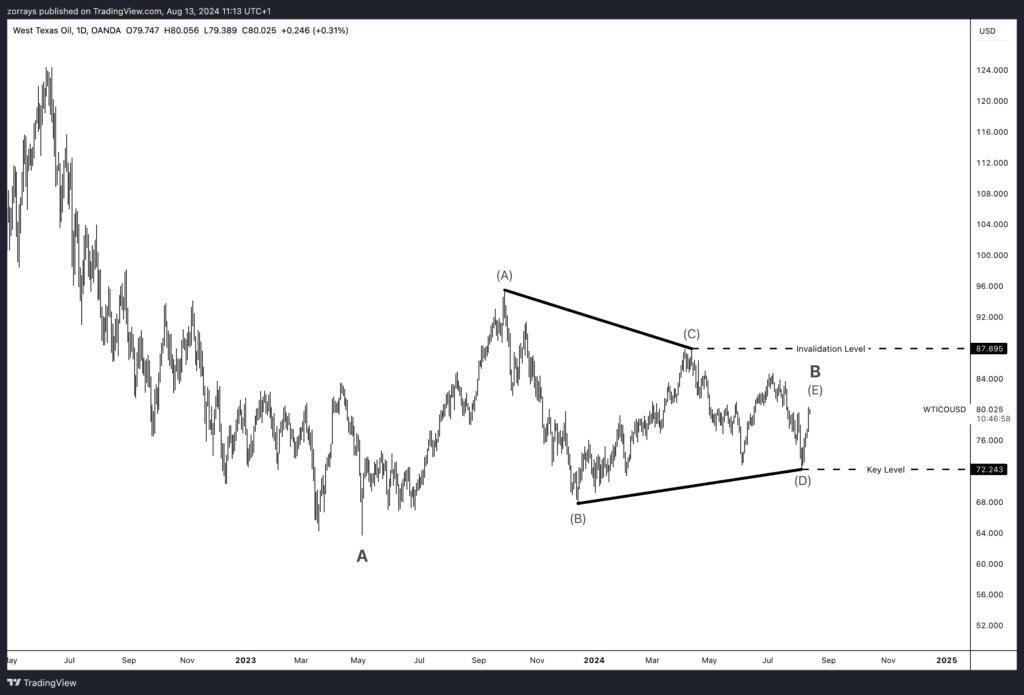
Turning to the oil market, the chart for West Texas Intermediate (WTI) crude shows a bearish triangle pattern forming. This suggests that a potential breakout to the downside could occur, with an invalidation level at $88. The critical trigger point for this triangle is $72, making this the key level to watch. If prices break below $72, it could signal a strong move lower, while a move above $88 would invalidate this bearish outlook.
Overall, today’s market focus will be on the U.S. PPI data and how it influences the U.S. dollar and global equities. The potential for continued gains in AUD/USD and a bearish breakout in oil prices will also be closely monitored as the day unfolds.


