


Written by:


- Chart of the Day
- July 11, 2024
- 3 min read
AUD/USD: The race to 2%!
As Australia grapples with controlling its inflation, the United States has adopted a more dovish stance this quarter compared to the rest of the year. Yesterday, Federal Reserve Chairman Jerome Powell testified that maintaining high interest rates is detrimental to the economy. This dovish shift has led the market to anticipate a potential interest rate drop in the U.S., weakening the dollar. In contrast, Australia continues to hold its rates steady due to persistent inflationary pressures.
United States
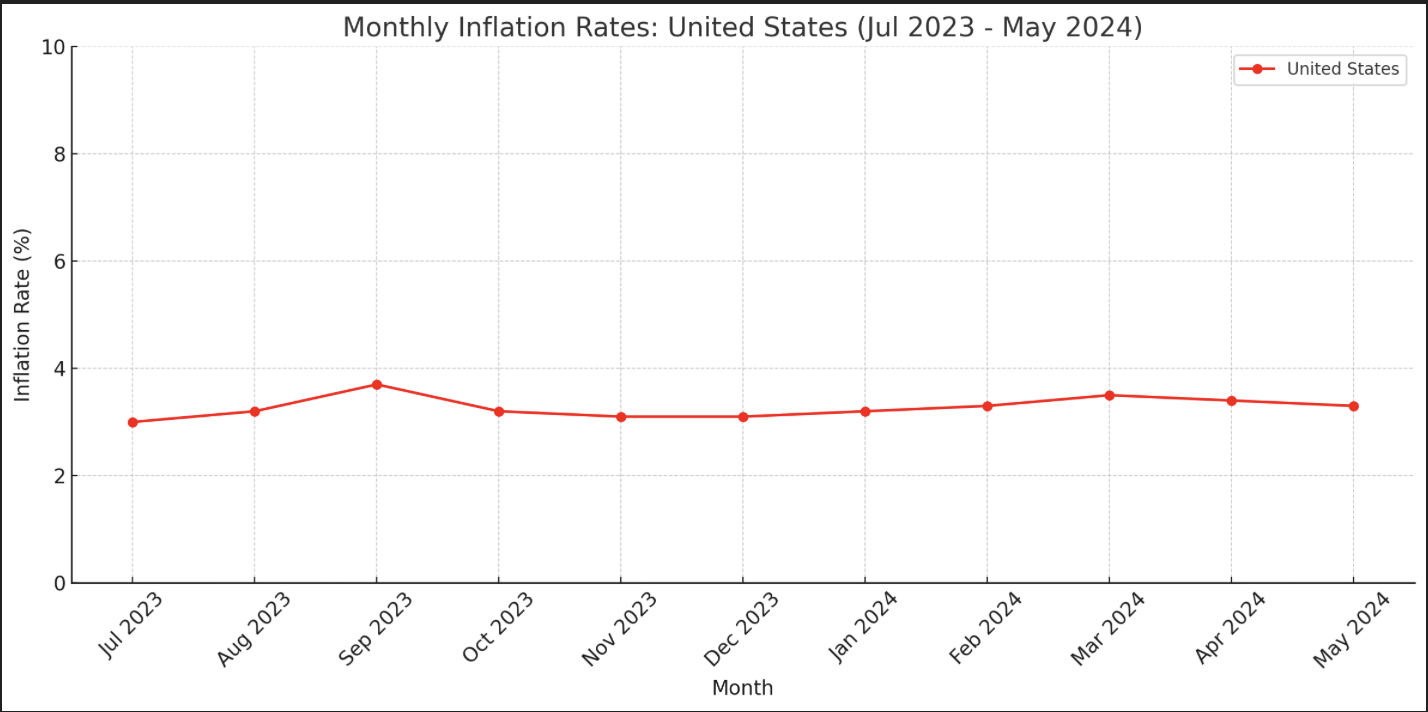
Source: U.S. Bureau of Labor Statistics
Australia
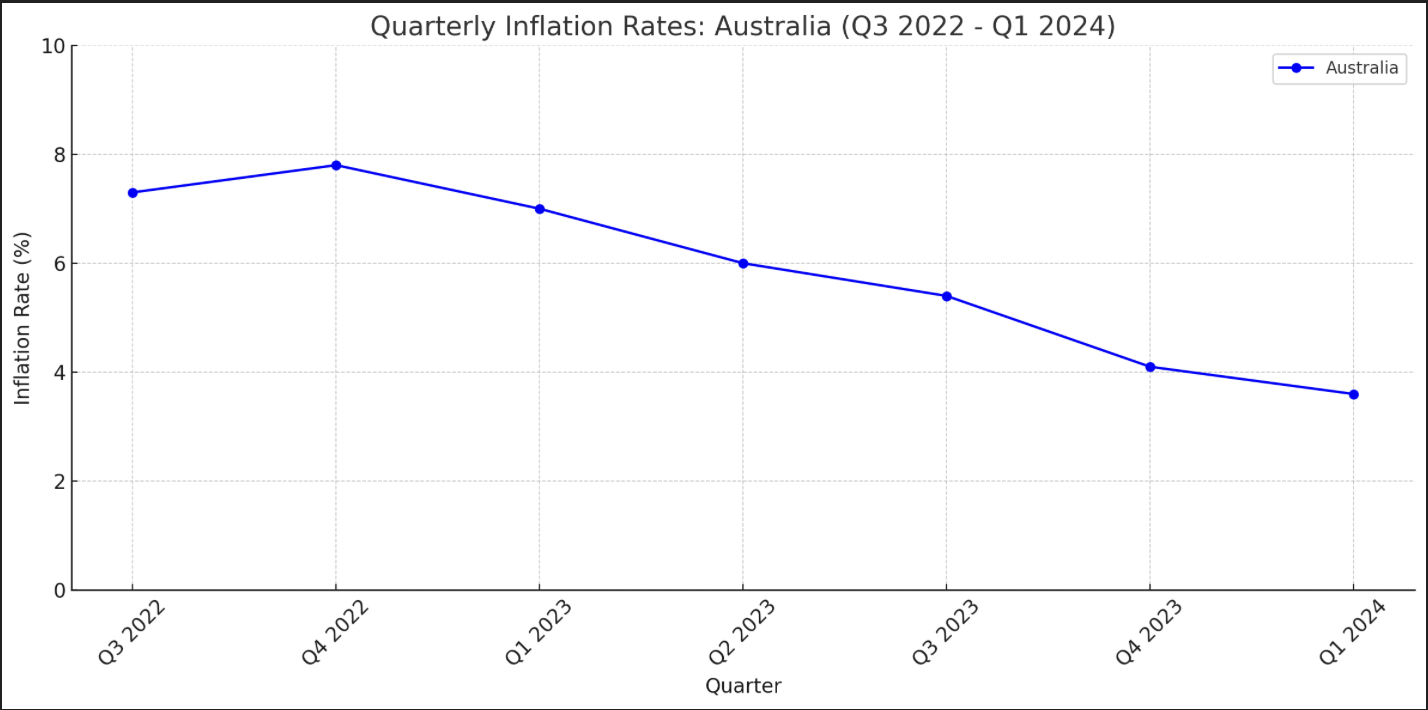
Source: Australian Bureau of Statistics
Technical Analysis
Weekly Chart
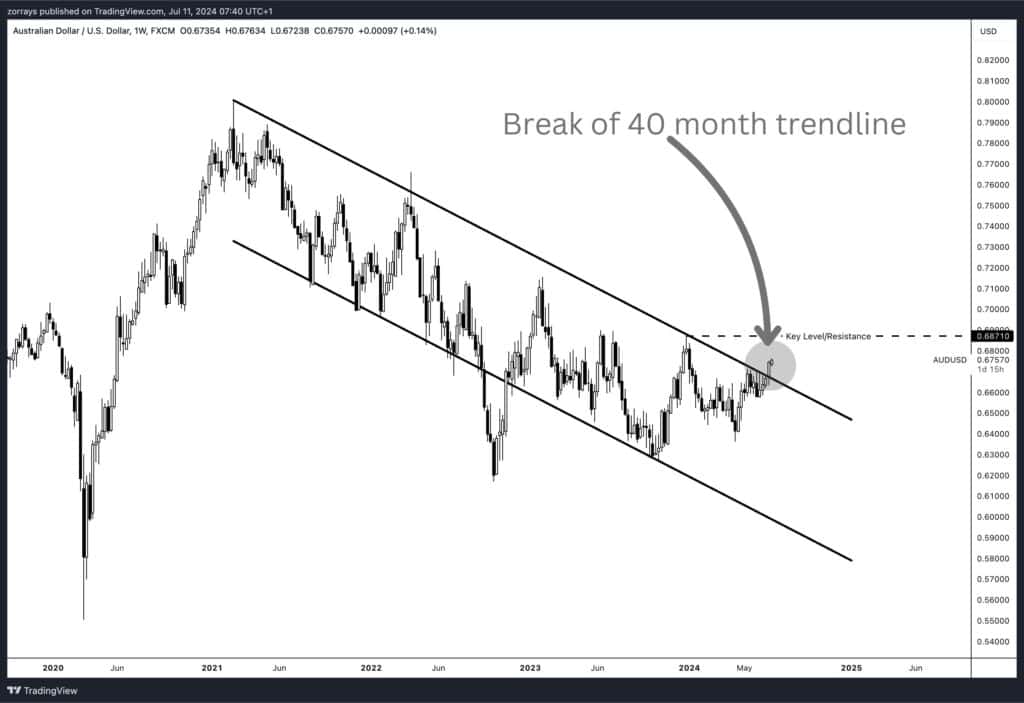
The AUD/USD pair has been trapped in a declining trend for over 40 months, consistently bouncing off the upper bound of a descending channel. Recently, the pair broke out and closed above this long-standing trend line, signaling a potential trend reversal. The fundamentals support a potential climb towards the next resistance level at 0.68710.
The breakout above the descending channel indicates a significant shift in market sentiment. The combination of Australia’s steady interest rates and the U.S. dollar’s potential weakness due to dovish expectations sets the stage for further upside movement.
4-Hour Chart
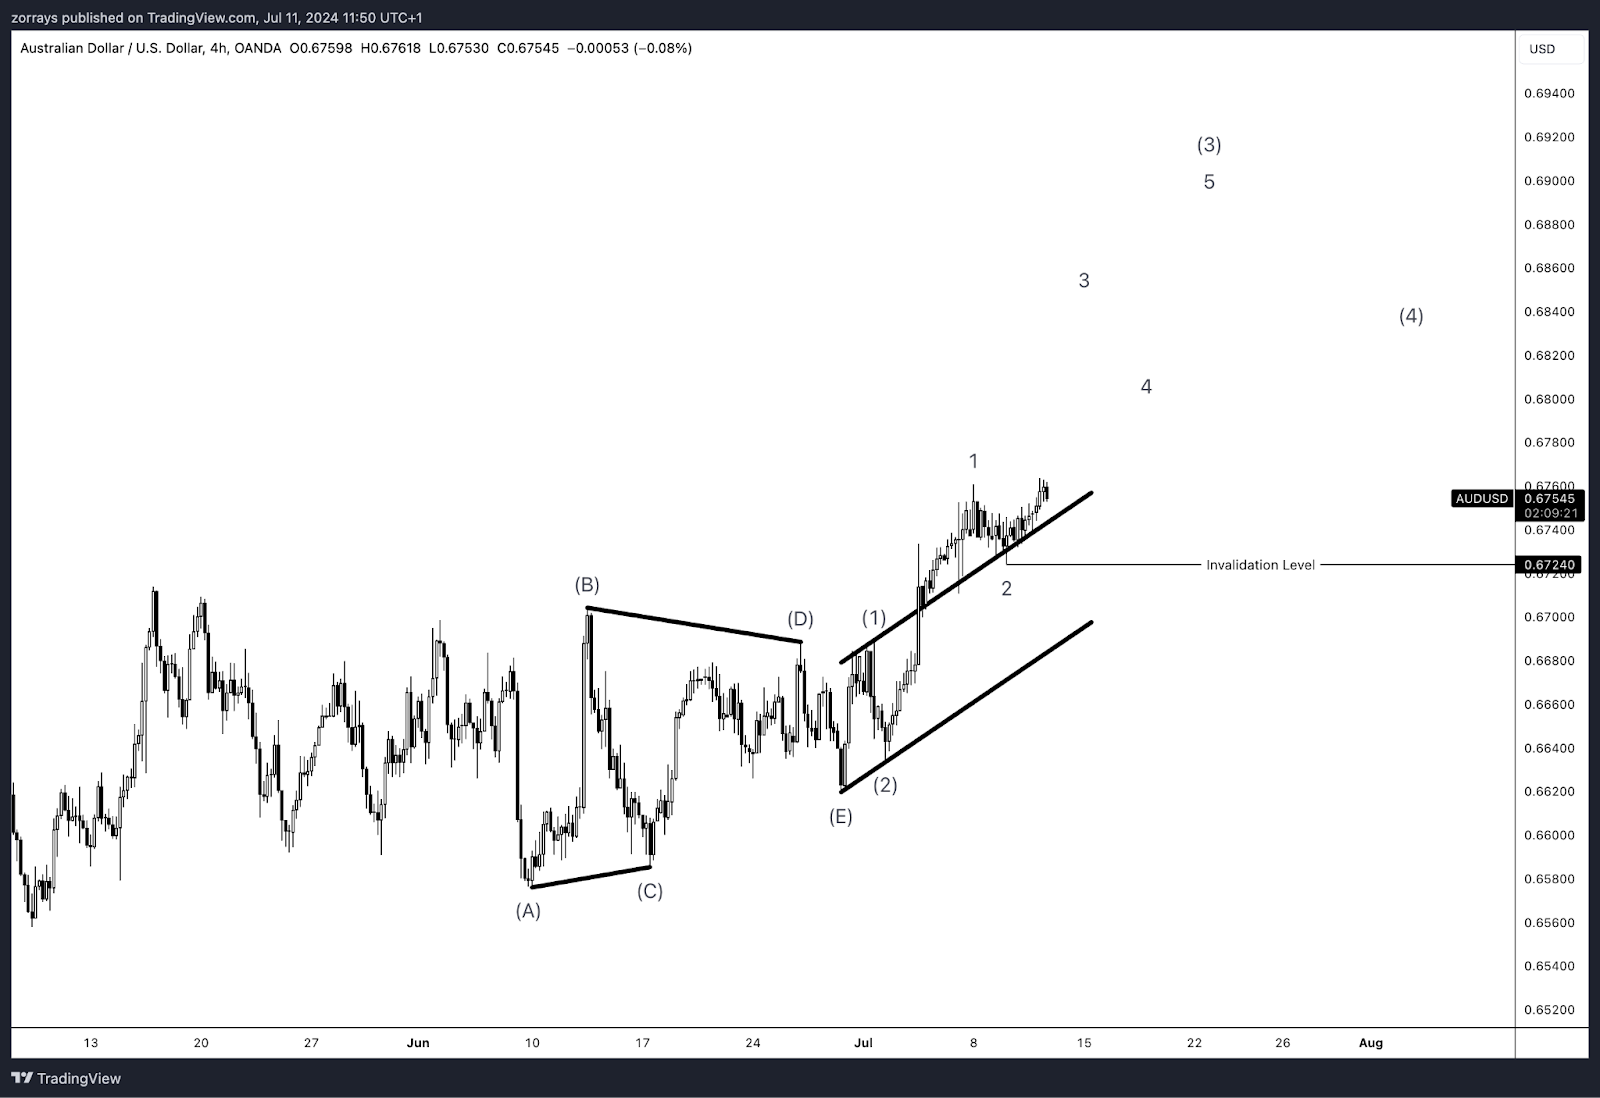
On the 4-hour timeframe, we are anticipating a “3 of 3” wave to the upside, as the pair has broken out of a higher-degree triangle pattern. The invalidation level for this bullish scenario is at 0.67240. If the price stays above this level, it suggests a continued upward momentum. The breakout from the triangle is a strong indication that the bulls are in control, and we could see a significant rally in the coming sessions.
Conclusion
The AUD/USD breaking a 40-month-old trend line and closing above it is a strong bullish signal. Supported by both fundamental and technical factors, this breakout suggests a potential move towards the next resistance level at 0.68710. Traders should keep an eye on the invalidation level at 0.67240 on the 4-hour chart to gauge the strength of this bullish move.
FAQs
What caused the recent breakout in AUD/USD?
The breakout was caused by a combination of dovish signals from the U.S. Federal Reserve and Australia’s continued efforts to control inflation by holding interest rates steady.
What is the significance of breaking a 40-month trend line?
Breaking a 40-month trend line indicates a significant shift in market sentiment, suggesting that the long-term downtrend may be reversing.
What is the next resistance level to watch for AUD/USD?
The next resistance level to watch is 0.68710.
Why is the 0.67240 level important?
The 0.67240 level is the invalidation point for the current bullish scenario on the 4-hour chart. If the price falls below this level, it could signal a reversal or weakening of the bullish trend.
How do fundamentals support the technical breakout?
Fundamentals support the technical breakout as Australia’s steady interest rates contrast with the U.S.’s dovish stance, leading to a potential weakening of the U.S. dollar and strengthening of the AUD.
What should traders watch for in the coming sessions?
Traders should watch for sustained price action above the 0.67240 level and monitor for any further bullish signals towards the 0.68710 resistance level.


