


Written by:


- Weekly Outlook
- June 21, 2024
- 8 min read
US and UK Economic Indicators to Watch
This past week saw significant developments in the global economic landscape. Switzerland surprised markets by reducing its interest rates, while the UK reached its inflation target. However, the Bank of England decided to maintain its rates during its June meeting, reflecting ongoing economic uncertainties. Looking ahead, next week’s economic calendar features key indicators from the U.S. and the UK that are set to influence market dynamics.
United States
CB Consumer Confidence Index
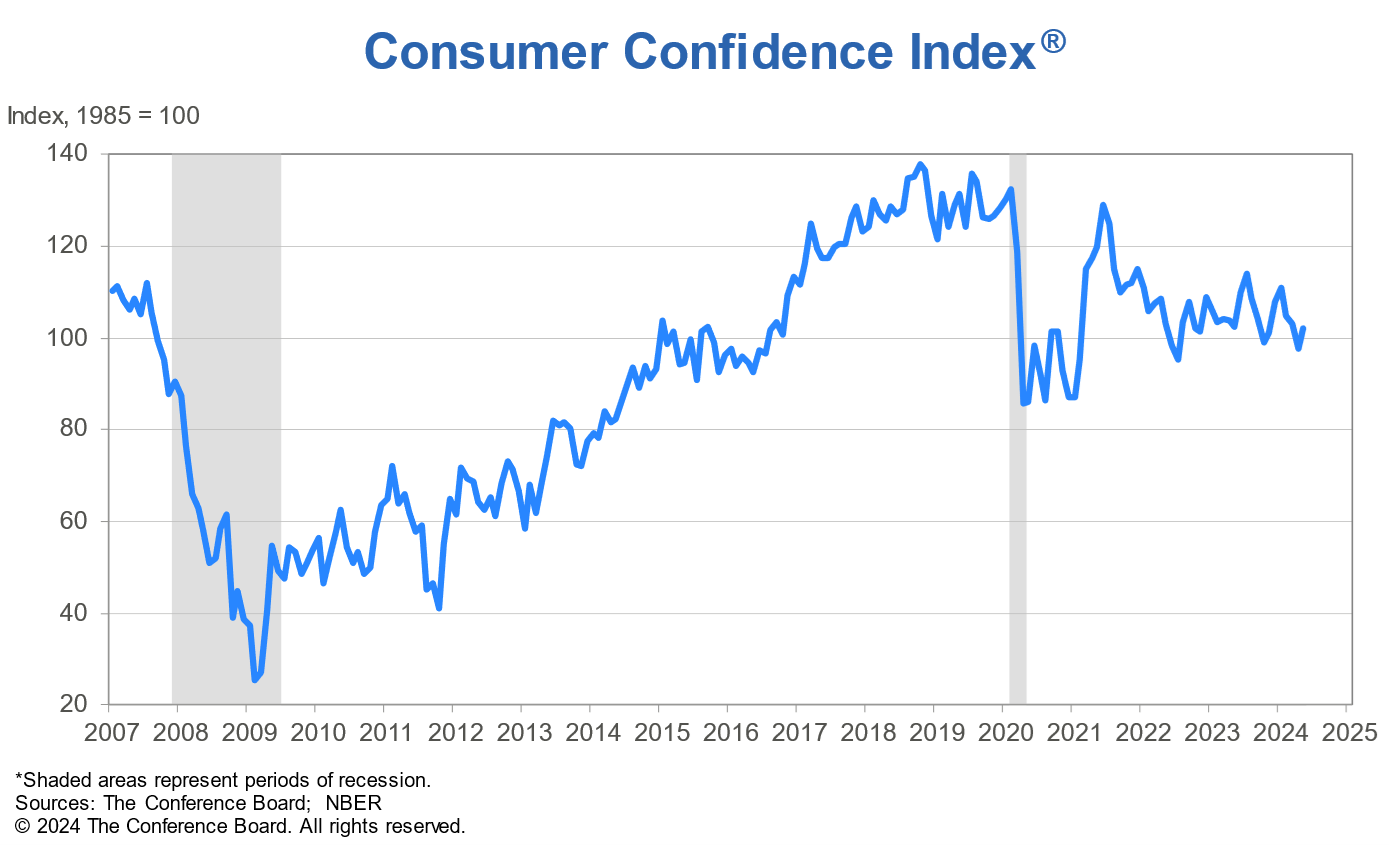
In the United States, several critical economic indicators are scheduled for release. The CB Consumer Confidence index for June 2024 will be released, with a forecast of 100, down from the previous month’s 102. Consumer confidence is a leading indicator of economic health, as higher confidence typically leads to increased consumer spending, driving economic activity. A decline in this index could signal caution among consumers, potentially slowing economic momentum. If the index falls more than expected, it could weaken the USD by aligning with the current disinflationary narrative and expectations for potential rate cuts. Conversely, a higher-than-expected reading might strengthen the USD by suggesting robust consumer sentiment.
New Home Sales
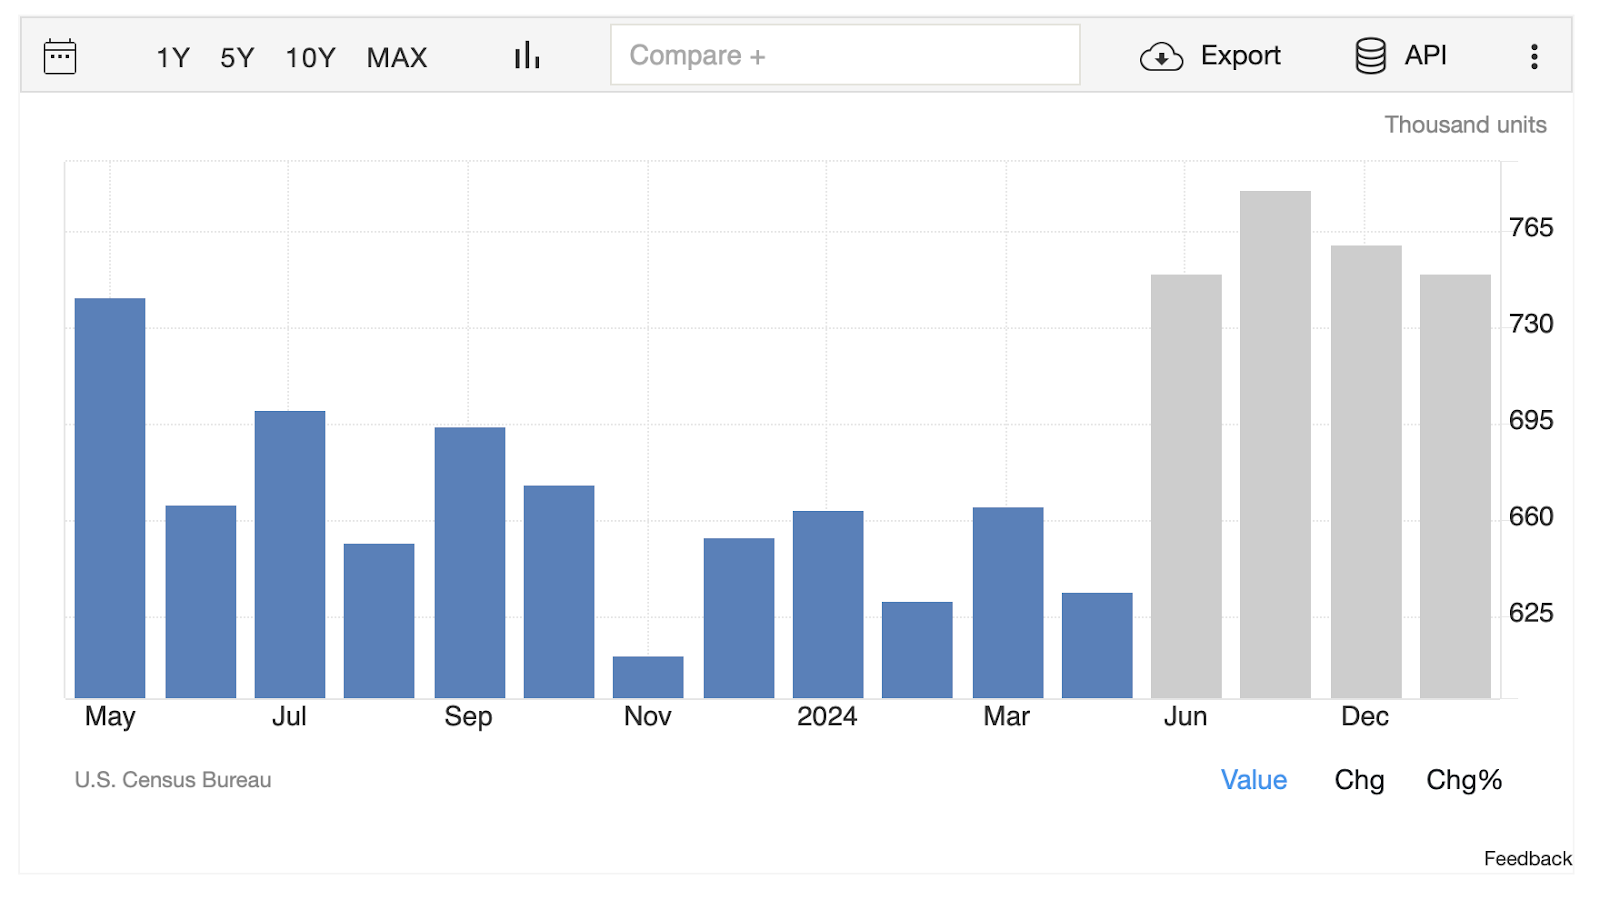
Next, the New Home Sales data for May 2024 will be released, with a forecast of 650K, up from 634K in the previous month. This indicator measures the annualized number of new single-family homes sold during the previous month and is a vital gauge of housing market health and consumer demand. Strong new home sales indicate economic confidence and robust consumer spending, which contribute positively to GDP growth. Conversely, weak sales could suggest economic sluggishness. Higher-than-expected sales figures would support the USD, reflecting economic strength, while lower sales figures might weaken the USD, reinforcing the narrative of an economic slowdown.
GDP (QoQ) Q1 2024
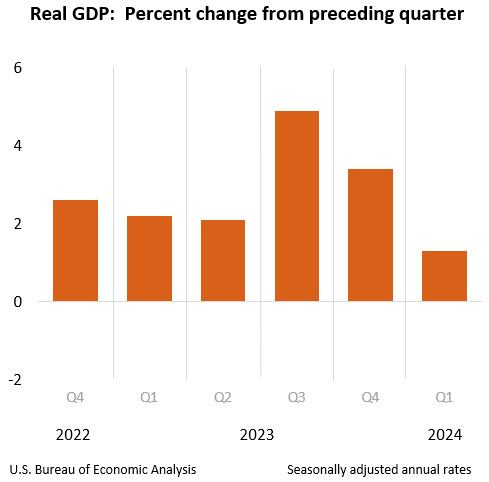
The GDP (QoQ) data for Q1 2024 is also anticipated, with a forecast of 1.3%, down significantly from 3.4% in the previous quarter. GDP measures the total value of goods and services produced within the U.S. and is a comprehensive indicator of economic health. A significant drop in GDP growth indicates a sharp deceleration in economic activity, raising concerns about economic stability and potential recession risks. A lower-than-expected GDP figure would likely weaken the USD, aligning with expectations of a cooling economy and potential rate cuts. Conversely, a better-than-expected figure might strengthen the USD by indicating stronger economic resilience.
Chicago PMI

Additionally, the Chicago PMI for June 2024 will be released, with the previous reading at 35.4. The Chicago Purchasing Managers’ Index measures the economic health of the manufacturing sector in the Chicago region and is a leading indicator of manufacturing activity. Persistent low readings indicate ongoing weakness in the manufacturing sector, which can drag on overall economic growth. A higher reading would signal improvement in manufacturing activity. A higher-than-expected PMI reading would be bullish for the USD, indicating stronger manufacturing activity, while a lower reading would be bearish, suggesting continued economic weakness.
Dollar Index
Bearish View on the U.S. Dollar Index (DXY)
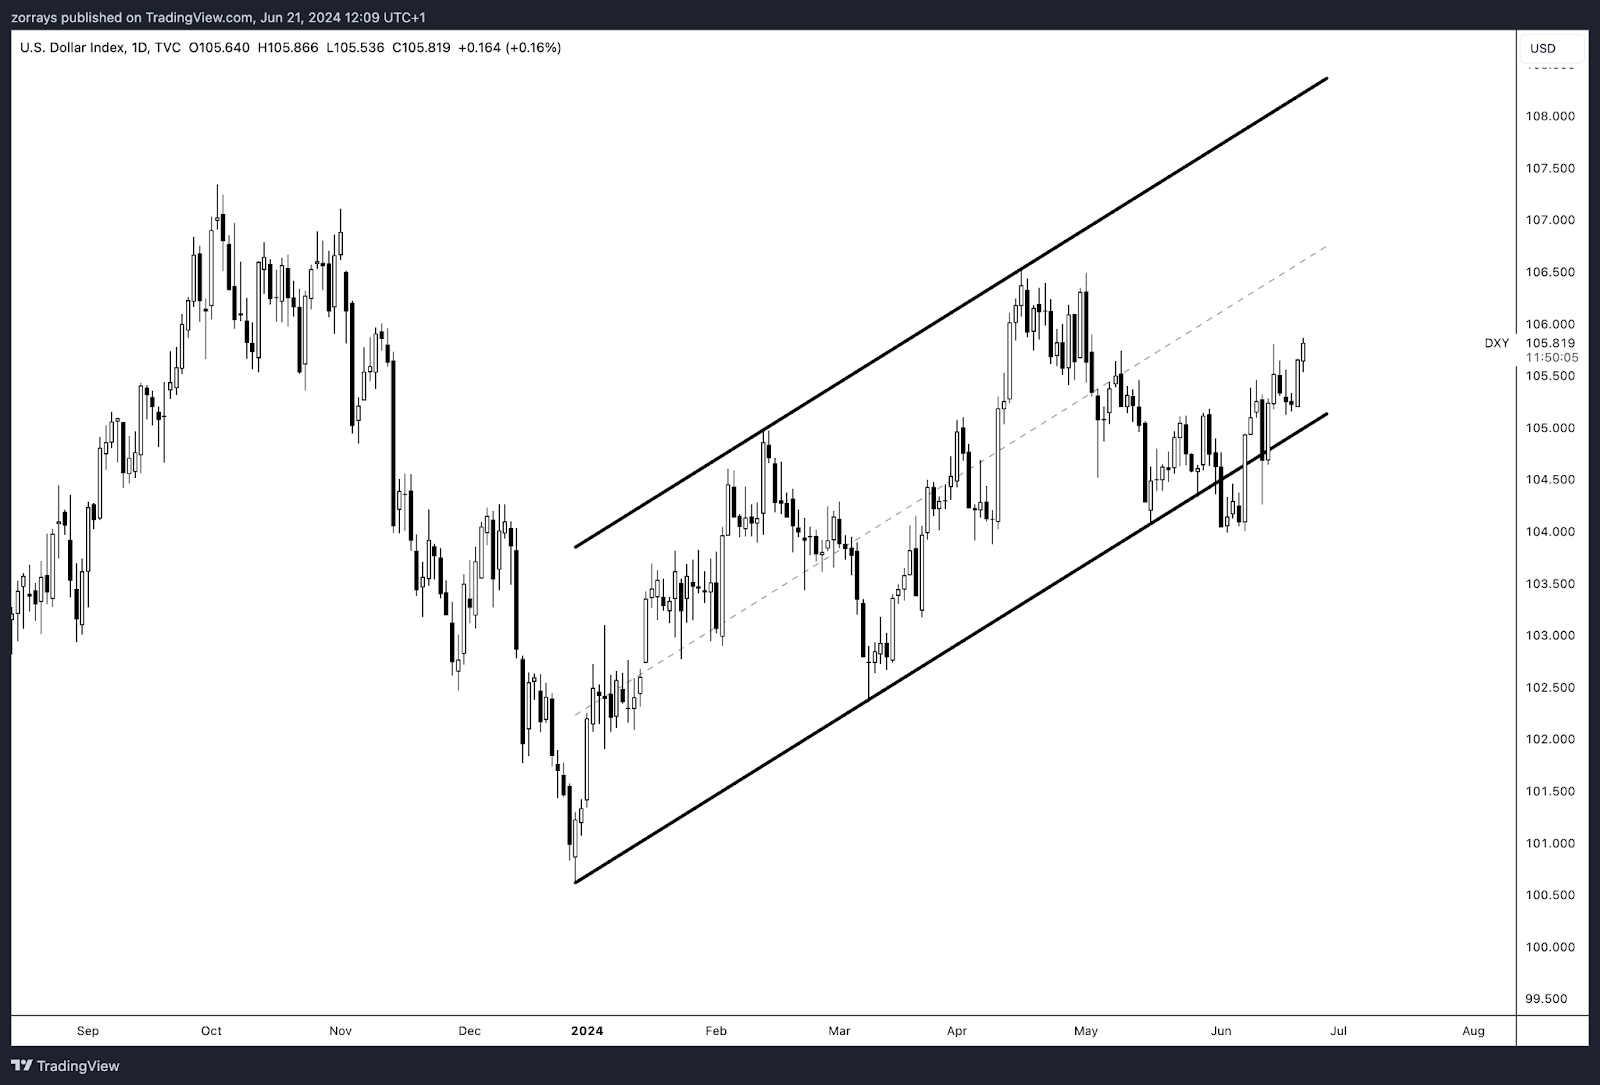
The first chart presents a bearish outlook on the U.S. Dollar Index (DXY), showing a descending trend channel that has been forming over recent months. The index is currently hovering around the 105.8 level, well within the boundaries of this bearish channel. If the upcoming U.S. economic indicators, such as the CB Consumer Confidence, New Home Sales, GDP (QoQ), and Chicago PMI, all meet their forecasted values, this could signal a slowing economy. Specifically, a drop in consumer confidence, a modest increase in home sales, a significant slowdown in GDP growth, and continued weakness in the manufacturing sector as indicated by the Chicago PMI, collectively suggest a cooling economic environment. This scenario would likely reinforce expectations for the Federal Reserve to cut interest rates, weakening the USD further and potentially pushing the DXY lower within its bearish trend.
Bullish Alternative on the U.S. Dollar Index (DXY)

The second chart offers a bullish alternative for the U.S. Dollar Index (DXY). It illustrates a broader upward channel that suggests the potential for the DXY to maintain its strength and possibly rise further. Despite the forecasts for the upcoming economic indicators, if the actual data surpass expectations—such as higher consumer confidence, stronger new home sales, and better-than-expected GDP growth—this could indicate that the U.S. economy is more resilient than anticipated. Such outcomes could dampen the immediate need for rate cuts by the Federal Reserve, supporting the USD and pushing the DXY higher. If the Chicago PMI also shows signs of improvement, it would further bolster the case for economic strength, potentially driving the DXY towards the upper boundary of this bullish channel.
United Kingdom
GDP QoQ

In the United Kingdom, the GDP data for Q1 2024 will be in focus, with the QoQ growth forecast at 0.6%, following a decline of 0.3% in Q4 2023. This rebound in economic activity is driven by increases in services output and production, though the construction sector saw a decline of 0.9%. Positive GDP growth is crucial for boosting business and consumer confidence. A higher-than-expected GDP growth is likely to strengthen the GBP, reflecting a recovering economy. Conversely, lower-than-expected growth might weaken the GBP, indicating ongoing economic challenges.
GDP YoY
The YoY GDP growth for Q1 2024 is forecasted at 0.2%, up from -0.2% in the previous quarter. This modest recovery highlights ongoing challenges but also signs of improvement. Modest YoY growth might provide limited support to the GBP. However, if growth exceeds expectations, it could boost the GBP by reflecting a stronger economic recovery.
Next week’s economic calendar is packed with crucial data releases that will provide valuable insights into the current state and future direction of the U.S. and UK economies. These indicators will significantly influence market sentiment and currency movements, particularly as both economies navigate their respective disinflationary environments. Stay tuned for detailed technical chart breakdowns to further understand the potential market impacts.
Technical Analysis
AUD/USD – H1
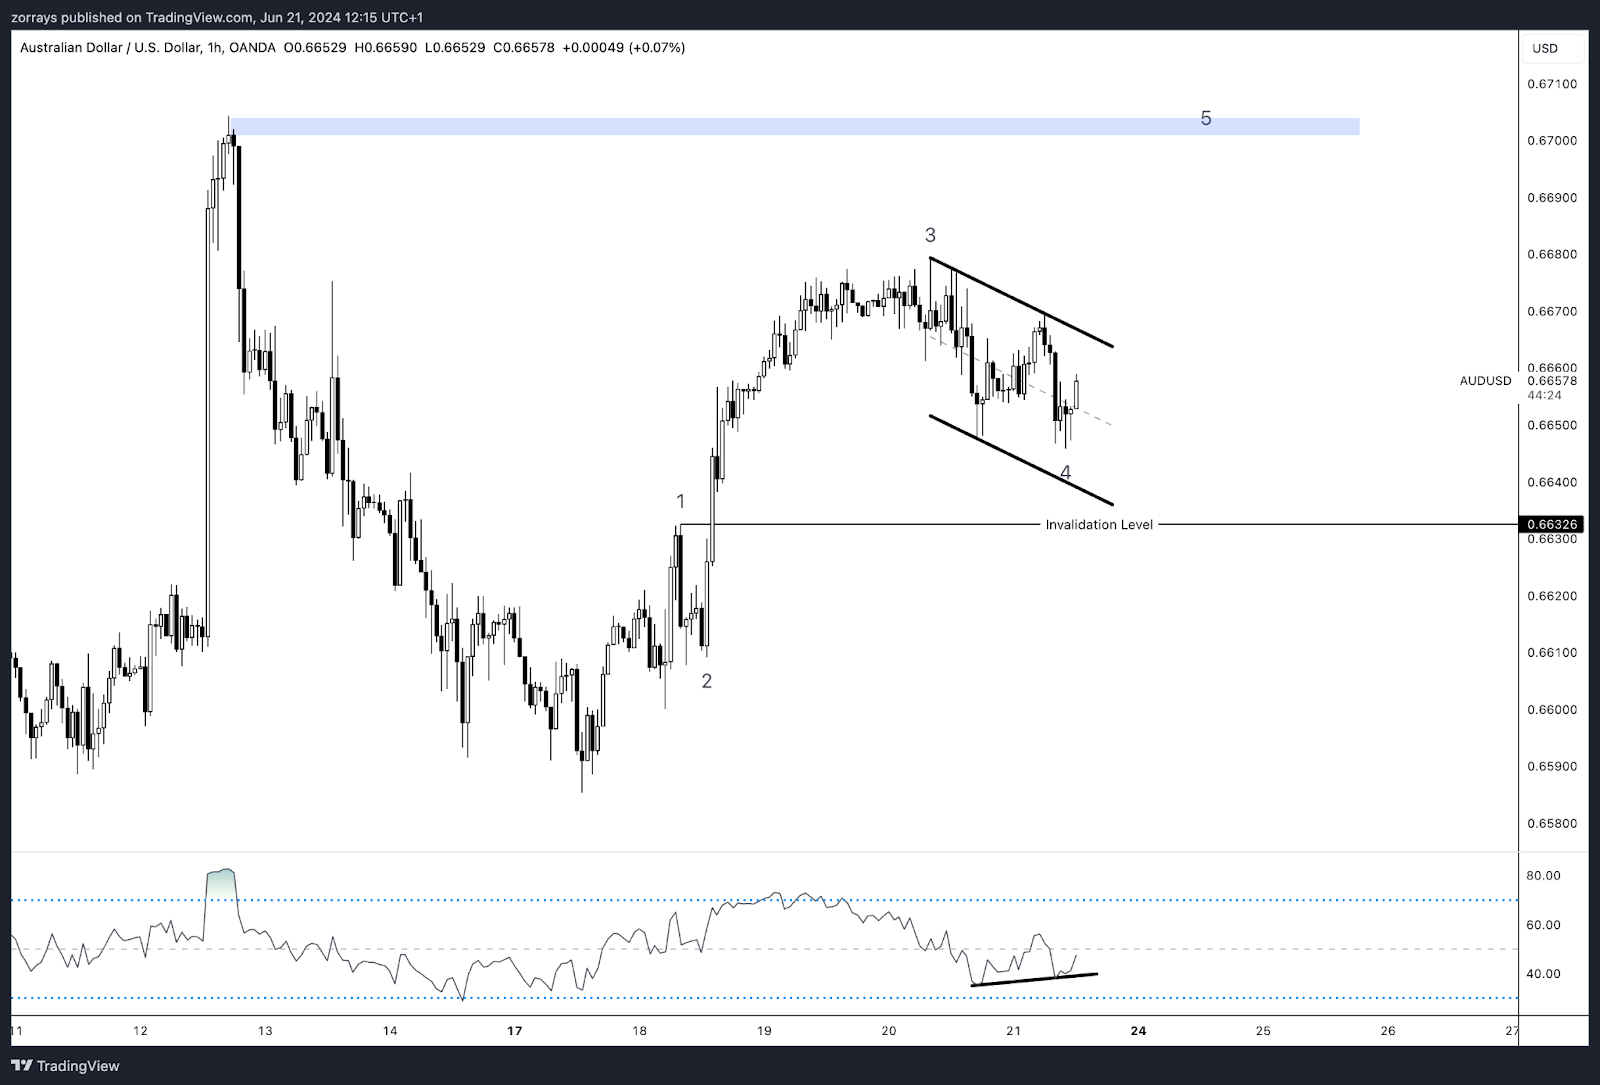
The AUD/USD chart presents an intriguing setup driven by macroeconomic fundamentals and technical patterns. The Reserve Bank of Australia (RBA) remains hawkish, with no evident signs of cutting rates in the near term. In contrast, the Federal Reserve has been hinting at possible rate cuts this year, at least once. This divergence in monetary policy outlooks has been supportive of the Australian Dollar (AUD), allowing it to gain ground against the U.S. Dollar (USD).
Elliott Wave Analysis
The current wave count suggests that AUD/USD is in the process of completing a five-wave impulsive move. Here’s the detailed breakdown:
Wave Structure:
- Wave 1: Initiated the upward movement, marking a strong bullish reversal.
- Wave 2: Corrected wave 1 but did not retrace more than 61.8%, maintaining the bullish structure.
- Wave 3: Extended wave, demonstrating strong buying momentum and reaching new highs.
- Wave 4: Currently consolidating in a descending channel, representing a corrective phase before the next impulsive move. It is crucial that wave 4 does not enter the territory of wave 1, maintaining above the invalidation level at 0.663.
Wave 5: Expected to complete the impulsive structure, targeting the resistance zone around 0.671. The RSI indicates bullish divergence, supporting the potential for an upward move.
Based on the current Elliott Wave structure and the macroeconomic backdrop, AUD/USD appears poised to move higher into wave 5, targeting the resistance zone near 0.671. The invalidation level sits at 0.663, as per Elliott Wave rules, where wave 4 should not overlap with wave 1’s territory. Given the hawkish stance of the RBA and the dovish inclinations of the Fed, the AUD/USD pair is likely to continue its upward trajectory in the near term.
S&P500 (SPX)
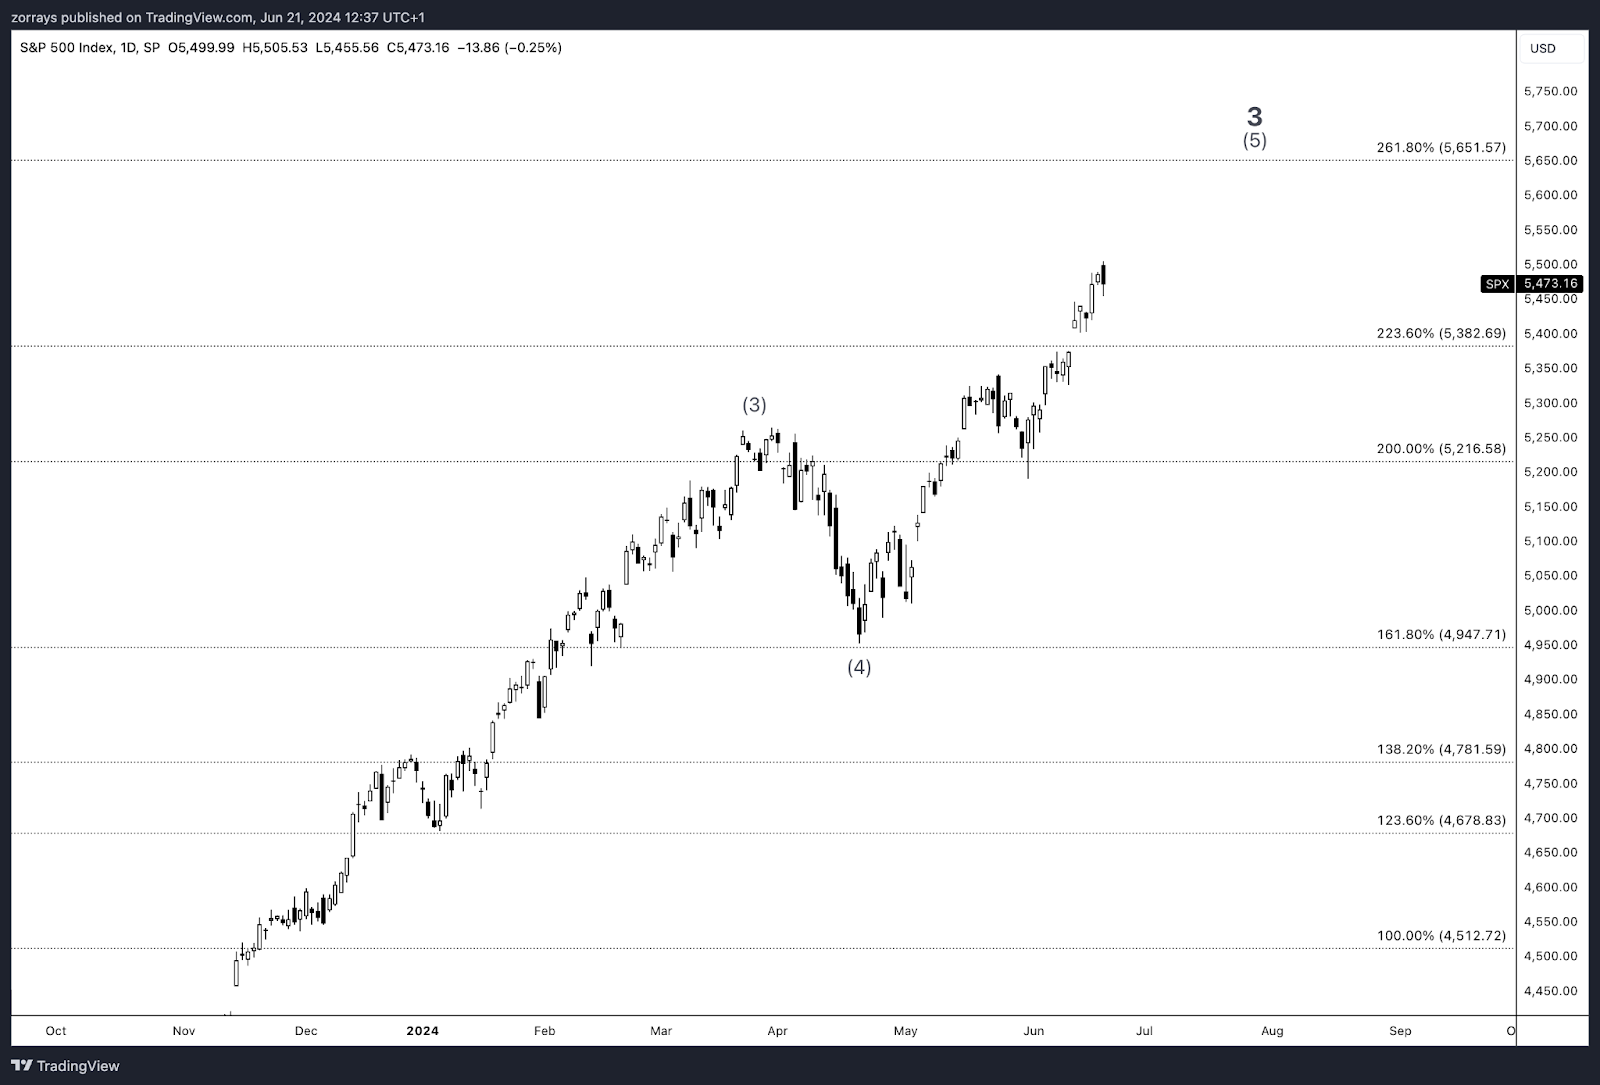
We have a medium term projection for the S&P 500 to 5600, driven by milder-than-average negative earnings revisions and a higher valuation multiple. The S&P 500 index has returned about 15% since the start of the year, with earnings and valuation contributing equally to that return. Despite typical negative revisions, stellar earnings growth from five megacap tech stocks has offset this trend. Consensus forecasts now indicate a significant gap between earnings per share growth for these stocks compared to the median S&P 500 firm. The forward 12-month P/E multiple is expected to reach 20.4x by the end of 2024, reflecting stable earnings estimates.
SPX Chart Analysis
The SPX chart indicates that we are currently in wave 5 of an Elliott Wave structure. Based on the forecasted economic scenario, we can expect the S&P 500 to potentially reach the 5600 region, completing this wave 5. The bullish outlook is supported by robust earnings growth and higher valuation multiples, aligning with the technical projection of continued upward momentum.


