


Written by:

Reviewed by:

- July 22, 2025
- 34 min read
Smart Money Concept: Boost Your Trading Strategy
The Smart Money Concept approach has gained in popularity in the digital age of trading, and presents an alternative way of thinking about support and resistance, and candlestick patterns.
Let’s dive in and see what the fuss is all about.
What is Smart Money Concept (SMC)?
Definition and Origin of SMC
Smart Money Concepts (SMC) is a modern trading framework focused on anticipating how large financial institutions such as banks, hedge funds, and market makers influence market movement.
The core belief is that when these large financial institutions trade in size, they leave behind identifiable price action patterns. Traders use these clues to align with institutional flow instead of reacting to it.
SMC draws from the Wyckoff Method, which introduced the idea of the ‘Composite Man’—the collective movements of large institutional players, aka Smart Money. SMC builds on that concept by teaching traders how to spot: order blocks, fair value gaps, liquidity grabs, and structural breaks to anticipate Smart Money price moves.
Why SMC is Important
Smart Money Concept is an important study because it forces traders to think beyond surface-level indicators, and engage with the mechanics of how markets function — i.e. what needs to happen mechanically in order for a trade to be transacted in the market.
Two core concepts to understand are:
- Every buy needs a seller, and every seller needs a buy for a trade to occur.
- When traders are stopped out or liquidated, they enter an opposite position of their initial trade.
Consider when large institutions, such as BlackRock, need to move size. Blackrock manages over $10 trillion in assets…they can’t just press ‘buy’ and expect to get all their orders filled. Instead, they need to engineer conditions where retail traders unknowingly become their liquidity. For instance, by dropping prices so low that the retail, who were initially in long positions, are stopped out or liquidated—turning retail orders into sell positions to fill the large institution’s buy orders.
SMC helps you spot when, and where these types of manipulation have occurred in the price chart. By understanding institutional flow, traders can get a tactical edge and trade WITH the Smart Money, not against.
How Smart Money Influences Retail Traders
When smart money initiates large transactions, they often cause breakout or breakdown patterns that lure retail into the wrong side of the trade. Retail traders chase the move, while smart money sells into their buying, or buys into their panic selling.
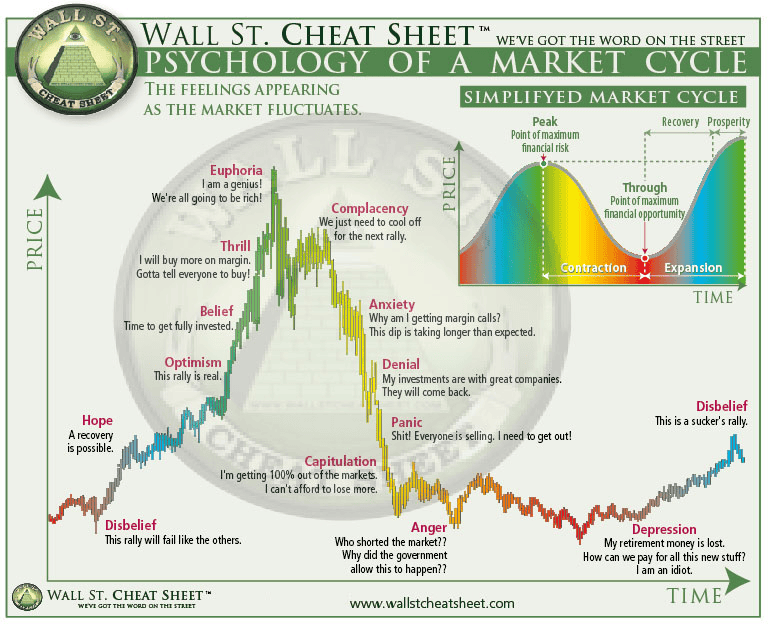
This influence is well documented in the classic Market Cycle of Emotions, where traders pass through phases like euphoria, denial, panic, and despair. Smart money uses retail market sentiment to their advantage, and buy when retail is selling (panic or despair phase), or sell when retail is buying (thrill, euphoria, complacency stages).
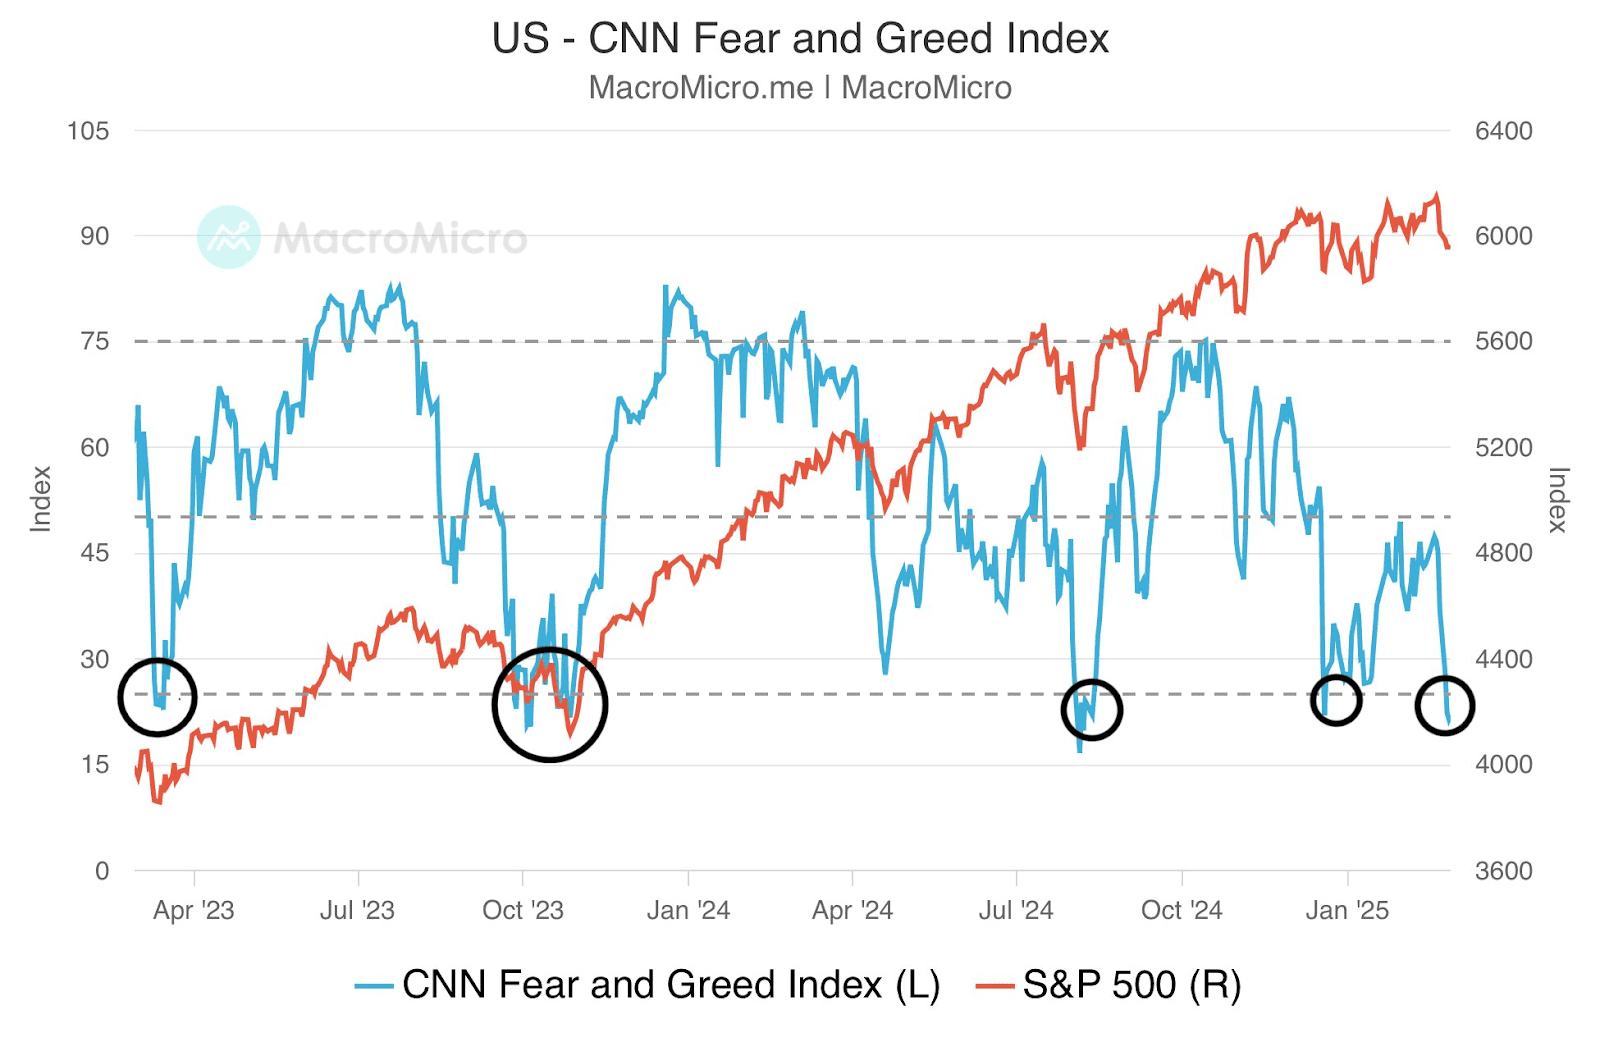
You can also see this dynamic reflected in tools like the Fear & Greed Index. At major market tops, readings often hit extreme greed. At bottoms, they plunge into extreme fear.
Think about the last time you saw these readings. Didn’t the market often reverse shortly after?
This MacroMicro.me chart shows that when the Fear & Greed Index hits extreme fear levels (circled), the S&P 500 often finds a bottom or begins to stabilise shortly after. These moments reflect how sentiment extremes can coincide with smart money accumulation.
By understanding how smart money sets traps and absorbs liquidity, retail traders can learn to anticipate rather than follow. SMC helps visualise these traps on the chart — giving retail traders a way to align with institutional flow, rather than fight a losing battle against it.
How Does the Smart Money Concept Work?
SMC traders believe that when institutions move markets, they leave behind clear patterns in price action. These patterns not only signal potential entries but also reveal the strength of supply or demand zones and broader market intent.
There is a whole suite of these patterns, so let’s break them down one by one:
Order Blocks
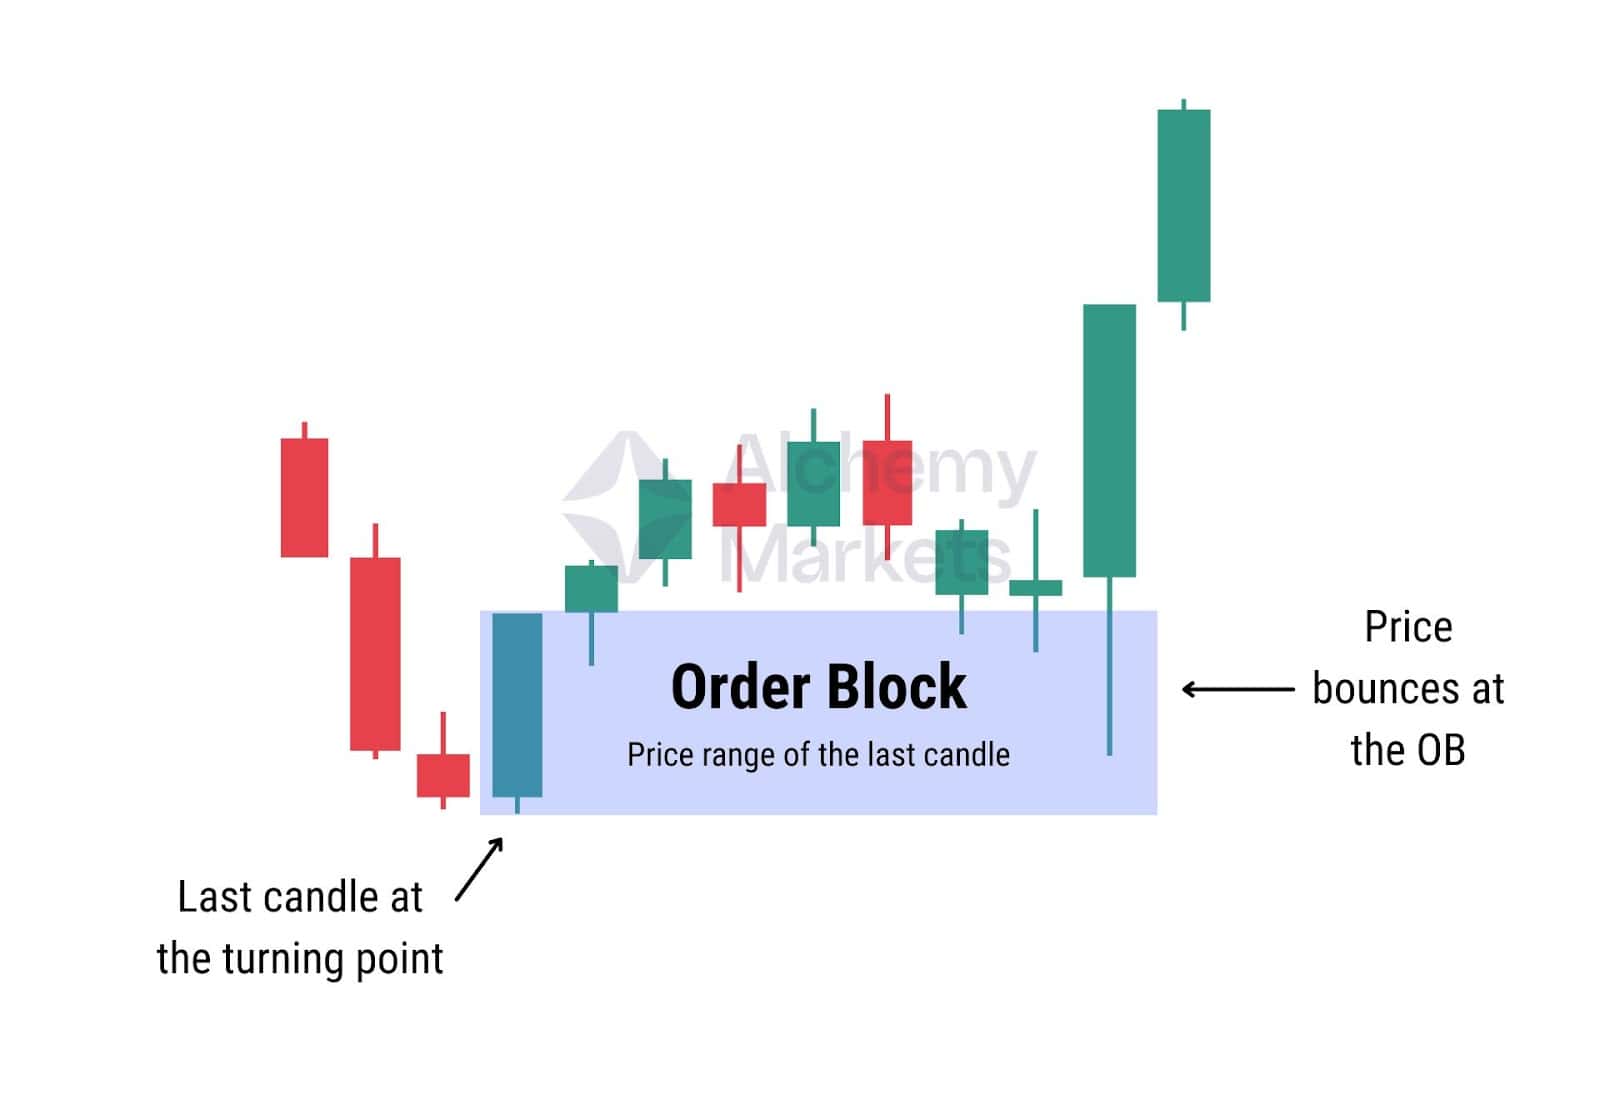
Order blocks (OB) in SMC are refined support and resistance zones, defined by the last candle before a clear trend reversal.
The full range of that candle, including wicks, becomes a key level for future price interaction:
- In an uptrend, the OB is the candle with the lowest low before price moves higher.
- In a downtrend, it’s the candle with the highest high before price drops.
The color of the candle is irrelevant; what matters is its position relative to the pivot. For instance, in the example above, the bullish candle forms the OB because it has a deeper wick, marking the true low before the reversal.
Breaker Blocks
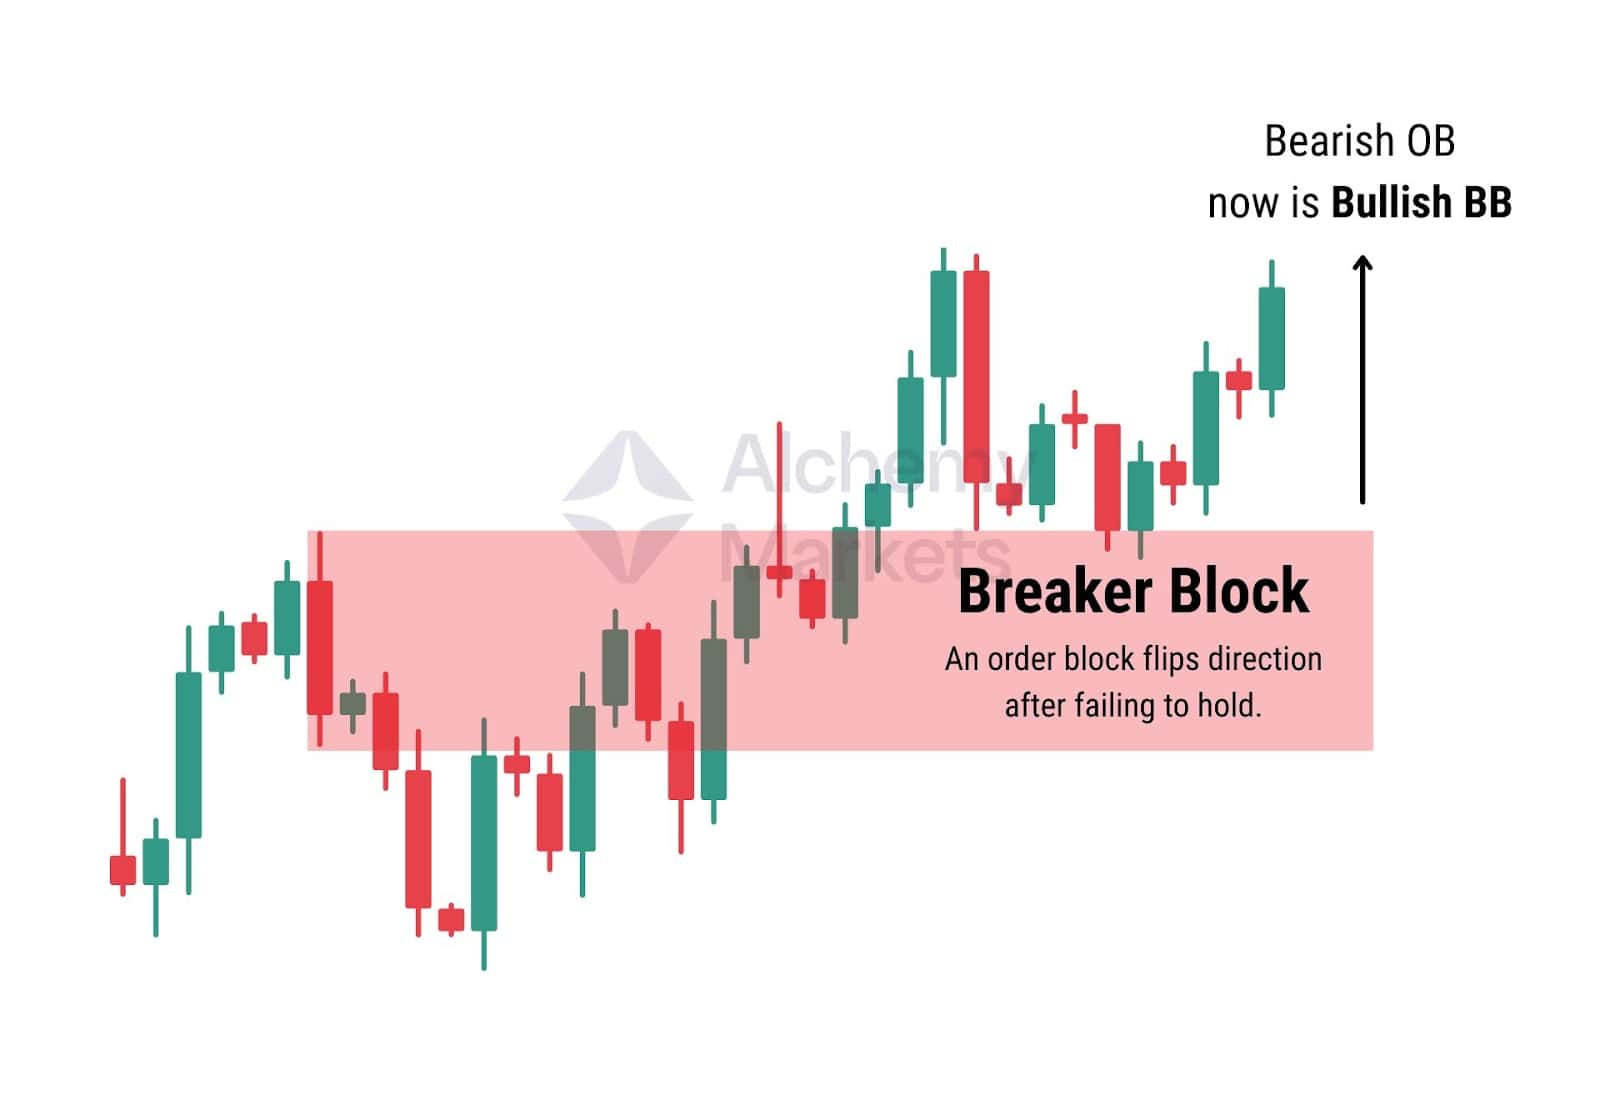
Breaker Blocks (BB) are former order blocks that fail to hold, meaning that the price has broken through with strength. When this happens, their role reverses. For instance, support becomes resistance, or resistance becomes new support.
The direction of the break determines the type:
- A bearish OB broken to the upside becomes a bullish breaker block.
A bullish OB broken to the downside becomes a bearish breaker block.
These zones often act as strong reaction levels on retests, signaling institutional repositioning.
Fair Value Gaps (FVG)
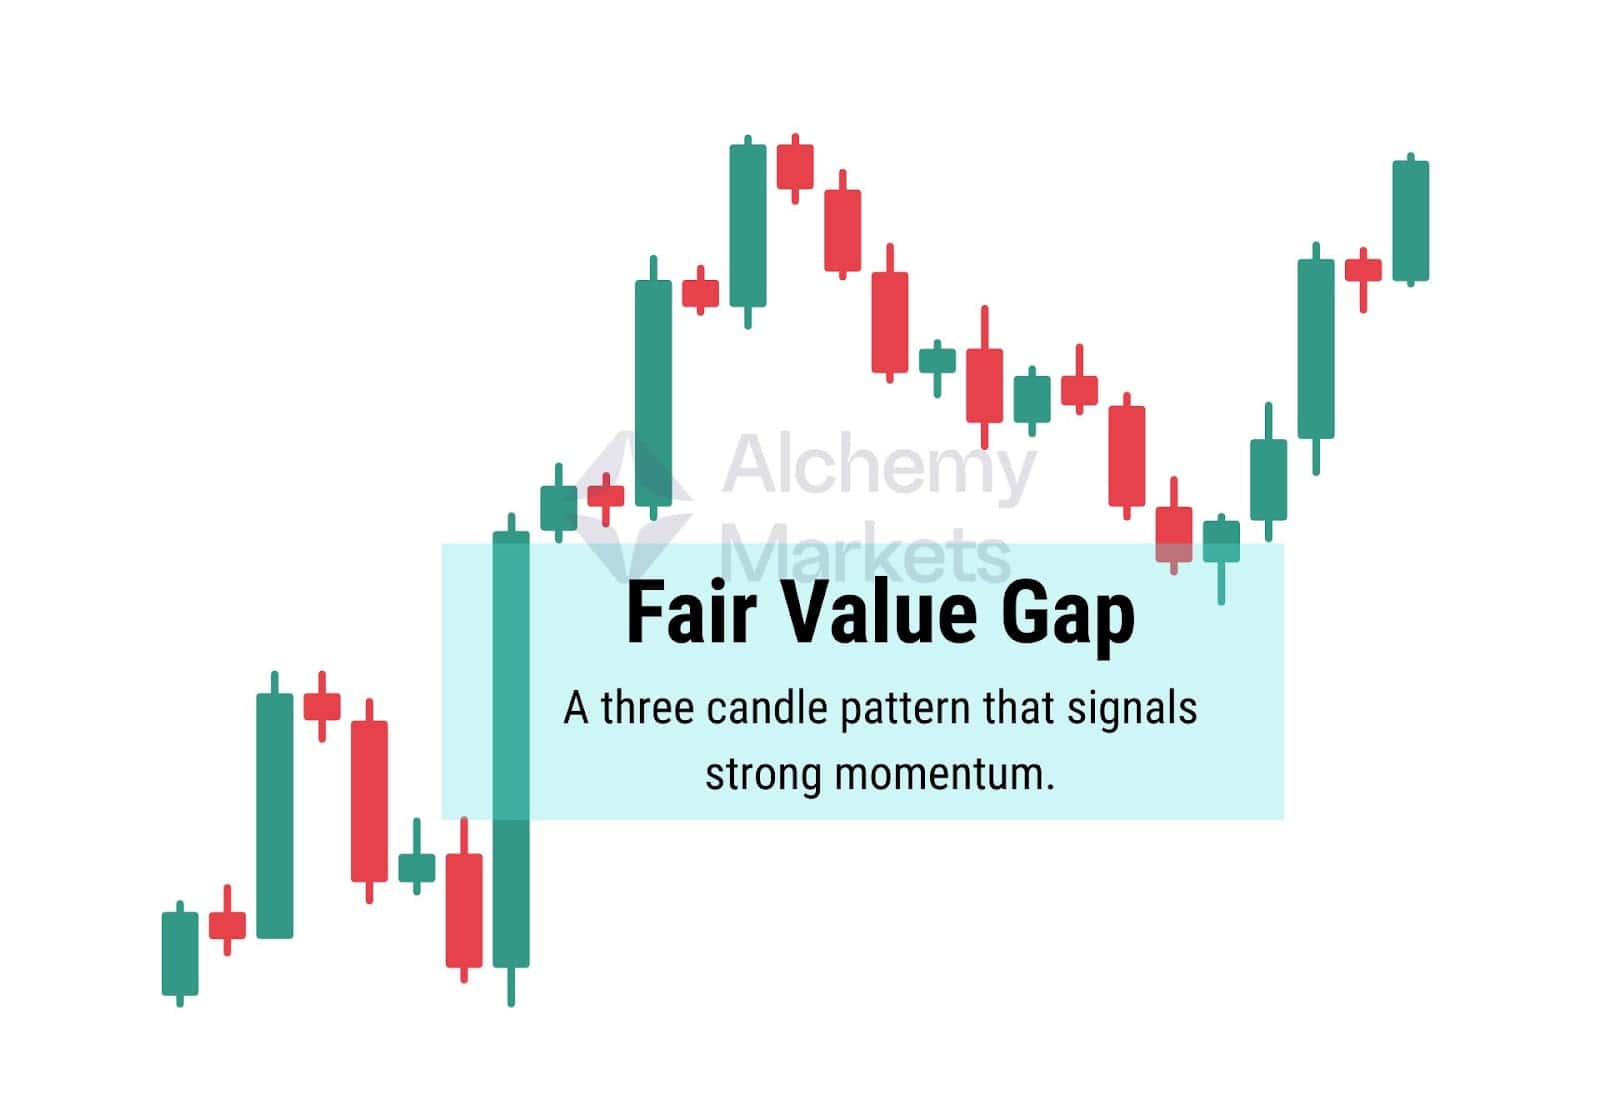
Fair Value Gaps (FVGs) are three-candle formations that highlight moments of imbalance caused by sharp institutional moves. A gap forms when the middle candle’s range doesn’t fully overlap with the candles on either side.
SMC traders treat these gaps as zones of unfilled orders or inefficiency. Prices tend to return and test the gap like a support or resistance, often providing a reaction and continuing the direction of the breakout.
Key characteristics of FVGs:
- They signal momentum and displacement.
- The gap zone acts as a magnet for price.
- Reactions at FVGs can offer clean entry points in trending conditions.
FVGs are often used in confluence with other SMC tools, fibonacci retracements, and market structure — giving traders an edge in identifying smart money intent.
Break of Structure (BOS)
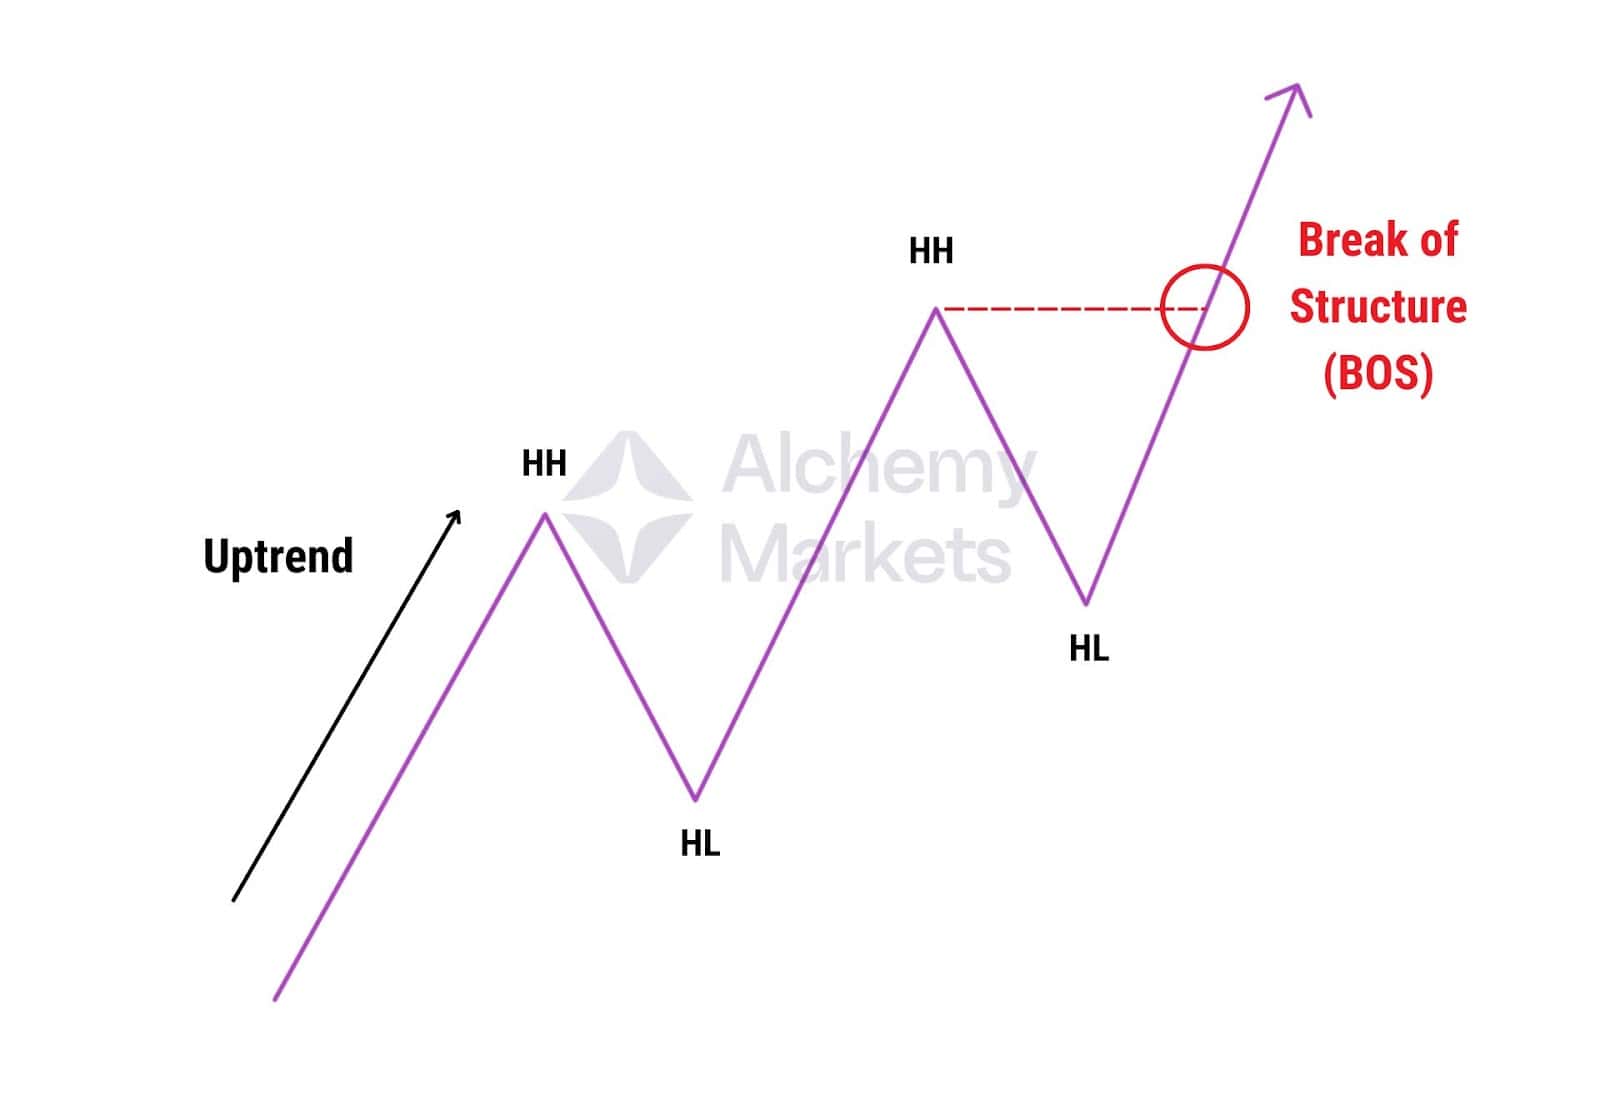
Break of Structure (BOS) indicates that the market is continuing in the direction of the current trend by breaking a key structural level.
It confirms that buyers or sellers are remaining in control:
- In an uptrend, a BOS occurs when price breaks above a previous high, forming a Higher High (HH).
- In a downtrend, a BOS happens when price breaks below a previous low, forming a Lower Low (LL).
Unlike a CHoCH, a BOS confirms that the prevailing trend remains in control. It signals continuation, not reversal.
Change of Character (ChoCH)

Change of Character (ChoCH) signals a potential trend reversal by breaking structure in the opposite direction of the current trend.
It signals a shift in control:
- In a downtrend, a ChoCH occurs when price breaks above a previous high, forming a Higher High (HH).
- In an uptrend, it happens when price breaks below a previous low, forming a Lower Low (LL).
Most importantly, ChoCH is an early signal, not confirmation. It does not wait for a full structural shift to form (i.e. a higher low to form after a higher high in a downtrend), making it a leading indicator for possible reversals.
Liquidity
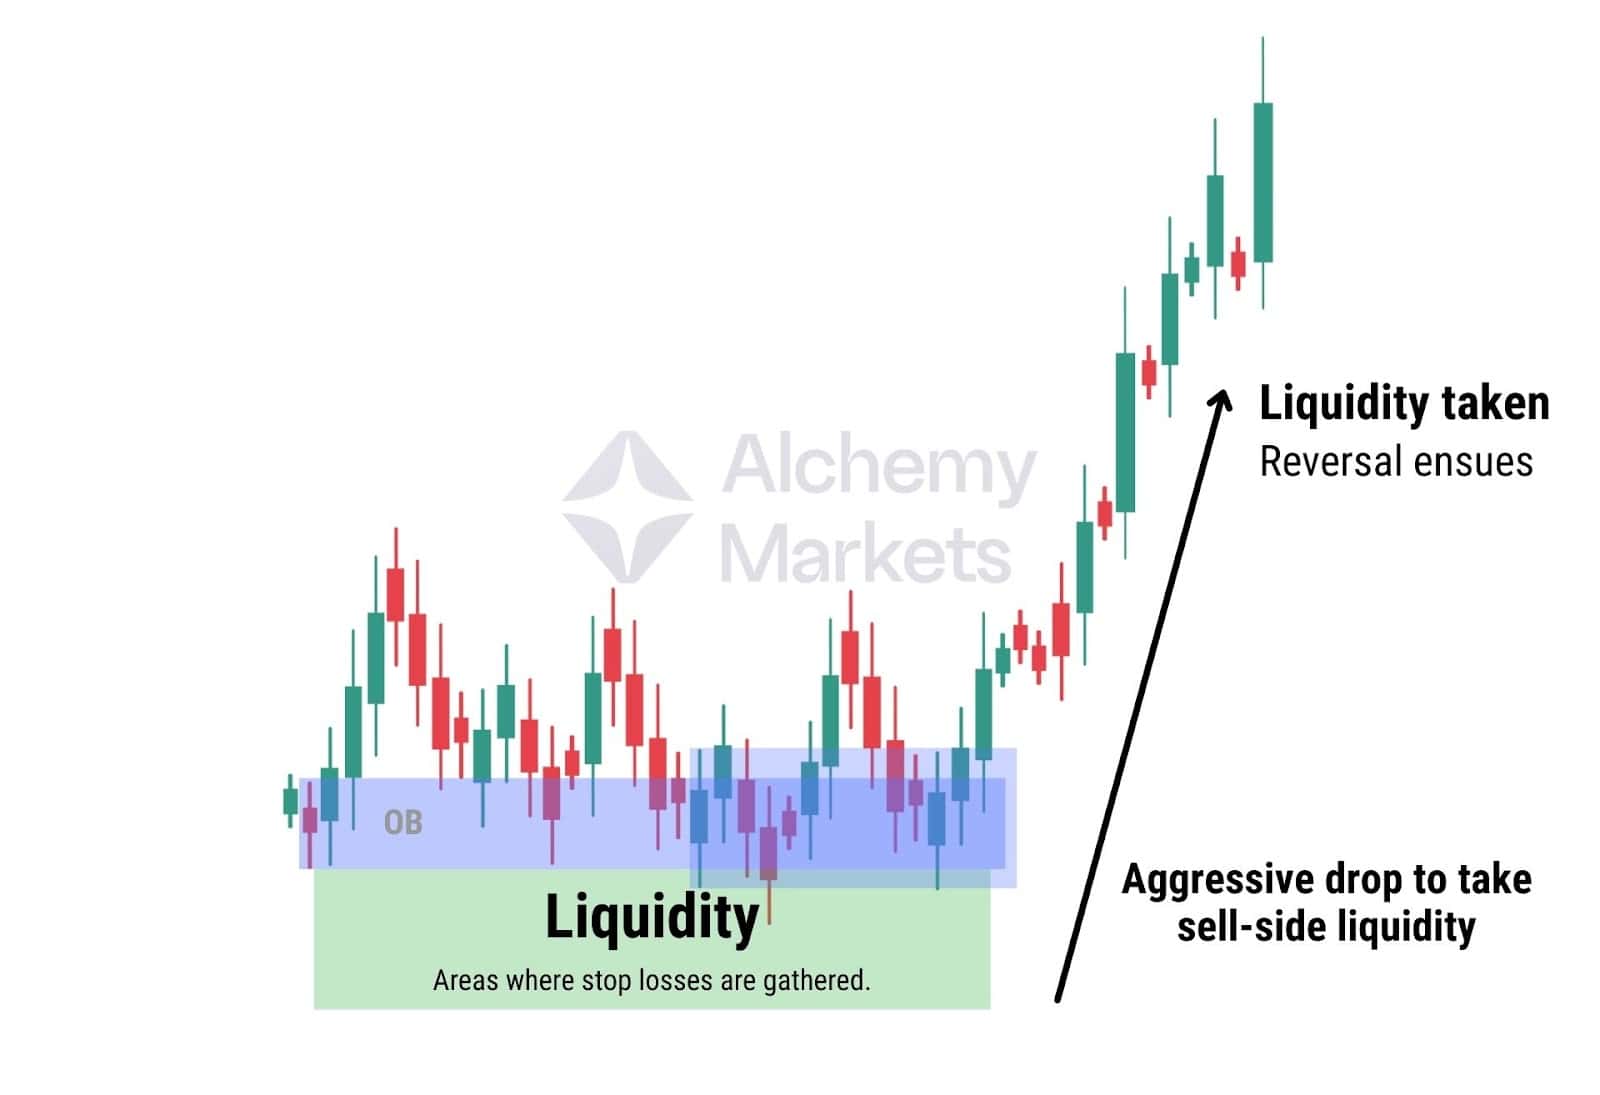
Liquidity refers to areas on the chart where clusters of orders are likely to sit — typically just above swing highs or below swing lows. These zones often attract Smart Money, as they provide the fuel needed to enter large positions.
The easiest liquidity zones to identify are equal highs and equal lows, which hint at multiple stop losses building up at the same level. When price dips below equal lows (or spikes above equal highs), it triggers these stops, offering liquidity for Smart Money to buy or sell.
According to Smart Money Concepts (SMC), price often hunts these zones before making its true move. When price spikes into liquidity and sharply reverses, that’s called a liquidity sweep — a clear signal that Smart Money has filled its orders and the market is primed to reverse.
Shift of Market Structure (SMS)
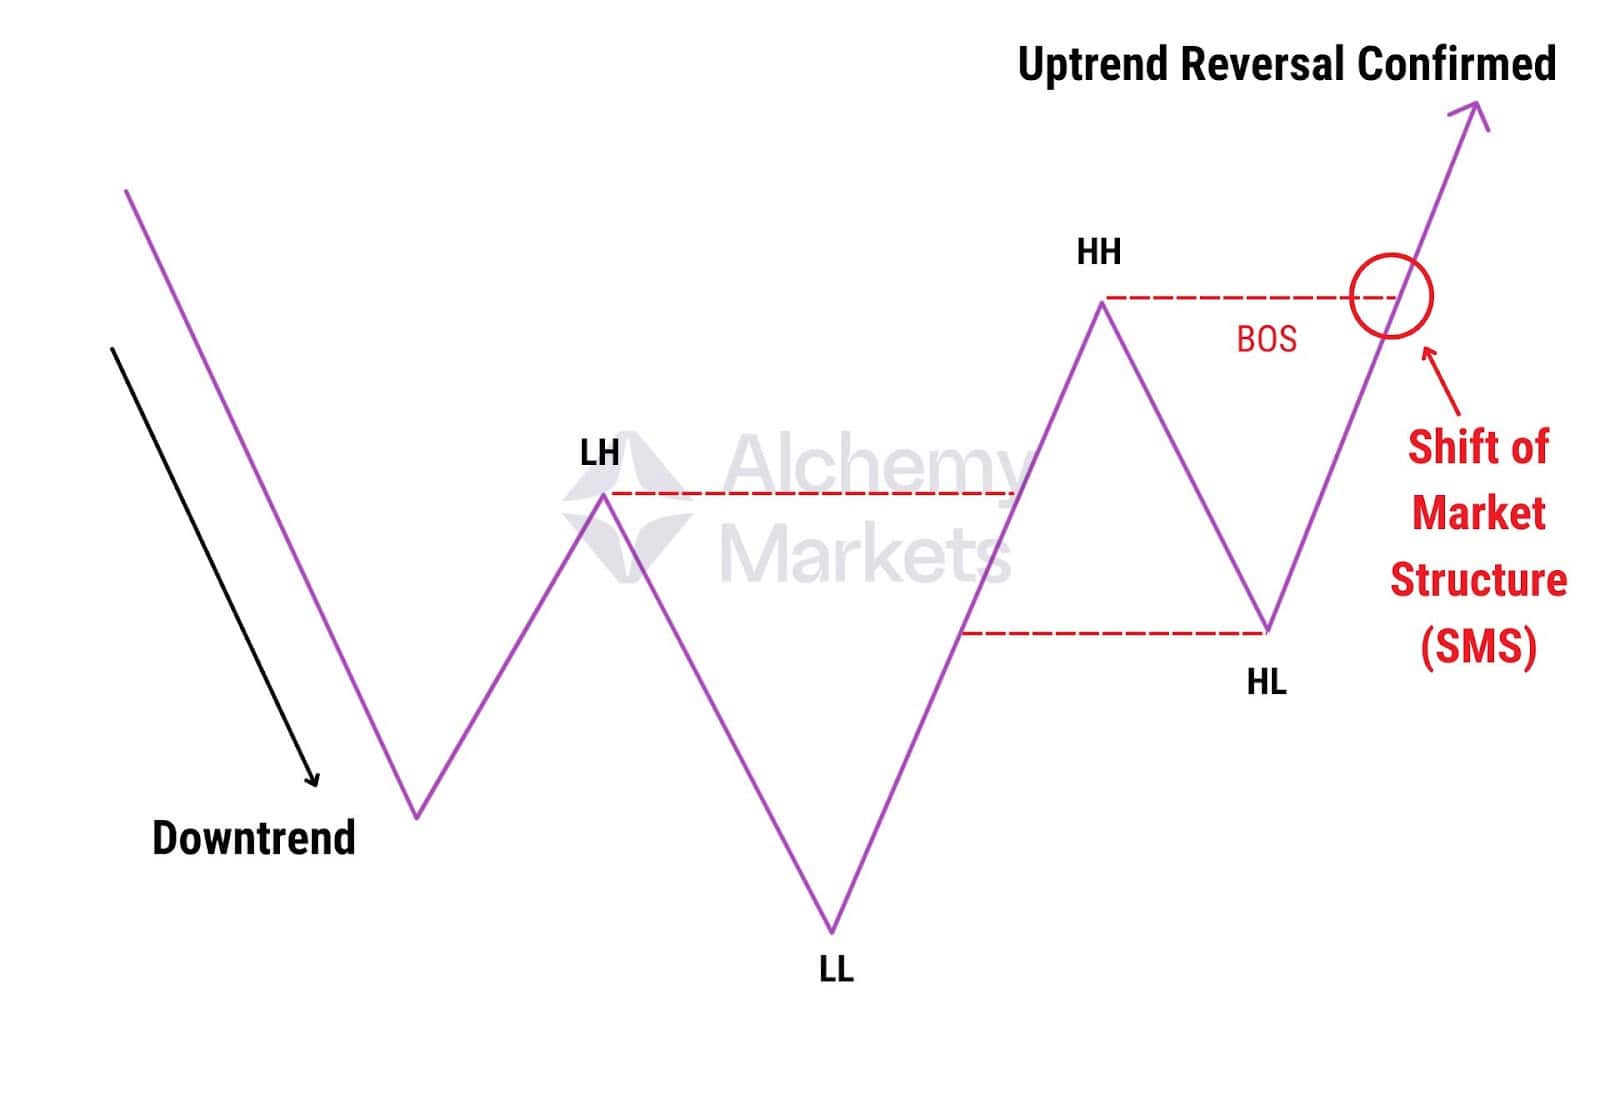
Shift of Market Structure (SMS) signals a confirmed trend reversal by showing a full structural change in direction. This includes a break of the previous high or low, followed by a second pivot that does not break the new trend.
It signals when market trends have flipped:
- In a downtrend, Smart Money Shift (SMS) is confirmed when price forms a Higher High (HH), pulls back into a Higher Low (HL), and then breaks structure with another move higher.
- In an uptrend, SMS is confirmed when price forms a Lower Low (LL), retraces into a Lower High (LH), and breaks structure with another leg down.
Unlike a Change of Character (ChoCH), which hints at a possible reversal, SMS marks a confirmed trend shift — anchored by three pivot points and a decisive Break of Structure (BOS). It signals a clear change in intent from Smart Money, especially after an extended trend.
Smart Money Concept Example
When used in technical analysis, SMC can help traders find logical points of entry, as well as gain deeper insights into market conditions.
It isn’t necessary to blend all elements of SMC into your trading; some traders only focus on order blocks, while others prefer using Fair Value Gaps with Fibonacci tools. But together, Smart Money Concepts do an excellent job of finding and confirming multiple entries.
For instance, let’s take a look at this NZD/JPY weekly chart.
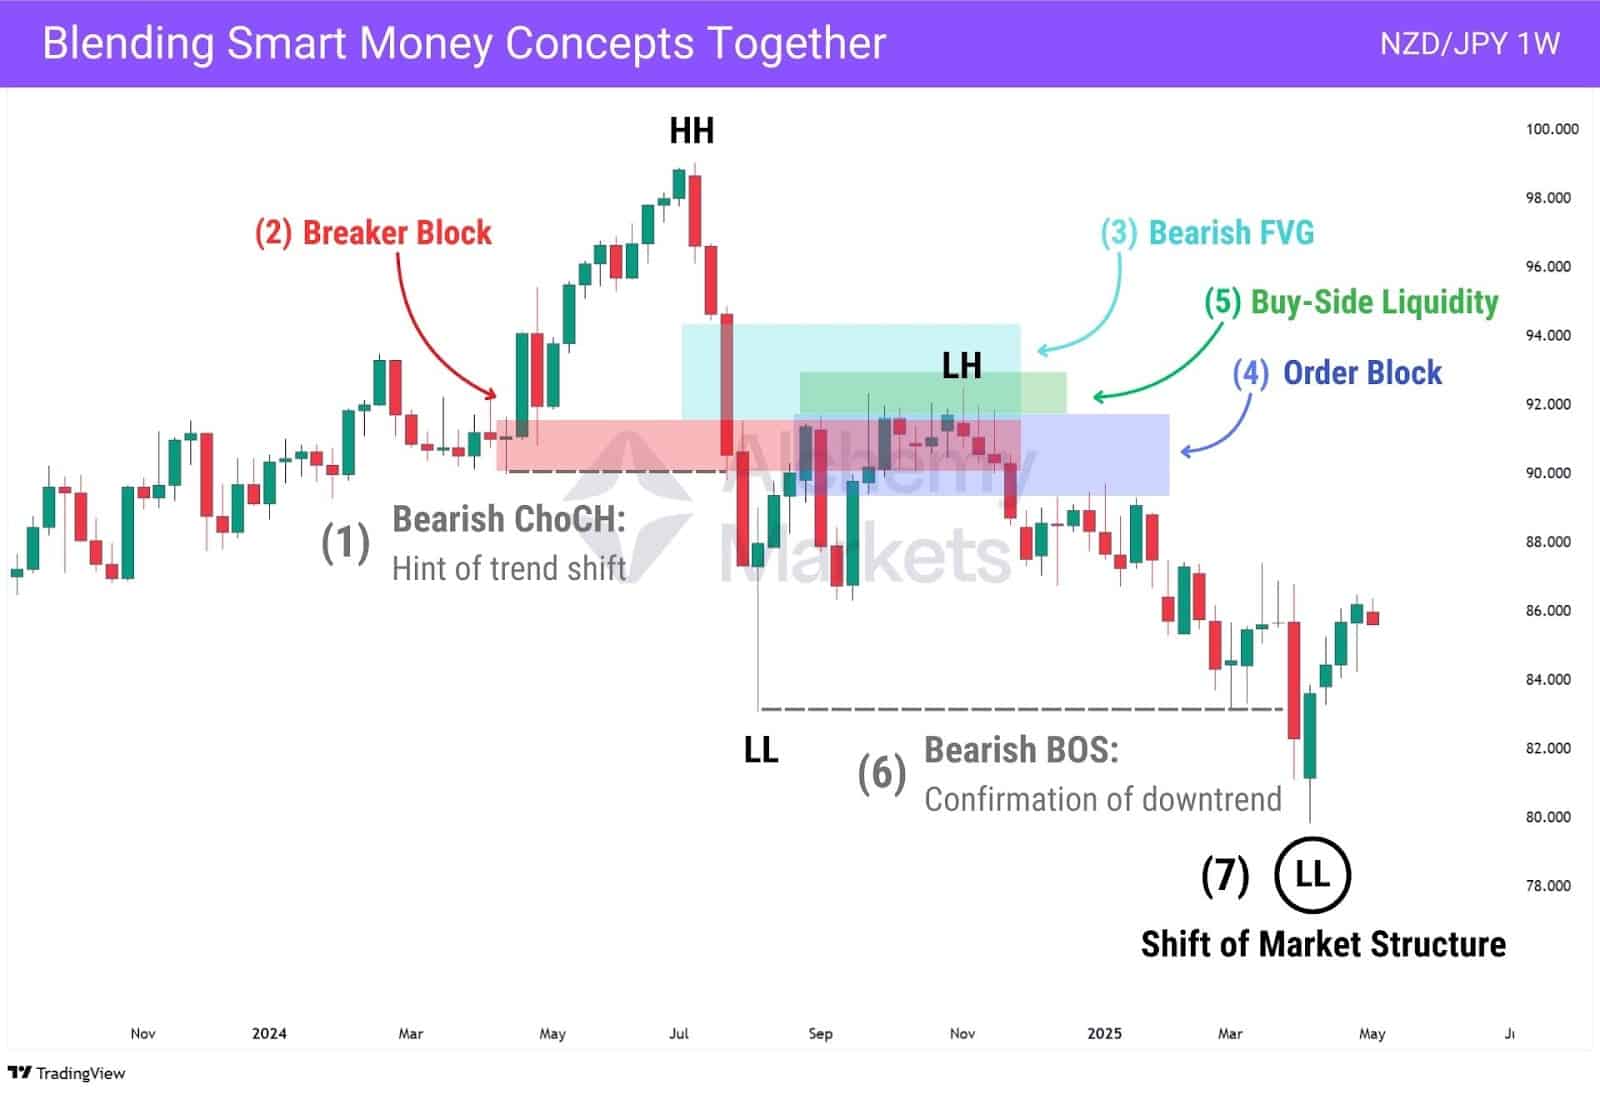
Notice how we had a breakdown of an uptrend, that quickly became a downtrend. With SMC, there were actually multiple confluences we could have used to confirm a short entry, at multiple points in the chart.
So let’s break it down:
Bearish ChoCH – First sign of a potential trend shift as price breaks a minor low, creating a lower low.
Breaker Block – Once an order block, the sharp move has broken it to the downside, changing it to a bearish breaker block.
Bearish FVG – A sharp move downward leaves an imbalance on the chart, as sellers enter aggressively and leave unfilled sell orders in the gap.
Order Block – The price retraces, but pivots again to the downside. The final candle of this retracement creates an order block.
Buy-Side Liquidity – Price forms an order block, likely attracting short stop losses above it — turning the area into a prime liquidity target.
Bearish BOS – After sweeping the liquidity (aligns with the OB, BB, and FVG), the price breaks below its new low.
Shift of Market Structure – Lower Low forms, validating the full transition into a downtrend.
Smart Money Concept Trading Strategies
Identifying SMC Opportunities
These strategies aim to spot where Smart Money has manipulated price to engineer ideal entry points — using tools like order blocks, fair value gaps, and structural shifts.
Let’s recap quickly what each SMC tool does:
| SMC Tool | Description |
| Order Blocks | Refined support and resistance zones, based on where price previously had pivoted. |
| Breaker Blocks | Failed order blocks that could not hold as a support or resistance zone, flipping its role. |
| Fair Value Gaps | Areas where imbalances are, acting as a magnet for the price to return to and continue its trend. |
| Buy-Side Liquidity | Zones where a cluster of short stops or liquidations are likely located. |
| Sell-Side Liquidity | Zones where a cluster of long stops or liquidations are likely located. |
| Break of Structure (BOS) | A continuation signal that can be used to confirm a trade idea, or add strength. |
| Change of Character (ChoCH) | An early trend reversal signal, but isn’t a full confirmation by itself. |
| Shift of Market Structure (SMS) | A full confirmation that the trend has reversed. |
With that refresher out the way, let’s dive straight into some use-cases for them.
Large transactions
Institutions avoid market orders for large trades to prevent moving the market while filling positions. So instead, institutions seek out liquidity via stop hunts, imbalances, and traps — places where Smart Money can more easily fill large orders.
Fair Value Gaps highlight areas where Smart Money has aggressively entered the market, creating clear imbalances. Therefore, if a FVG forms at a key order block or breaker block, it confirms that smart money is stepping in, and gives traders a much more logical point of entry.
Let’s examine an example on Gold’s daily and hourly chart.
First, we’ll examine the order blocks, breaker blocks, fair value gaps, and liquidity zones on the Daily Chart. This tells us where potential support and resistances are, and where to look for a price reaction.
Then, we’ll zoom into the hourly chart to find Fair Value Gaps when the price tests a HTF order block, breaker block, FVG, or liquidity zone. The presence of a FVG tells us that price is reacting with strength to the HTF key level.
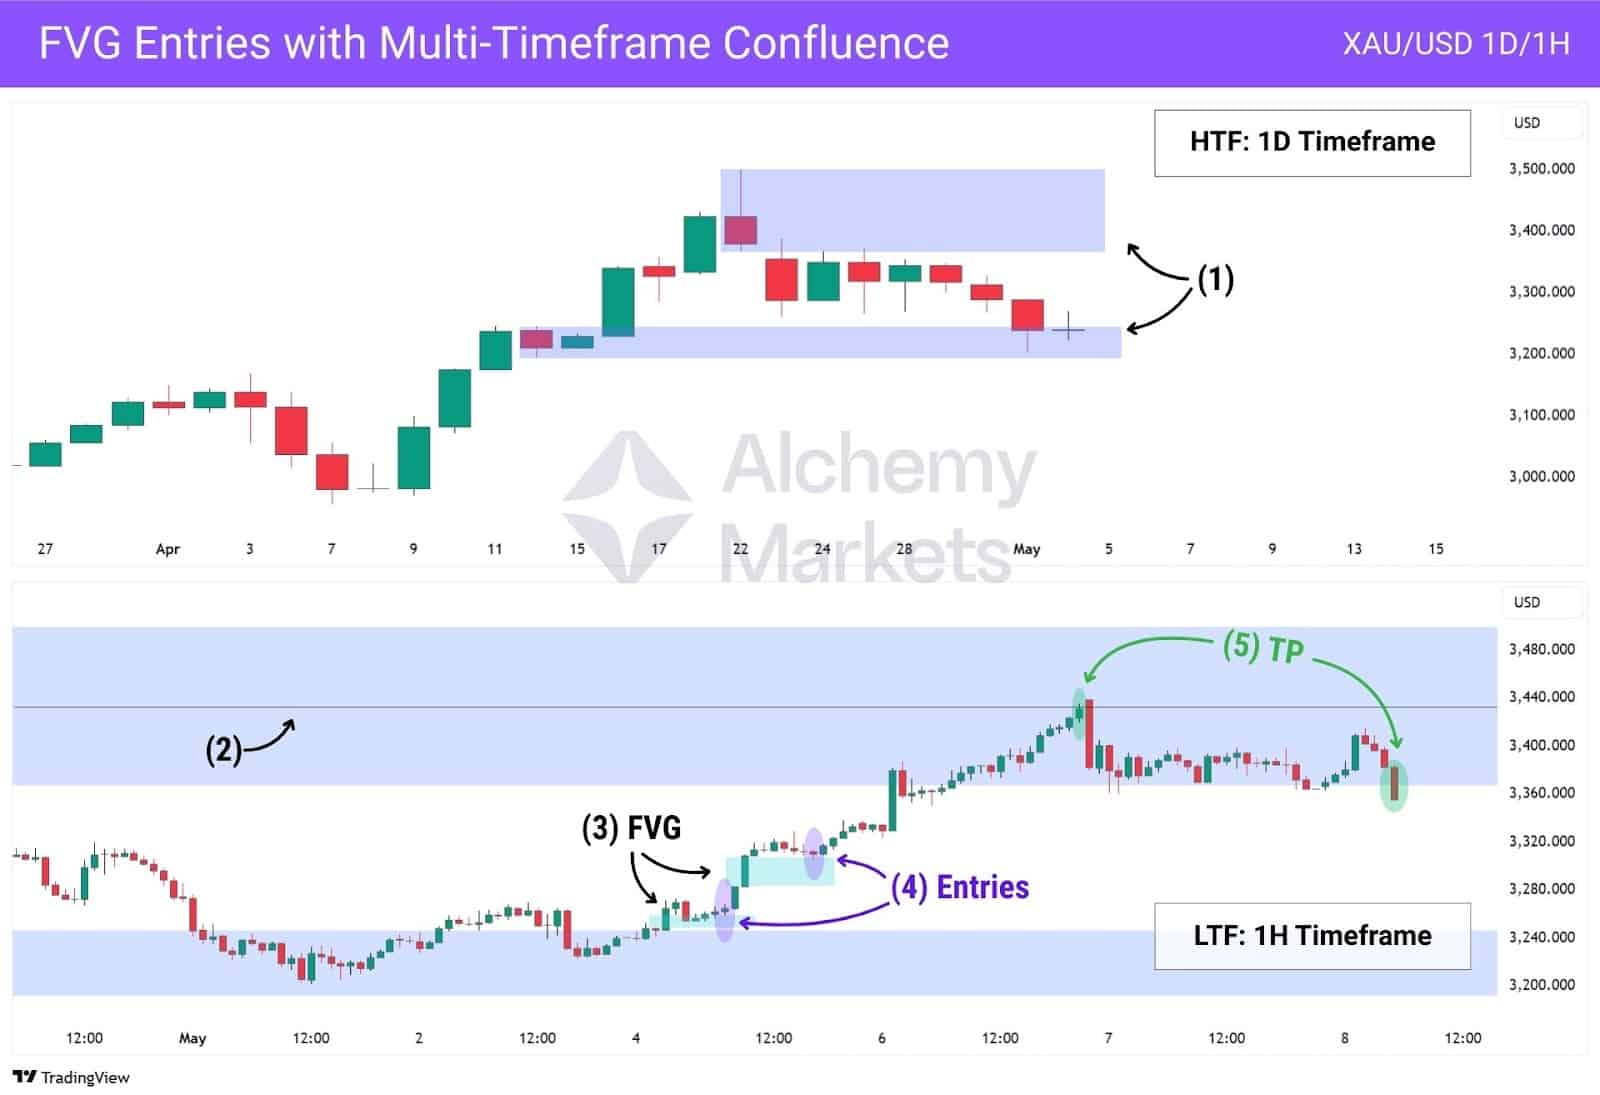
Step by Step for the Multi-timeframe FVG strategy:
- On the HTF, mark out Order Blocks or Breaker Blocks that can act as support or resistance.
- Then, mark the 50% midpoint of the support/resistance (SR) block that we’ll be targeting. When going long, target the OB/BB above the current price.When going short, target the OB/BB below.
- When price tests the HTF block as a pullback, visit the LTF to identify Fair Value Gaps.
- Enter a position when the price tests the FVGs, and shifts out in the direction of the FVG — signalling continuation.
- Take profit when the price tests the 50% midpoint of the SR block, or, alternatively wait for a break of the SR block (against the direction you’re trading).
FVGs can be traded in many ways, as we’ve documented in this Fair Value Gaps trading guide — but if we’re just simplifying down to using SMC tools, a powerful technique is to use timeframe alignment.
This means first spotting an order block or breaker block on a higher timeframe (HTF), then going down to a lower timeframe (LTF) to notice if an FVG forms at the HTF area. When this happens, our FVG is both a confirmation and key zone that can be traded.
Nuances to keep in mind for trading this strategy:
You could mark out the liquidity zone beyond the HTF order blocks or breaker blocks. If a liquidity sweep happens and price recovers quickly, this allows you to stay ready for a trade in the event of a false break.
Additionally, you could use concepts such as Break of Structure (BOS), Change of Character (ChoCH) to enhance your overall trade signal. For instance, if a FVG occurs with a BOS or ChoCH, and reverses from the OB/BB, it acts as a powerful signal.
| Recommended Timeframe Groups | |
| HTF | LTF |
| Weekly | 4H |
| Daily | 1H |
| 4H | 15m |
| 1H | 5m |
| 15m | 1m |
Insider Buying — Institutional Footprint on the Chart
Another core teaching of Smart Money Concepts is that market makers often trade with insider knowledge, executing large positions in a way that catches retail traders off guard. One of the most telling signs is when price breaks a significant low (or high), only to quickly reclaim it. This behaviour is known as a liquidity sweep, and it often signals institutional accumulation or distribution.
In the case of insider buying, the move resembles a sell-side liquidity sweep, where price briefly dips below key levels — such as an order block — to stop out long positions or trigger breakout shorts. This engineered liquidity gives institutions the counterparties they need to enter large buy orders.
Let’s take a look at this weekly S&P 500 (SPX) chart.
Notice how the price completely ignored traditional support and resistances such as the Fibonacci 50% and 61.8% retracement levels, then failed to tap the 78.6% level too. A trader who isn’t using SMC may be stopped out or fail to anticipate such a move.

However, traders well versed in SMC will understand that the price retested a bullish breaker block, and tapped into the liquidity zone of the order block — sweeping the liquidity and triggering a cluster of stop orders.
This gives Smart Money the chance to buy en masse and shift the price out in its true direction, giving SMC traders an entry when the price closes above the Order Block, or even when it retests the Fair Value Gap formed higher above.
Places with Strong Growth Potential
Smart Money naturally prefers to build positions in assets with long-term upside. The more they’re active in a market, the more reliable SMC setups become.
Here are some methods to consider:
- Pay attention to assets that constantly pop up in the news (i.e. Gold, Bitcoin, Nvidia).
- Notice news that affect sectors, such as increased subsidies for tech companies, or sanctions on oil production etc.
- Track ETF inflows to see institutional accumulation.
- Use tools like Finviz or Bubble Screener to find sectors or assets that are gaining traction.
Another method to consider is to look at how some sector ETFs or indices are performing. Then, apply SMC analysis onto the chosen index or ETF to develop a trading plan.
For stocks, you could examine the ‘XL’ charts, which are sector ETFs. For crypto, you could examine BTC.D (Dominance), versus TOTAL2 (Crypto market cap excluding Bitcoin) and TOTAL3 (Crypto market cap excluding Bitcoin and Ethereum).
Let’s look at an example below.
Here, we’re comparing sector ETFs for the U.S. stock market on the daily timeframe to identify the strongest performer in recent days.
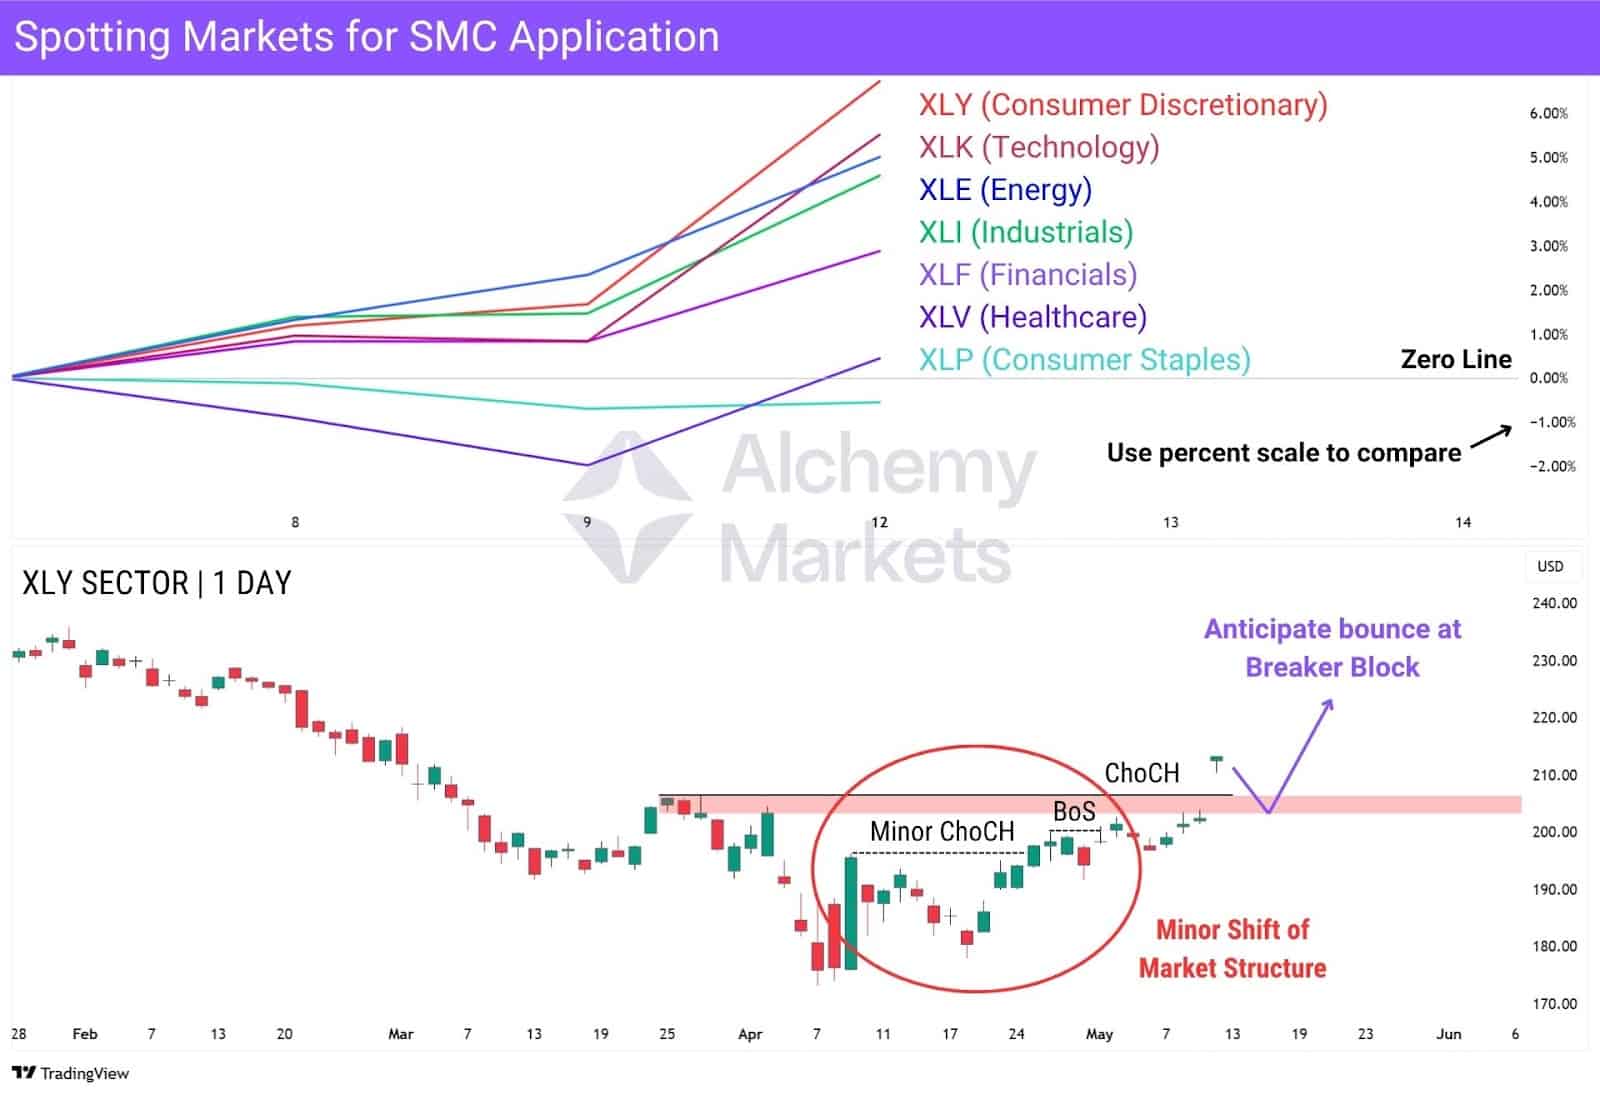
Notice how XLY has outperformed the other sectors in recent days?
Therefore, we’ll keep an eye on it for the coming days.
Using Smart Money Concepts, we are able to notice a SMS (shift of market structure) from the lows, indicating a potential larger bullish reversal. Additionally, the price has formed a Breaker Block, giving us a clear point to look for a long entry, on one of the stocks, when the XLY ETF revisits its breaker block.
Long-Term Investment Horizon
Institutions don’t move in and out of the market in a day. They build positions gradually, especially in sectors with strong growth potential and long-term upside. You can first identify a strong sector, then look at stocks with larger market capitalisation within that sector to zero in on what Smart Money is likely to be accumulating.
When Smart Money apply long-term investment accumulation, they leave behind footprints in the chart. This is where you can apply technical analysis using SMC.
Look for these SMC patterns after a steep decline:
- Bullish breaker block, which usually comes with a ChoCH, or SMS.
- Consolidation at an order block, refusing to break lower.
- Bullish Fair Value Gap, which signals institutional buying at speed.
Fundamental Analysis
Fundamental analysis is the practice of using global news, earning reports, and economic announcements (such as interest rate decisions) to set your bias. In SMC, however, they are seen as lagged indicators that usually lead to bull or bear traps.
SMC traders operate on the idea that: Institutions have early access to news before the general public. This allows them to position themselves way before the news goes public, and also set traps in advance.
Earnings reports, rate decisions, or economic data often create large wicks or dojis. These moves aren’t random — they’re engineered to fill institutional orders through stop hunts and liquidity grabs.
Consider this example of a news catalyst trap:
AAPL releases a positive earnings report, only for the price to plummet for the next four days, then recover.
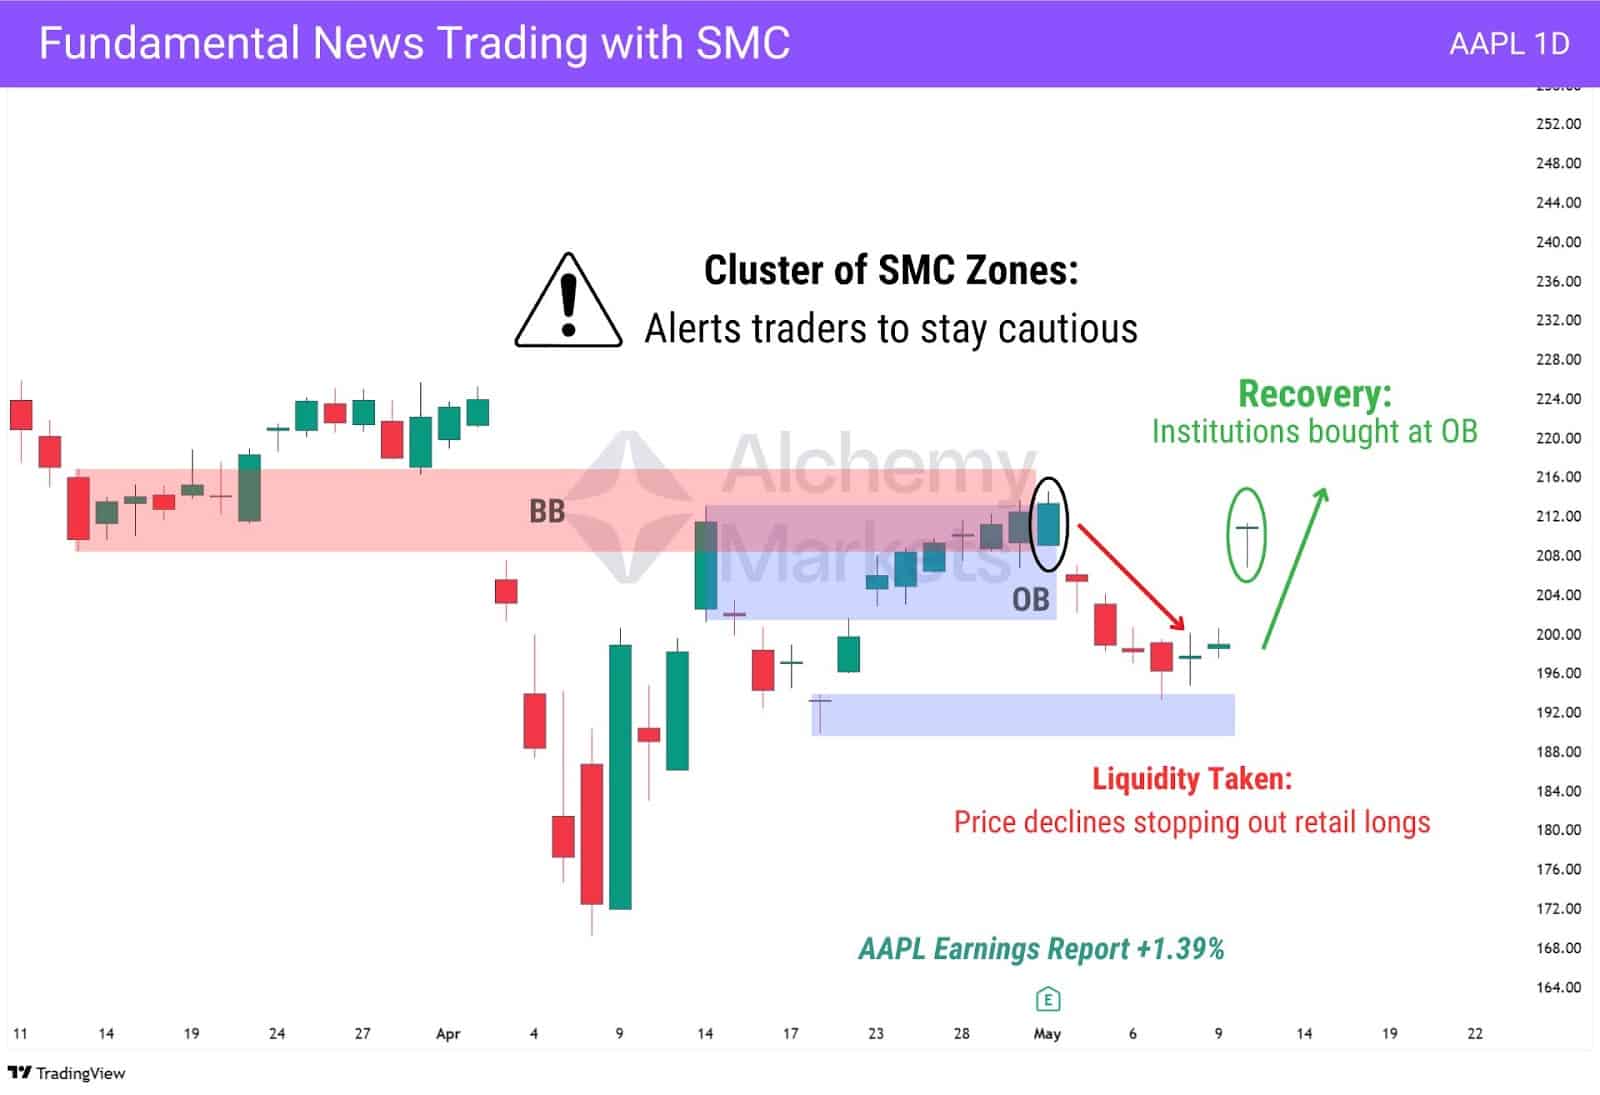
SMC traders discover a cluster of resistances right above the current price, influencing them to remain patient until the current OB is broken, then retested as a BB.
The result? The bullish scenario did not happen. Price retraced to a lower OB before bouncing back into resistance again.
Using SMC, retail traders can look for order blocks, breaker blocks, liquidity zones, and fair value gaps to find key areas to trade. This helps them avoid getting trapped by institutional activity, right after a news catalyst event.
Tracking SMC
Tracking smart money isn’t just about reading charts—public data like government filings can also provide valuable insights into institutional positioning and market bias.
CFTC Filings (COT Reports)
The CFTC (Commodity Futures Trading Commission) releases weekly COT (Commitments of Traders) reports that reveal how major participants are positioned in futures markets. This includes:
- Commercials – Considered as the Smart Money, these are hedgers who take the opposite side of speculation.
- Non-Commercials – Large speculators, such as hedge funds and commodity trading advisors, but have weaker buying/selling power than hedgers.
- Non-Reportables – Retail traders, who have no sway in the markets.
The report shows net exposure, calculated as long positions minus short positions for each group.
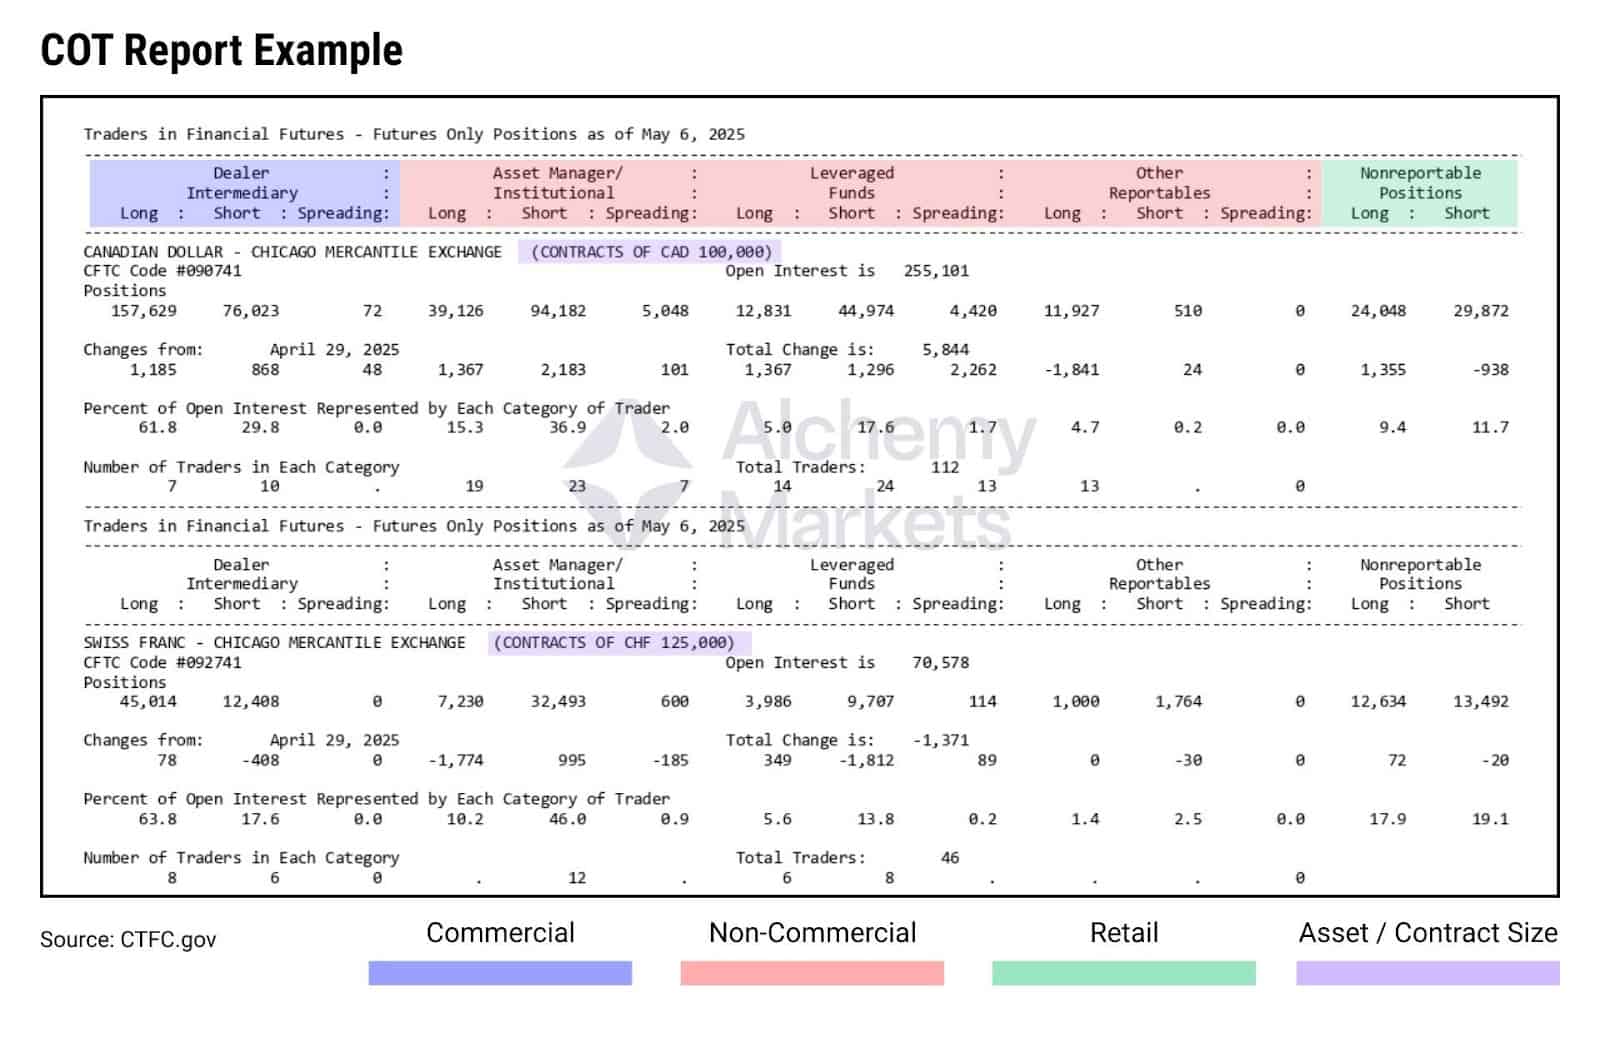
You can find weekly COT reports like this at CFTC’s official government page, which are helpful in gauging future price movements.
As you can see, COT reports can be rather complicated for the untrained eye to read, or even spend time to break down. Professional traders, however, would be trained and paid to analyse these reports, giving them an edge. Fortunately, there are custom indicators on some platforms to visualise COT data, allowing SMC traders to anticipate major reversals and traps set by Smart Money.
With this in mind, SMC traders can:
- Look for reversals at significant Order Blocks, Breaker Blocks, or Fair Value Gaps.
- Keep an eye out for liquidity grab/sweep reversals — a clear sign of institutional behaviour.
If you look at COT data side by side with a futures chart, it can give traders an edge in anticipating reversals, even if they’re trading other derivatives such as CFDs.
To illustrate, observe this USD/JPY futures chart across 2024:
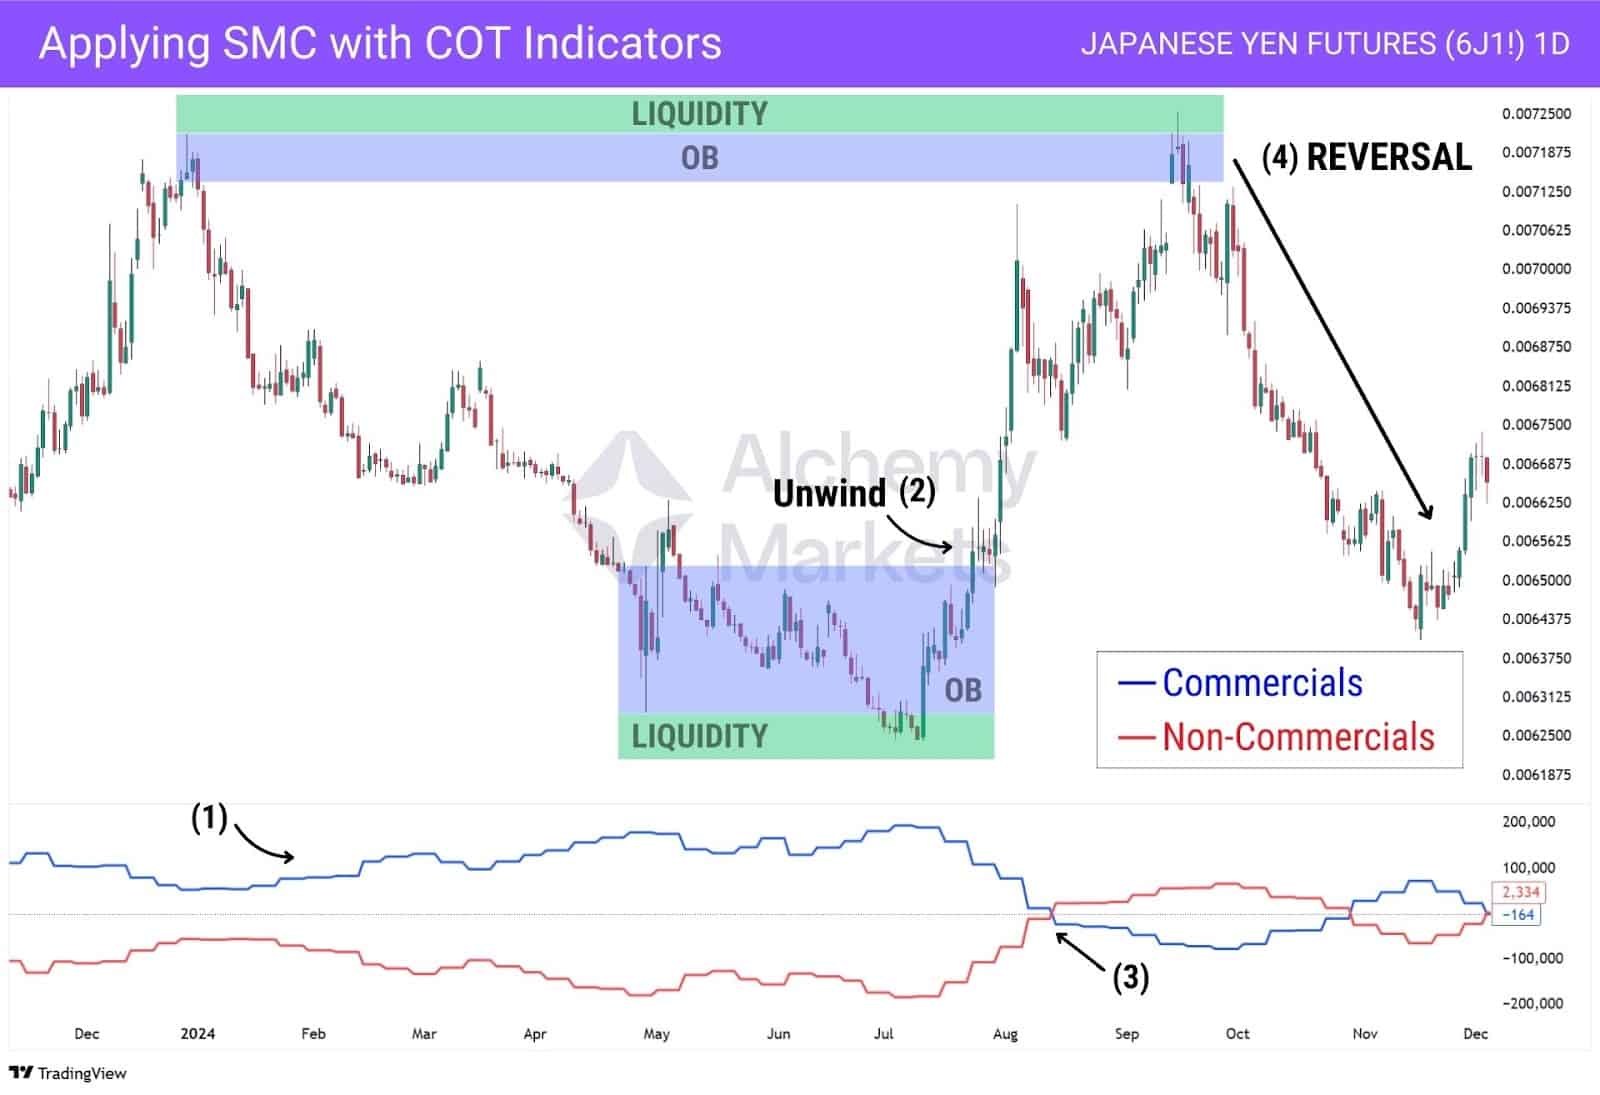
Early in the year, Commercials increased long exposure while Non-Commercials held firm on shorts. As price reached a major liquidity zone, Smart Money completed their accumulation.
A rally followed, but the reversal didn’t fully develop until months later, after Non-Commercials flipped long and got caught in the trap. This is how Smart Money operates. They wait, they build, and when positioning is stretched, they unwind the market into a reversal.
Step-by-step breakdown:
- Commercials are building long positions as the price trails lower, while non-commercials are piling into shorts.
- The price begins to reverse after a liquidity sweep, causing non-commercial positions to unwind.
- Non-Commercials begin to flip long as commercials begin to flip short.
- The price reverses at a major order block, unwinding non-commercial long positions.
For SMC traders, COT data strengthens the case for a reversal when price reaches key Order Blocks or Breaker Blocks, helping confirm bias with positioning context.
Volume Analysis (Volume Indicator)
Volume is most useful when used as a final layer of confirmation, not the first signal. It helps distinguish between true institutional moves and retail traps. When a volume spike (significantly increased volume) occurs at a SMC zone — such as an Order Block, Breaker Block, Fair Value Gap (FVG), or Liquidity Zone — it implies that Smart Money is stepping in.
You can also look at volume when a Break of Structure (BOS) or Change of Character (ChoCH) occurs, using high volume to confirm the idea that Smart Money may be stepping in.
However, volume is discretionary, not every spike means commitment. Sometimes it simply marks a liquidity sweep before price reverses again; so keep that in mind as you apply this indicator.
For traders focusing purely on FVGs and OBs, here’s a simplified approach:
- Wait for price to enter a FVG or Order Block.
- Check if the candle closes with a volume spike or respects the FVG without breaking below/above it.
- If confirmed, the FVG is likely defended, and a trade setup may be valid.

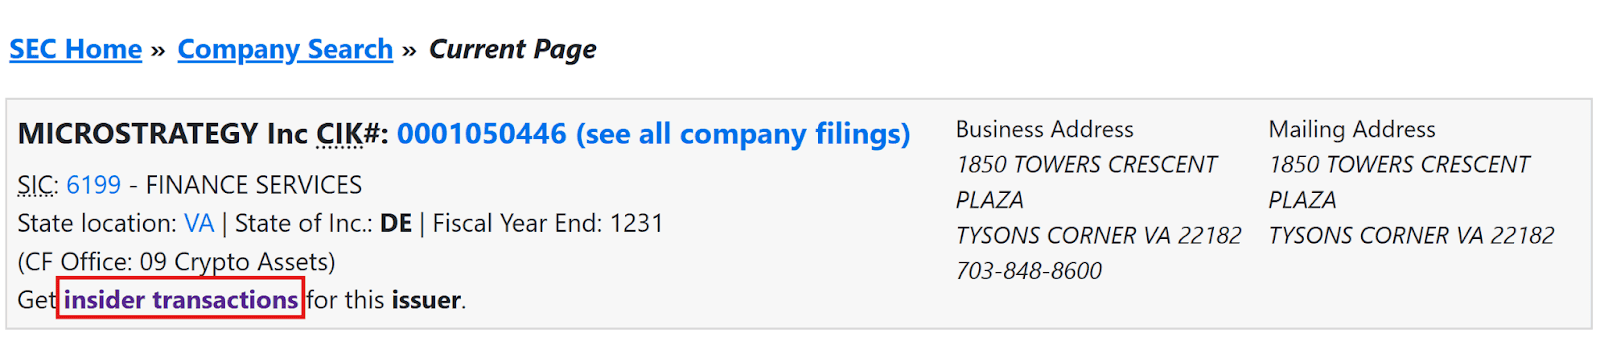
Insider Trading Reports (Form 4 Filings)
Form 4 filings are available on the SEC EDGAR database and track when company executives, directors, or major shareholders buy or sell their own stock. They are required BY LAW to report these forms within 2 business days of transacting shares.
These forms, though complicated to navigate for the untrained, give us insight into what insiders of a company are doing — and perhaps hinting at them getting ready for a news announcement.
To illustrate, if multiple insiders start buying heavily, it usually signals upcoming good news, either in the form of:
- Positive earnings surprises
- Acquisitions or mergers
- Positive announcements such as the stock joining the Nasdaq 100
The same logic applies in reverse: heavy insider selling near a premium zone can signal distribution before a drop. This could be a signal that insiders know something negative that we (retail) don’t, and some bad news could be announced soon.
When this buying or selling aligns with price tapping into a demand zone, Order Block, or Fair Value Gap, it strengthens the case for a SMC trade setup to play out successfully.
13F Filings (Institutional Investment Manager Reports)
Institutional investment managers in the U.S. with over $100 million in assets are required to file 13F reports each quarter. These filings disclose their equity holdings and changes, offering a clear look at what Smart Money is accumulating or offloading.
Though the raw 13F report format can be difficult for the average trader to interpret, many platforms now present this data in a simplified, user-friendly format. These tools typically display:
- Percentage change of a stock’s position in the fund
- Newly acquired or fully sold-off stocks
- Total number of shares held
- Percentage of the fund’s portfolio allocated to each stock
- Historical holdings over time
For SMC traders, this data helps set directional bias and refine watchlists. If a stock shows a clean structure—such as a Fair Value Gap or Order Block—and 13F data shows rising institutional exposure, it’s a strong sign the stock may be under quiet accumulation.
For instance, take a look at this Q1 2025 update of an investment institution’s equity holdings:
The data reveals not only which stocks were added or removed, but also how heavily they were weighted, and whether positions were increased or reduced.
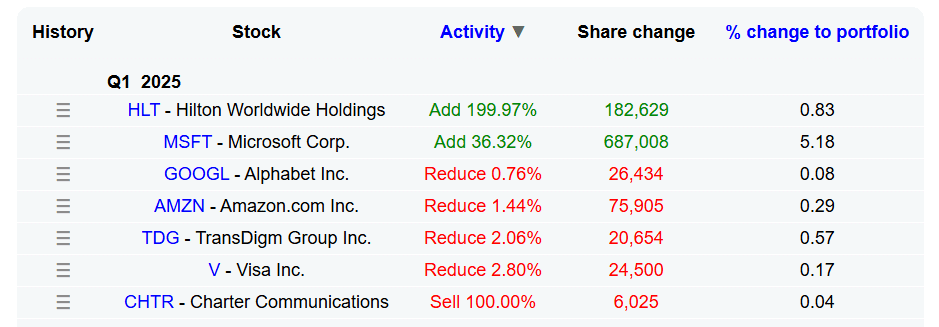
From this snapshot, an SMC trader can quickly draw several insights:
- Institutions appear to be bullish on tech and travel, as seen in the increased exposure to Microsoft and Hilton. Watch for longs if price aligns with bullish FVGs or demand zones.
- The 100% sell-off in Charter Communications may reflect a bearish view on the communications sector. Watch for shorts if price breaks structure or forms bearish FVGs.
- Cuts in Alphabet, Amazon, Visa, and others suggest institutions could be trimming exposure to high-performing names (like the Magnificent 7). Can be due to profit-taking or fading momentum.
| Keep in mind: Simply observing a 13F filing alone is not enough, it’s best to get an aggregate look at the top 10 ‘Superinvestors’ to really see where the Smart Money is backing. A single firm’s 13F filing is not enough to give you the full picture. |
Hedge Fund Databases
Hedge fund databases track how large institutional investors are positioned across sectors and stocks, often compiling data from 13F filings and other sources to provide a more complete view of Smart Money activity.
Though some platforms offer premium insights, many provide free access to key metrics in an easy-to-read format, including:
- Stocks most bought or sold across top-performing funds
- Fund-level conviction rankings
- Sector exposure and quarterly changes
- Overlaps between multiple hedge fund portfolios
- Recent filings across hundreds of firms
In essence, these databases provide a simplified view of institutional data sources such as 13F filings, Form 4 insider reports, and COT reports; everything we’ve mentioned so far!
For Smart Money Concept (SMC) traders looking to level up, hedge fund databases can be used to set directional bias, refine watchlists, and gain stronger conviction in setups — especially when institutional flow aligns with key zones.
Advantages of Trading Using the Smart Money Concept
Trading with the Smart Money Concept gives traders a deeper understanding of why price moves—not just where it moves. Instead of reacting to indicators or patterns that lag, SMC traders learn to interpret the intent behind price movement to align trades with Smart Money.
Notable Advantages:
- Anticipates market moves: Instead of chasing breakouts, SMC traders identify areas where Smart Money is likely accumulating or distributing, trading from key reversal or continuation points.
- Builds trade conviction: Tools like Fair Value Gaps and Order Blocks offer defined, logical entry zones with institutional context.
- Filters false signals: By focusing on liquidity grabs, manipulative wicks, and imbalances, SMC helps traders avoid being trapped by fake moves.
- Improves timing: Concepts like ChoCH (Change of Character) and SMS (Shift in Market Structure) help identify early reversals and confirmed trend changes.
- Works across various financial markets: Whether it’s forex trading, or indices, stocks, crypto, the principles of SMC apply consistently—because institutions influence all markets
Disadvantages of Trading Using the Smart Money Concept
While SMC offers powerful tools for reading institutional intent, it also comes with a learning curve. Many traders misapply its concepts without proper context or patience.
Notable drawbacks:
- Requires strong chart-reading skills: Identifying valid OBs, BBs, FVGs, or ChoCHs is discretionary and often misunderstood.
- Can lead to over-analysis: With so many SMC concepts, traders may fall into “analysis paralysis” by overcomplicating simple setups.
- Lagging confirmation at times: Waiting for full structure shifts like SMS can lead to missed early entries if not executed well.
- Limited consensus: There’s no single standard definition of SMC terms across platforms or educators, leading to inconsistencies.
- Not beginner-friendly without guidance: For traders new to market structure, SMC may feel overwhelming without proper study and practice.
Smart Money Concepts Controversies
Despite its growing popularity, Smart Money Concepts remains a controversial approach in trading circles:
- Subjective interpretation: Many argue SMC setups are too discretionary, with different traders drawing different conclusions from the same chart.
- Lack of statistical backing: Unlike well-tested indicator strategies, SMC is hard to backtest objectively due to its visual and structural nature.
- Over-marketing by influencers: Some online educators exaggerate SMC’s success rate, luring in beginners without proper risk education.
- Confusion with Wyckoff and Price Action: SMC borrows heavily from older concepts, but critics claim it’s a repackaging of classic ideas with more buzzwords.
That said, for those who invest time to understand SMC deeply—and pair it with volume, macro, or institutional data—it can become a powerful edge rooted in real market mechanics.
Smart Money Concept vs Price Action
Smart Money Concepts (SMC) and price action analysis share similarities in that they don’t rely on indicators, achieving similar reads through different means.
For example, SMC looks at the ‘Break of Structure’ or ‘Change of Character’ to identify a trend, while price action (PA) analysis puts the focus on the higher high, higher low, lower high, lower low pivots. SMC traders will also determine support and resistance levels through order blocks and breaker blocks, while PA traders look at horizontal levels that a price has repeatedly pivoted away from.
Interpretation of Market Dynamics
SMC traders focus on:
- Understanding accumulation vs distribution phases
- Identifying liquidity traps and engineered moves
- Spots support and resistance through Order Blocks, Breaker Blocks, and Fair Value Gaps
- Using Break of Structure (BOS) and Change of Character (ChoCH) to confirm directional bias
Price action traders focus on:
- Reading candlestick formations (e.g. pin bars, engulfing candles)
- Identifying key reaction zones using historical, horizontal price levels
- Spots diagonal support and resistances through trendlines, parallel channels, and chart patterns
- Spotting trend continuations or reversals based on chart patterns alone
Approach to Market Analysis
SMC traders approach the market by reverse-engineering institutional behavior. The focus is on why the price is moving. This method assumes that price doesn’t move randomly—it’s pushed with purpose by larger players.
Price Action traders, on the other hand, focus on what price is doing at the moment. Their setups are built around visible reactions at levels and patterns formed by historical behavior.
Smart Money Concept vs Wyckoff’s Theory
Back in the 1930s, Richard Wyckoff introduced the idea of a “Composite Man”—an invisible force representing Smart Money, moving the markets through phases of accumulation and distribution. He believed that if retail traders could understand this behaviour, they could trade alongside it.
Wyckoff believed the market moves in four key phases: accumulation, markup, distribution, and markdown—a cycle that mirrors how institutions operate today.
SMC builds on this same idea. But instead of using volume and schematics like Wyckoff, SMC traders track liquidity grabs, Order Blocks, and Fair Value Gaps to follow Smart Money’s trail. Both aim to decode institutional intent, and in doing so, achieve better alignment in their trading ideas with institutional flow.
In many ways, Wyckoff laid the foundation for the Smart Money Concepts many traders use in their playbook today.
Smart Money Concept vs Dow
Dow Theory is one of the earliest frameworks for understanding market cycles. It divides market movement into bull and bear phases, each consisting of three stages: accumulation or distribution, public participation, and excess or panic.
In many ways, Dow Theory aligns with Wyckoff’s view of market structure. It offers a broad roadmap of how cycles unfold but lacks the granularity SMC provides when identifying where price is being manipulated or where liquidity is being engineered.
Both aim to capture overall market direction. Dow Theory sets the broader cycle, while SMC focuses on actionable entries through tools like Fair Value Gaps and Order Blocks. Traders can use both approaches together—Dow for bias, SMC for precision.
Smart Money Concept vs Elliott Wave Theory
Like SMC, Elliott Wave Theory attempts to anticipate price behaviour before it happens. The difference lies in how each approach builds that anticipation. Elliott Wave traders forecast price action based on fractals—repeating price patterns that typically follow a five-wave impulse followed by a three-wave correction.
SMC takes a very different approach. It does not rely on 5-3 wave structures. Instead, it focuses on identifying areas where liquidity has been manipulated, using that as evidence of institutional involvement. This allows traders to align themselves with Smart Money flow based on what the market is doing now, and not what it’s expected to do next.
Both assume that price moves in patterns, but Elliott Wave aims to forecast those moves in advance, while SMC is more focused on finding exact turning points by tracking manipulation, imbalance, and structural shifts.
What is Smart Money Concept in Crypto?
Smart Money Concepts (SMC) work the same in crypto trading as in traditional markets. The core idea is to follow the actions of informed, well-capitalised traders. However, crypto has some unique traits — lower liquidity, higher volatility, and one big advantage: full transparency on the blockchain.
This transparency allows traders to apply On-Chain Analysis, which involves examining blockchain data such as wallet flows, token movements, and smart contract interactions.
Here’s how SMC adapts to the crypto space.
The Concept of Whales
In crypto, “Smart Money” doesn’t just refer to institutions — it also includes any wallet holding a large amount of a particular token. These major holders are known as whales, and they can be individuals or groups. Tools like Glassnode offer “Whale Metrics” that help traders see whether whales are accumulating or distributing. This insight into whale behaviour is central to applying SMC in crypto.
Wallet Tracking on the Blockchain
Due to blockchain’s public nature, you can track the activity of specific wallets with surgical precision.
There are two main approaches:
- Micro-level tracking: Manually follow the behaviour of known wallets to study their moves.
- Macro-level tracking: Use platforms like Nansen.ai, which identifies clusters of wallets considered “Smart Money” based on their performance and activity across tokens.
These methods let traders align their decisions with those of high-performing market participants.
Sentiment Analysis with SMC
SMC traders believe that Smart Money will always take the opposite side of retail traders. Therefore, when there is a high degree of wallets in profit, greedy sentiment, or overexposure to one side, SMC traders may begin to anticipate a reversal.
In crypto, these instances can be measured with the following tools:
- Crypto Fear & Greed Index — Measures overall sentiment
- Funding rates — Measures exposure to one side
- Bitcoin NUPL Chart — Estimates net unrealised profits or losses of Bitcoin traders
These are specifically designed for the crypto market — so you would not be able to apply it to Forex or Stocks, keep that in mind.
Detecting Potential Scams
Crypto is still a relatively new and loosely regulated market, which means bad actors are common, especially in low-cap coins.
By using on-chain analysis and wallet tracking, you can spot suspicious behaviours like:
- Large inflows/outflows between the same wallets — Classic behaviour of transactional spoofing
- Transfers back to the token’s original creator wallet — Pre-dump behaviour, or circumventing Lockups
- Large concentration of token’s supply in just a few wallets — High risk of pump and dump
By applying smart money tracking, you might not only find promising setups — you could also avoid dangerous projects entirely.
What is Smart Money Concept in Forex?
Smart Money Concepts (SMC) help traders understand how institutions manipulate price through liquidity traps, fake breakouts, and engineered volatility. Unlike crypto, Forex lacks on-chain data — but there are still clear signs of institutional flow.
Liquidity Zones
One of the key components of Smart Money Concepts, powerful when combined with order blocks:
- Buy-side Liquidity — Above recent highs; stop losses for shorts
- Sell-side Liquidity — Below recent lows; stop losses for longs
Institutions target these zones to enter big positions via stop hunts or fakeouts, i.e. liquidity sweeps. These can be highly prominent during news events, or in recency to them.
For example, if the Federal Reserve is about to hold a public conference, smart money may push Forex prices in the opposite extreme to gear up for better buying prices, or higher premiums to sell from.
Fair Value Gaps
After tapping into a support or resistance area, the presence of a Fair Value Gap indicates smart money activity.
- A fair value gap (FVG) that occurs during a breakout is often revisited as a continuation play.
- A fair value gap that rejects from a key level acts as confirmation of smart money intent.
Sentiment Traps
As discussed, Smart Money often trades against retail when there is extreme positioning (retail overly long or short), and this often signals a reversal.
However, the tools used to track this are different from crypto:
- COT Reports — Highlights institutional vs non-institutional positioning for the week.
- Forex Sentiment — Show whether most traders are long or short on an FX pair on a platform.
- Market Delta — Shows if the majority are market buying or selling, which if the price is diverging from, is a contrarian signal.
- Sentiment Divergence — When positive news fails to push price higher, it can signal a trap and pending reversal.
Smart Money may use these traps to engineer fake breakouts, news-driven wicks, or session opens designed to trigger retail stops.
FAQ
What are the common mistakes to avoid when trading with the Smart Money Concepts?
Overmarking charts, chasing liquidity sweeps without confirmation, and misidentifying structure are among the most common pitfalls.
Is the Smart Money Concept legitimate?
Yes, but like any trading method, its effectiveness depends on how well it is applied. It is rooted in observing institutional behaviour, but success comes from practice and discretion. Many traders will take selected parts of SMC (like Fair Value Gaps), and apply it alongside indicators or other forms of technical analysis to great success.
Is SMC suitable for beginners?
Smart money concepts trading can be challenging for newcomers, due to its discretionary nature and layered terminology, but with guided learning, beginners can adopt it effectively.
Does SMC trading work?
Many traders find SMC useful for timing entries and understanding price moves, especially when combined with confirmation tools or confluence factors.
How much should I start with when trading SMC?
There’s no fixed amount. Start with what you can afford to risk, ideally in a demo or small live account to build consistency before scaling up.
What is Smart Money Concept in forex?
SMC forex trading is viable, as it is most applicable in environments with high trading volume. The forex market is fantastic for deploying SMC strategies that focus on liquidity grabs and institutional order flow. SMC traders use COT reports to spot when net positions in forex futures become heavily one-sided — creating prime conditions for Smart Money to trigger liquidity grabs.
Does Smart Money Concepts work in the stock market?
Stocks often require a greater emphasis on volume analysis, which is a component of SMC but may necessitate additional tools and considerations. However, it is a fantastic market to spot manipulation due to the myriad of factors that contribute to a stock’s price, including but not limited to: global news, insider trading, earning reports, product launches, and company updates.


