


- Elliott Wave
- June 26, 2025
- 2 min read
Gold Price Weigh’s In Heavy [Gold Elliott Wave]
Executive Summary
- Trend Bias: Gold is declining in a corrective wave.
- Current Action: A decline to $3,220 – $3,244 and possibly lower levels appears as the higher probability trend.
- Key Level: A print above $3,393 suggests the decline is likely over.
Current Elliott Wave Analysis
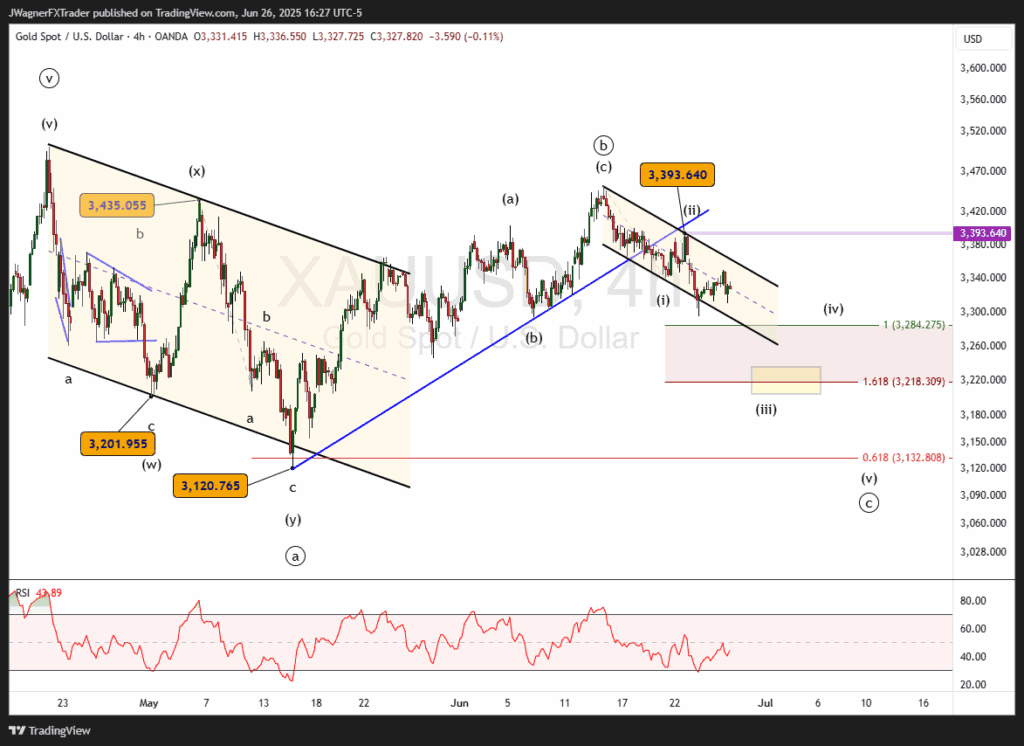
The current Elliott wave chart of Gold shows an incomplete downward flat pattern. A flat subdivides as 3-3-5 waves and is labeled ((a))-((b))-((c)).
The decline from mid-June appears to be wave ((c)).
We know from our Elliott wave studies that C-waves in flats are motive patterns that subdivide into five waves. The current decline appears to be in the early stages of wave (iii) of the five-wave decline.
Wave (iii) reaches the 1.618 Fibonacci extension of wave (i)…a common relationship…if gold decline to around $3,218. Even further declines to $3,120 are possible under the flat pattern that began in April.
If gold were to rally above the wave (ii) high of $3,393, then we’ll be forced to reconsider this wave count.
There is an alternate count under consideration.
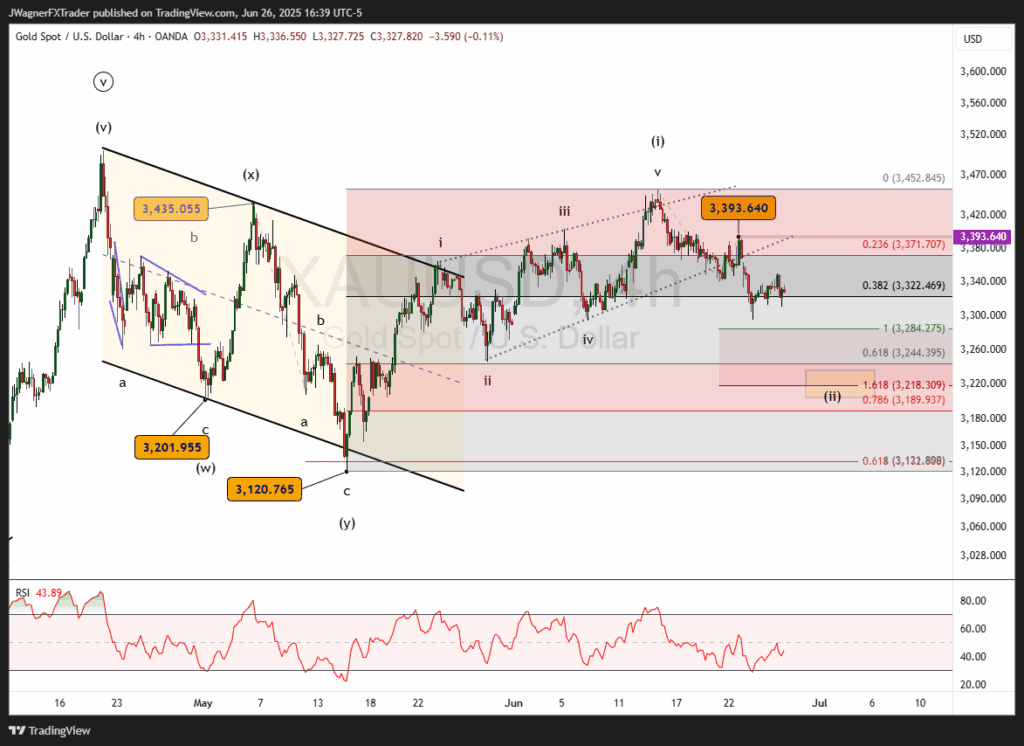
This would suggest the rally from May to June was a leading diagonal. The decline from early June is wave (ii). Wave (ii) could decline to $3,189 – $3,244. Those two figures are a result of the 61% and 78% Fibonacci retracement of wave (i).
Bottom Line
Gold appears to be in the early stages of a small degree 3rd wave lower. If this wave pattern is correct, then gold would decline to $3,220 and possibly to $3,120 while a rally above $3,393 negates the bearish count.
In the alternate scenario, a decline to $3,189 – $3,244 is higher probability. You’ll notice these two counts overlap on forecasting a decline to $3,220 – $3,244.
You might also be interested in:


