
- Elliott Wave
- May 22, 2025
- 2 min read
Loonie on the Edge: USD/CAD Elliott Wave Breakdown
Executive Summary:
- Major Trendline Hit: On the 1W chart, USD/CAD has reached a 4-year ascending trendline, a breakdown suggests a larger downtrend underway.
- Bearish Impulse Developing: The 1D chart suggests an uncompleted 5-wave bearish structure that could lead to further declines.
- Key Level to Watch: 1.3750 is critical. A sustained break below this level confirms a deeper correction toward the 1.20.
Current Elliott Wave Analysis
Weekly Chart (1W)
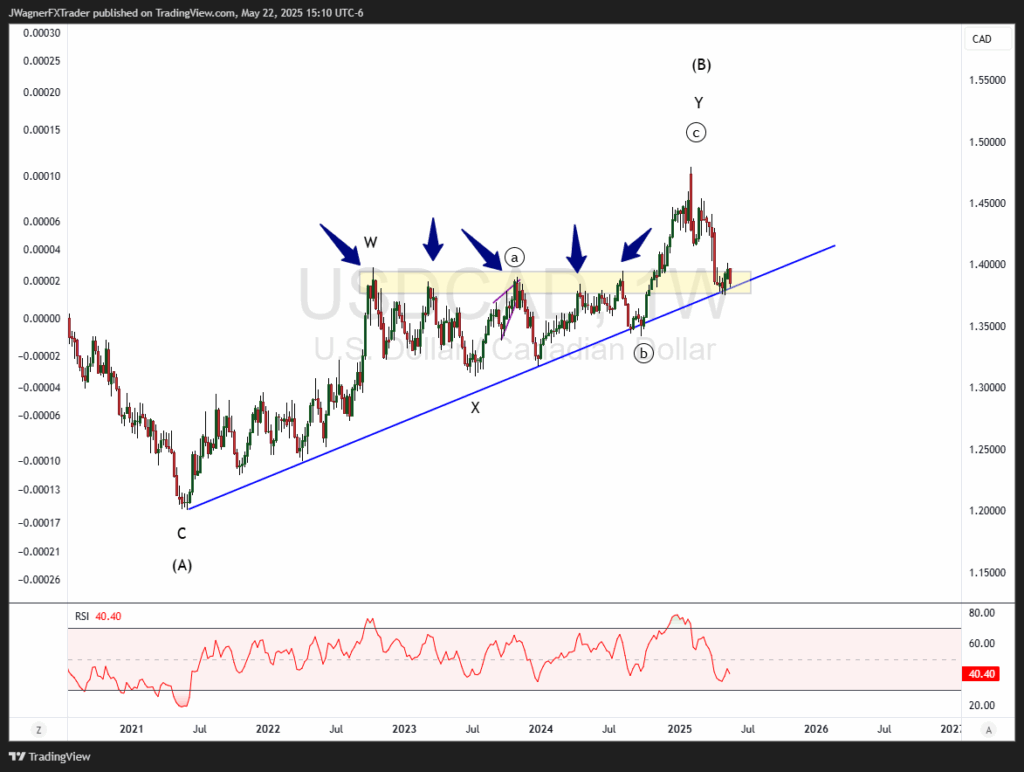
The weekly Elliott wave chart for USD/CAD shows a major top in February 2025 as wave (B) of a larger flat pattern that began in 2016. If so, then a decline to 1.20 may appear over the next several months.
Since 2021, USDCAD has been contained by an upward sloping support trend line. USDCAD has declined to meet this trend line and has bounced slightly.
There is additional support in the current price zone marked by previous swing highs (yellow box and blue arrows).
Daily Chart (1D)
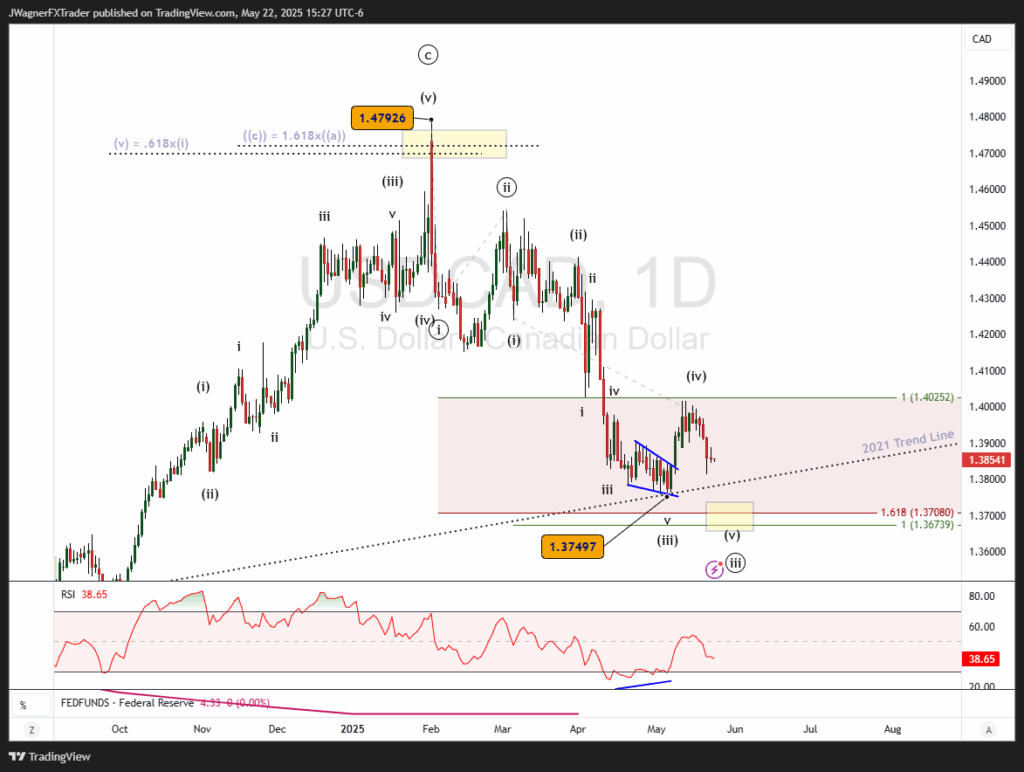
Zooming into the daily timeframe, the decline from 1.4793 appears to be a developing impulse pattern. Price is currently within wave (v) of ((iii)) of the five wave impulse.
If this model is correct, then the decline in wave (v) of ((iii)) likely falls to 1.3675-1.3710.
It is within this price range where wave ((iii)) would be a 1.618 Fibonacci extension of wave ((i)). Additionally, wave (v) would equal the length of wave (i). Both are common wave relationships.
You’ll notice that the trend line from 2021 is hovering just above this price level.
As a result, if a new low is reached below 1.3750, then it will add more evidence of an incomplete bearish impulse pattern.
Then, a forceful breakdown below the trend line will likely be witnessed in the coming weeks signalling a larger downtrend towards 1.20.
Bottom Line
USD/CAD appears to have reached a major top at 1.4793 and a breakdown below the 2021 trend line will confirm it.
If the 2021 trend line breaks, it suggests a larger expanded flat pattern since 2016 and wave ‘C’ of the flat may trend towards 1.20.
A break above 1.43 would negate this forecast and suggest the larger uptrend is ongoing.
You might be interested in…