Will the Nasdaq 100 recover from its significant daily bearish candle?
It’s certainly proven itself resilient in the past few months, and with yesterday’s cooling inflation data, markets have flipped on a risk-on approach to investing.
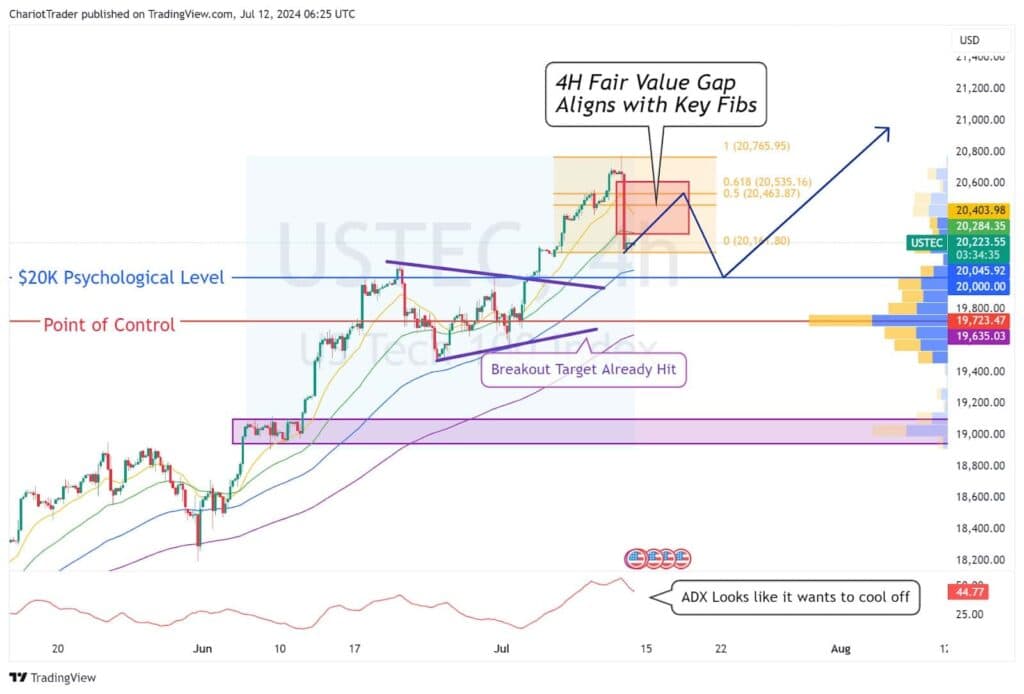
As it stands, there are several indications on the technical chart to suggest an ABC correction scenario to take place before a further rally:
- Nasdaq 100 (USTEC) has closed a significant daily bearish candle.
- ADX momentum indicator is cooling off after a triangle breakout.
- There is a concentration of trading volume between 0.50 and 0.618 Fibonacci levels.
- There is a 4H Fair Value Gap which aligns with the Fib levels.
Let’s get into it.
Technical Analysis of Nasdaq 100 (July 12th, 2024)

Nasdaq 100 has currently reached a moderately sized volume node and begun consolidating at around $20,100. However, right below it sits a much more significant volume node, coinciding with the psychological level of $20,000.
If the Nasdaq 100 finds its footing and grinds up from here, watch for a reaction at $20,460 to $20,535. These are bearish 0.5 and 0.618 Fibonacci levels measured from yesterday’s bearish candle high to low.
This is a good area to look for a shorting opportunity. We’ve formed a significantly sized fair value gap on the 4H timeframe from approximately $20,300 to $20,600. Since this gap range is large, we can narrow our attention to the key Fib levels of 0.5 and 0.618.

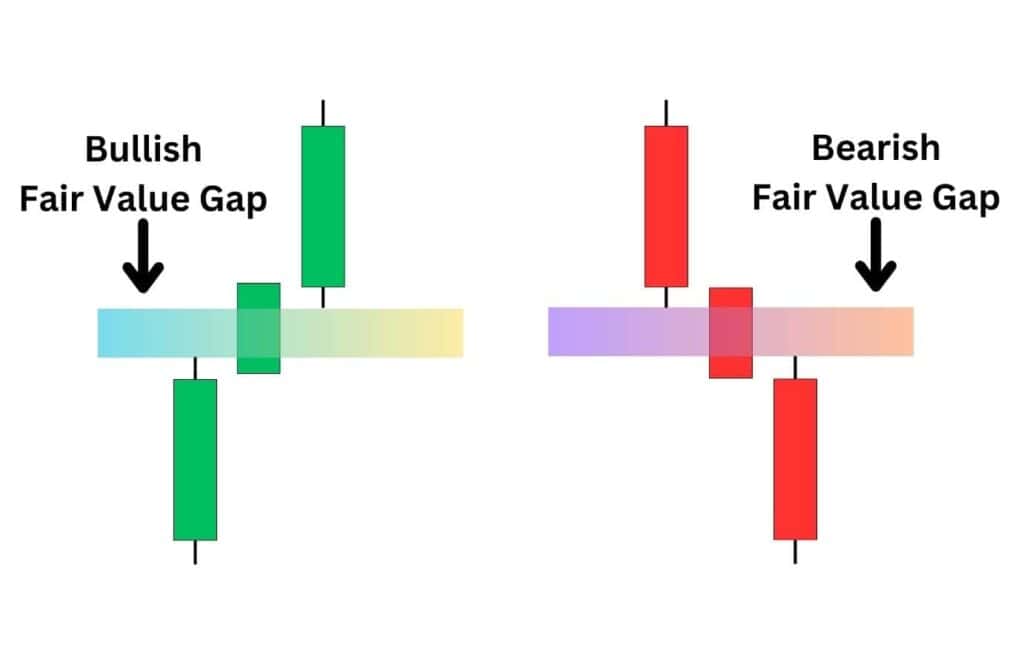
| What are Fair Value Gaps? A Fair Value Gap (FVG) is an “Air pocket” between 3 consecutively higher or lower candlesticks. It represents an area which the price has cut straight through – making it effectively an untested price zone. They work similarly to market gaps, in that price typically will return to the gap and test the market’s intentions. If the price rejects from a Fair Value Gap, it signifies that buyers or sellers are interested in defending the price from going any higher or lower. |
On the flip side, if Nasdaq directly revisits the key volume node and psychological level of $20,000, we can look for a potential bounce at this zone – taking some profits at the previously laid out FVG and Fibonacci levels.
As the ADX momentum oscillator is cooling down after a triangle breakout, it’s more likely that we’ll see some sort of consolidation here before further market continuation. Personally, I am anticipating an ABC correction as laid out above.
However, anything can happen in the markets – so keep your eyes peeled on interest rate decisions and inflation data (CPI, PPI, PCE) in the coming days and weeks!
You may also be interested in:
AUD/USD – The Race to 2%
BTC Potential Temporary Relief


