Earlier today, the Reserve Bank of Australia announced its intention to maintain its interest rate at 4.35%. However, the underlying tone of the announcement was hawkish, with representatives expressing that the path towards its inflation target of 2-3% to be a tough road ahead.
The possibility of a rate hike was also discussed, and expectations of rate cuts were pushed back to Q2 2025. With this hawkish undertone, the Australian dollar may receive some fuel towards the upside.
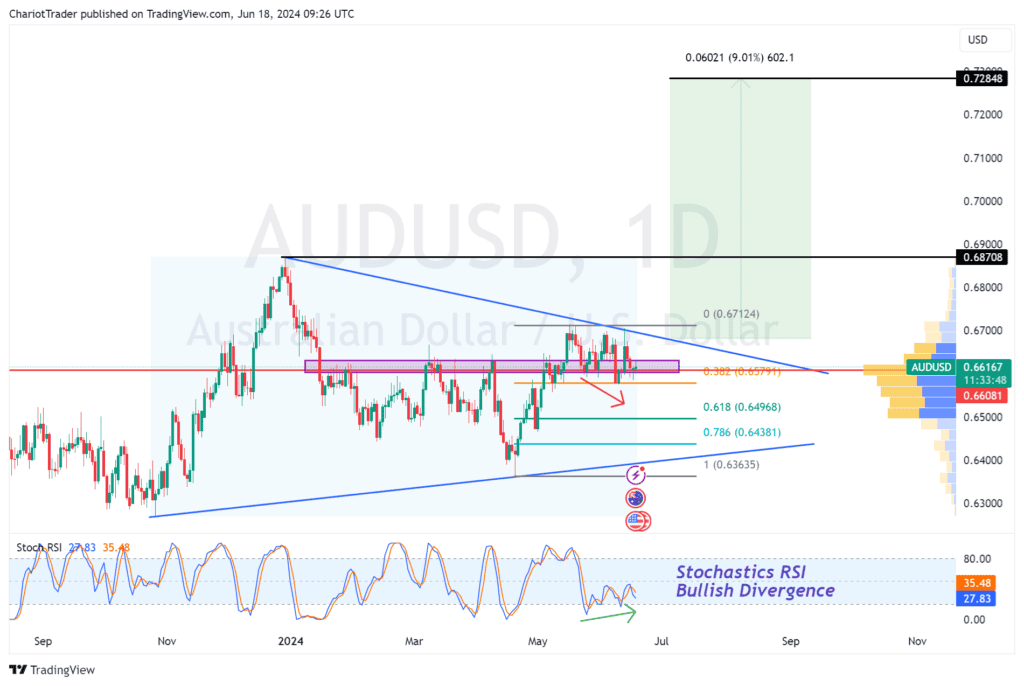
It’s important, however, to still monitor the technical chart of AUDUSD with a keen eye as it is currently consolidating within a daily symmetrical triangle pattern.
Technical Analysis of AUDUSD – 18th June, 2024

As discussed, AUDUSD is currently within a symmetrical triangle pattern on the daily timeframe. The news may help fuel a breakout to the upside as the market prices in the expectations for a rate hike.
AUDUSD is currently at a support zone at $0.662, which acted as a former resistance level from March to May of 2024. There are other indicators which support the bullish case scenario:
- 0.382 Fibonacci retracement Level – $0.658
- Point of Control from October 2023 (Start of the Triangle) – $0.66125
- Stochastics RSI is consolidating below 50, with a small bullish divergence.
If this level holds, we could see a rise in AUDUSD, possible reaching the following levels:
- Triangle Pattern’s Upper Trendline – Approximately $0.668
- Triangle Pattern’s Highest High (Aligns with a bigger 0.382 Fibonacci Retracement) – $0.687
- Measured Move Target of Bullish Breakout – $0.728
If this support zone does not hold, we could see a retest of the 0.618 Fibonacci Retracement at $0.649, which aligns with the value area low of the entire pattern.
You might be interested in: Analyzing RBA, BOE, and FED Decisions in June


