


- Quarterly Forecast
- May 9, 2024
- 5 min read
US Dollar Poised For Bearish Trend in Q2
Executive Summary:
- US Dollar (DXY) is appears to have begun a new bearish trend
- EURUSD, GBPUSD, AUDUSD appear to have completed their bearish trend
- USDJPY pattern is incomplete to the upside
US Dollar (DXY) Q2 Forecast
Last week, DXY reached a high of 106.49 and has reversed. This price action drafted a bearish engulfing candlestick pattern, obviously a bearish formation.
More importantly, the price has reclaimed the 78.6% Fibonacci retracement level from the Q4 2023 decline. The 78.6% retracement level is often viewed as the retracement of last resort. With DXY dropping back below this hidden level of resistance, it is another signal that the market is trying to reverse and trend lower.
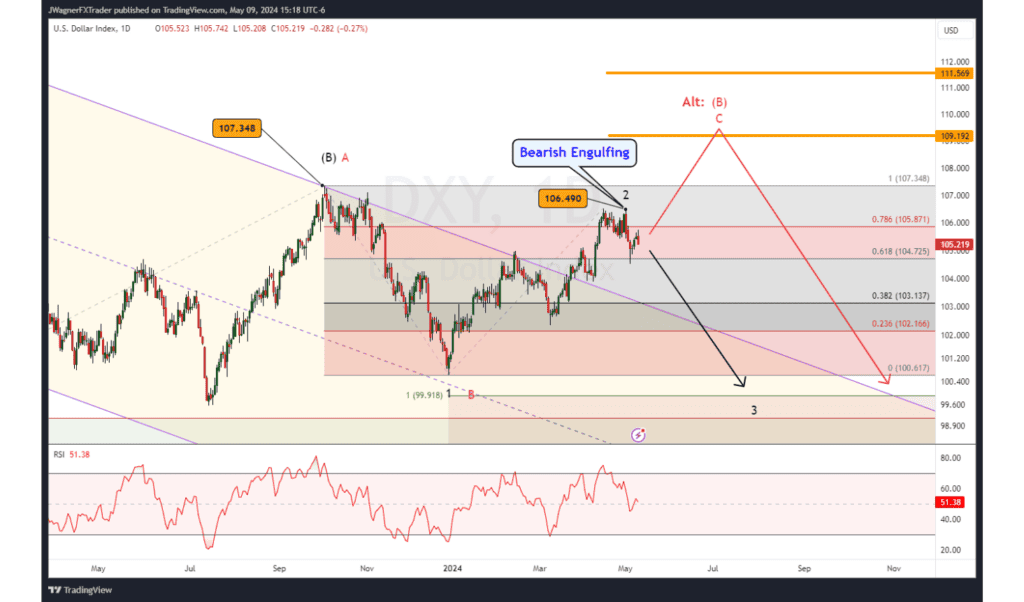
From an Elliott Wave perspective, this high is currently viewed as wave 2 of a larger declining impulse pattern. For wave 2 to remain valid, DXY would need to hold below the December high of 107.35. If wave 3 is about to unfold, then DXY would trend lower for the next few quarters en route to 99 and possibly even lower levels such as 96 and 90.
If DXY does rally above 107.35 (red labels), then we would reassess that a larger wave (B) was pushing higher and that its terminal point may reach 109-111.50.
EURUSD Q2 Forecast
Similar to DXY, EURUSD has also reached its 78.6% Fibonacci retracement level from the Q4 2023 rally. Support has been found as this level.
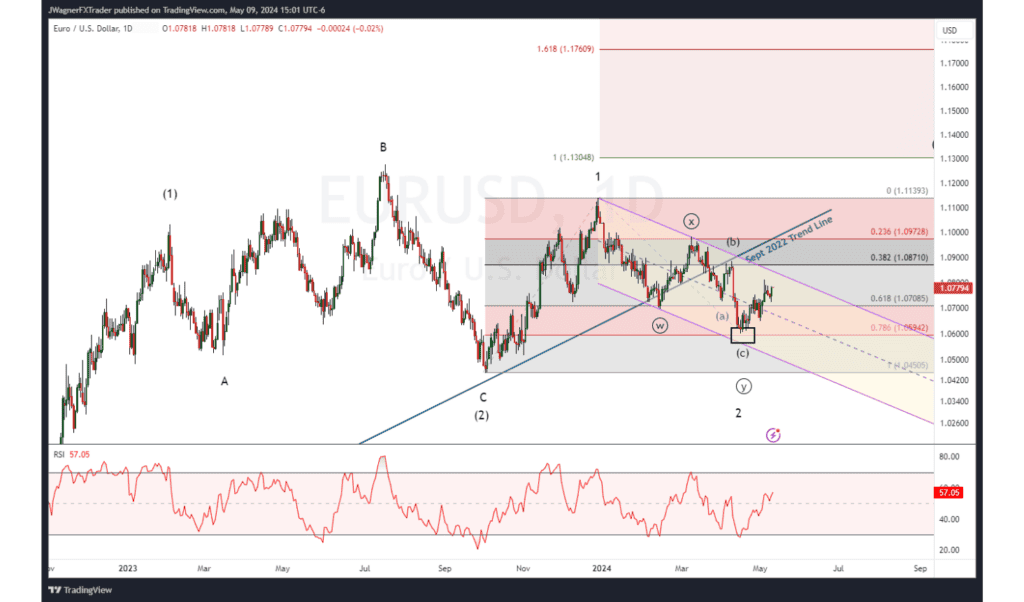
EURUSD has rallied above 1.0695 creating overlap with the February low and suggest the Q1 decline was a temporary corrective wave.
The Elliott Wave count suggests that wave 2 has ended and wave 3 rally is in its early stages. Wave 3’s tend to be the longest and strongest of the Elliott wave sequence.
As a result, EURUSD appears to be on the front edges of a large rally that carries it above 1.13, possibly up to 1.17 and 1.25 over the next couple of quarters.
If EURUSD fell below 1.0601, then it would suggest larger wave (2) was unfolding as a more complex wave and that EURUSD likely falls below 1.0451.
GBPUSD Forecast Q2
Cable reached the 61.8% Fibonacci retracement level of its Q4 2023 advance. By nature of GBPUSD not retracing as deep as DXY or EURUSD, this implies GBP is exhibiting some relative strength against EUR.
Therefore, if the trend does turn towards broad based USD weakness, then GBP may be one that outperforms other main currencies.
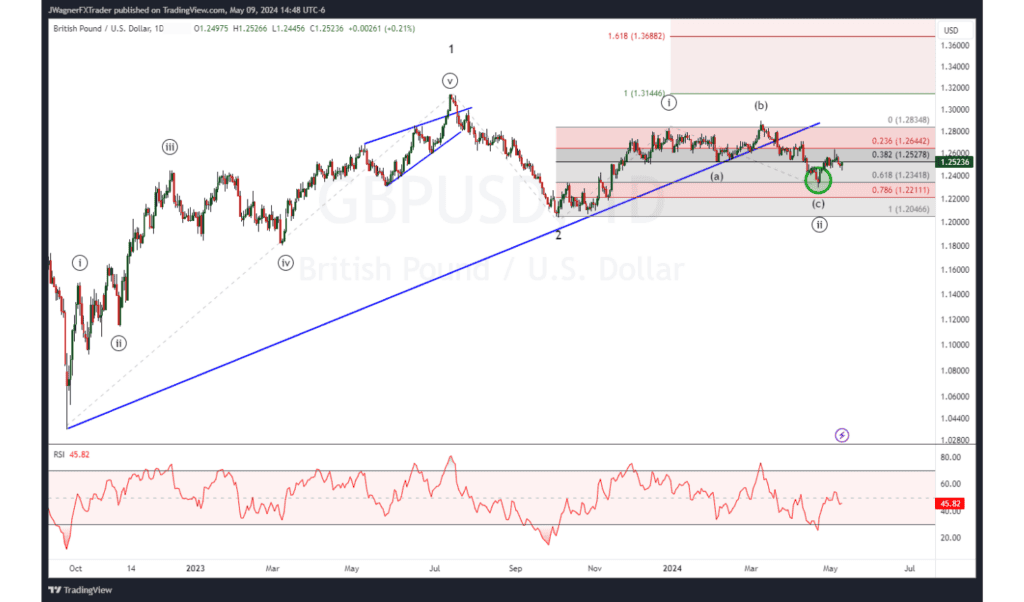
From an Elliott wave viewpoint, the 2024 decline is seen as a corrective wave ((ii)). It appears this decline is over, and if so, then GBPUSD would rally in stern fashion in wave ((iii)) of 3.
The wave ((ii)) pattern is viewed as an expanded flat labeled (a)-(b)-(c). Generally, those patterns are shallow retracers. If this decline digs deeper down to the 61.8%, then we’ll have to consider other patterns and if this is a wave ((ii)) flat.
If this wave count is correct, then 1.39 and 1.52 are some upside targets over the next few quarters with 1.76 possible as well.
AUDUSD Q2 Forecast
On April 19, AUDUSD reached the 78.6% Fibonacci retracement level of the Q4 rally. There is another wave relationship at .64 providing strong support. As a result of this strong support, Aussie drafted a daily hammer candlestick pattern signifying support from buyers.
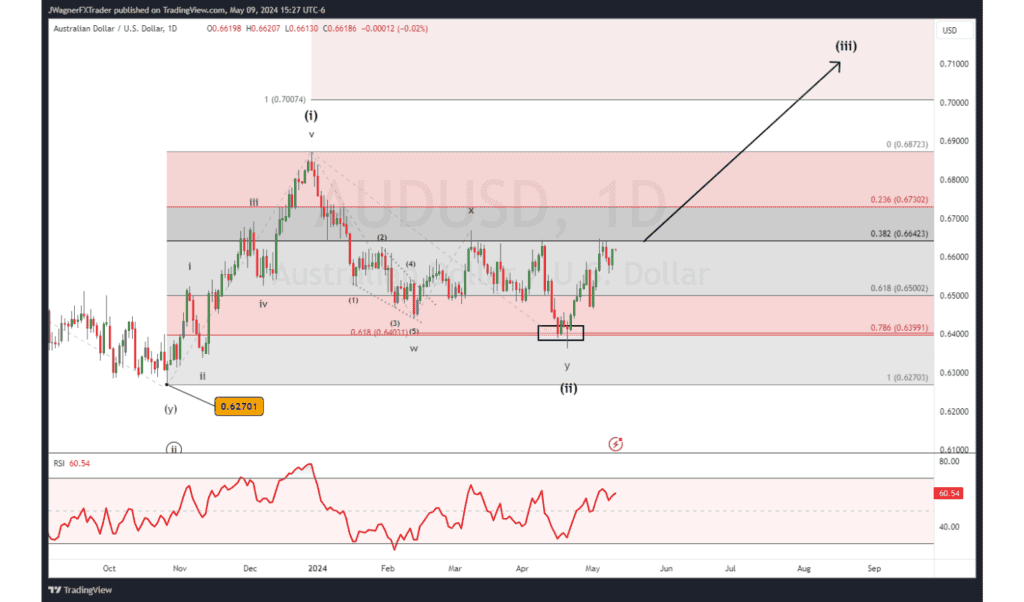
From an Elliott wave perspective, AUDUSD appears to have shaped a series of waves 1 & 2. Under this model, AUDUSD is in the early stages of a 3rd wave advance at three different degrees of trend. This would be a powerful trend higher.
Some initial targets would be .73 and the 2021 high of .80. If this is a 3rd wave at multiple degrees of trend, then even higher levels above .80 are warranted.
This Elliott wave count is valid so long as AUDUSD holds above .6270. If AUDUSD does print below .6270, then we’ll need to reconsider other patterns.
USDJPY Bullish Pattern Incomplete
Of all the USD patterns discussed thus far, USDJPY is the only one who’s pattern does appear incomplete towards USD strength.
As USDJPY has broken out to new 34-year highs, there appears to be more upside rally to come. A large triangle appears beginning with the 2022 decline and ended in March 2024.
USD/JPY Elliott Wave Count Daily Chart
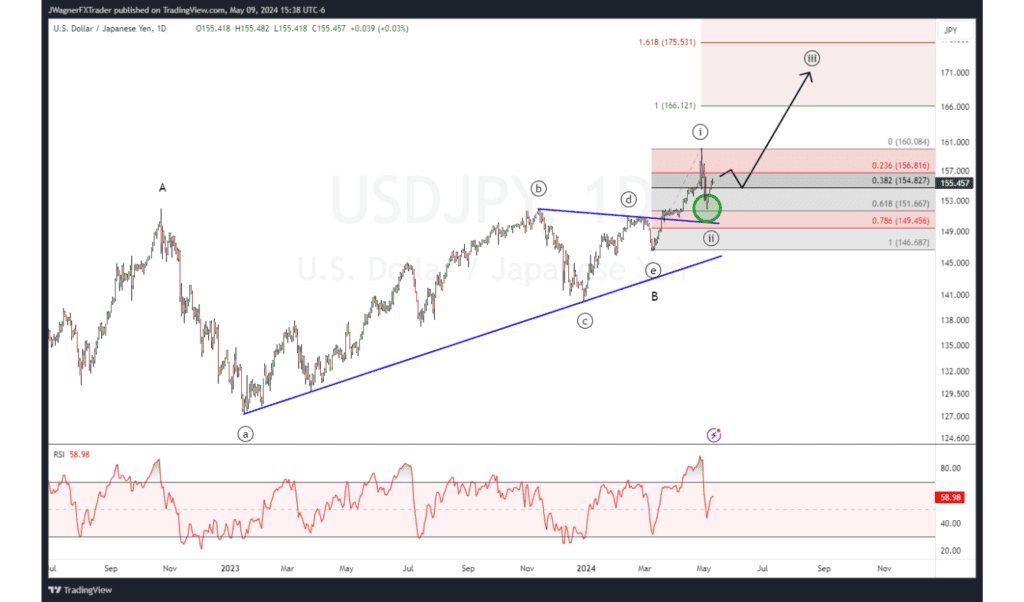
From an Elliott wave perspective, triangles appear in the 2nd to last wave of the larger pattern. Therefore, this sideways triangle pattern from 2022-2024 suggests this rally in USDJPY is a terminal wave, a final wave of a much larger rally.
When we apply Fibonacci extension and assess corresponding wave relationships, models show a cluster of wave relationships appearing near 175 and 189. That doesn’t mean USDJPY has to rally to 175 or that if it gets there it will stop at 175, but with an incomplete rally pattern, 175 may act like a magnet and attract prices.
The bottom line is that the recent decline appears to be wave ((ii)) of of 5-wave advance. That means there are likely to be a couple more jabs higher to complete the 5-wave sequence. USDJPY may consolidate some during Q2, but the advance in the longer-run appears incomplete.


