


- Elliott Wave
- June 6, 2024
- 2 min read
USD/CAD Elliott Wave: Shooting Star Pattern Awakes Bears
Executive Summary
- USDCAD saw volatile price action when Bank of Canada cut interest rates 25 bp
- Prices retraced the rally, possibly signaling the end to a month long triangle pattern
- Bearish targets include 1.35
Bank of Canada Lowers Interest Rates
Earlier today, the Bank of Canada released their interest rate expectations and lowered the benchmark rate 25 basis points to 4.75%.
Market participants initially bought USDCAD due to BOC lowering interest rates quicker than the Fed. The USDCAD rally was immediately retraced leaving behind a shooting star candlestick pattern on the daily chart.
End of Elliott Wave Triangle Pattern
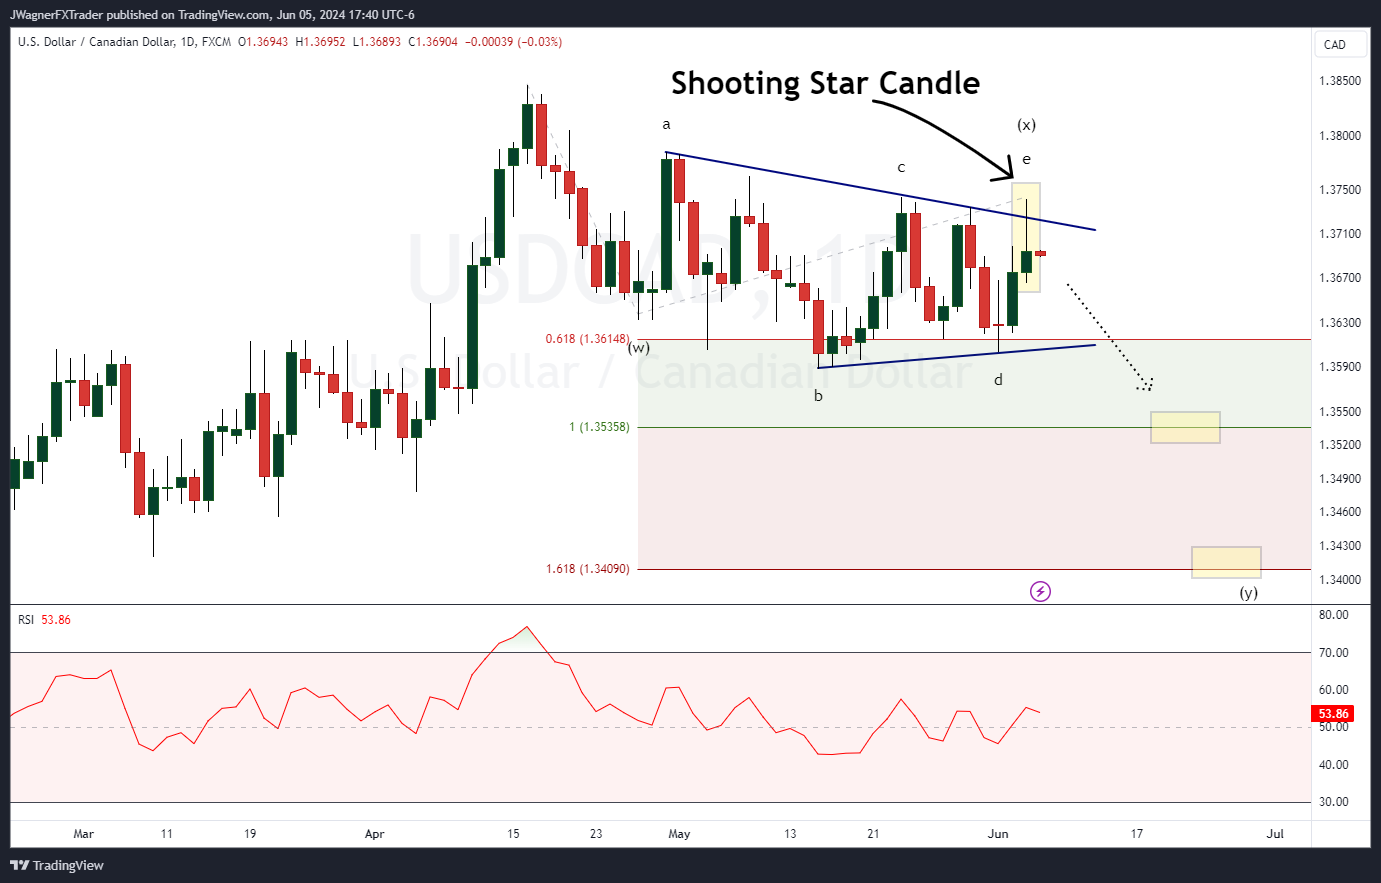
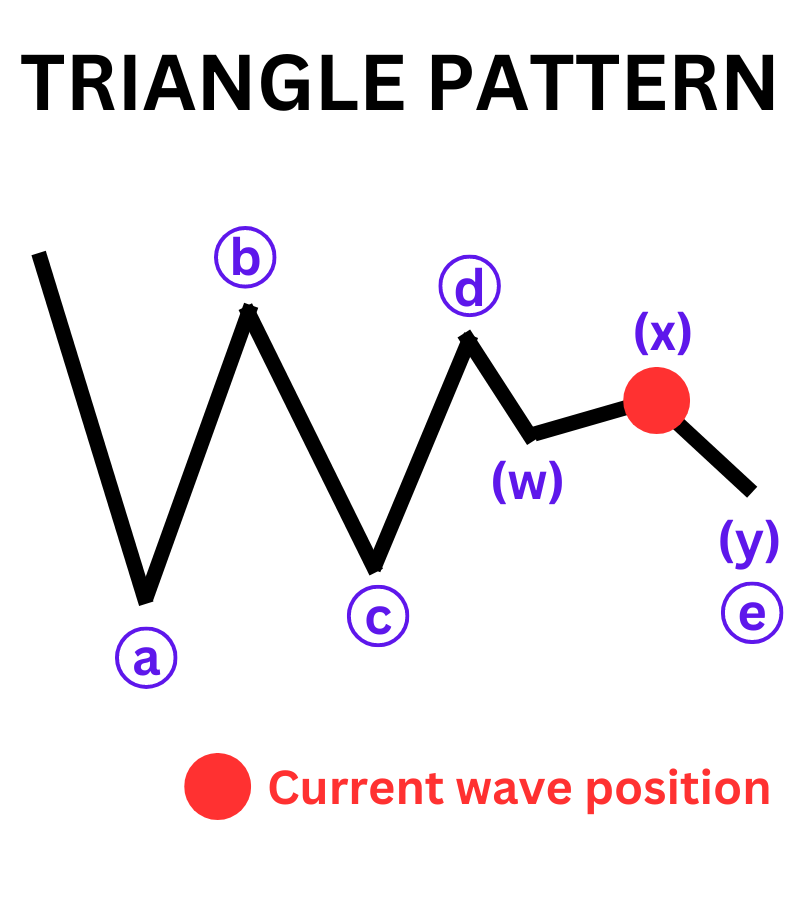
Today’s price action was dramatic, an important component to mark the end of a month-long Elliott wave triangle pattern. The shooting star candle popped slightly above the a-c trend line before declining. This is a common move for the terminal wave of a triangle pattern.
Under this wave count, the decline is just beginning and would carry down to 1.3535 and possibly 1.3410.
Be careful of this decline, if it appears. It is quite possible this upcoming decline in USDCAD would terminate an even larger triangle wave. Therefore, we don’t know if it will sucker punch lower or be too strong to deliver significantly lower pricing.
The good news is that if this larger triangle wave is the correct wave count, a massive USDCAD rally may begin from 1.34-1.35 or slightly lower levels.
Current USD/CAD Elliott Wave Count
Therefore, the current wave count for USDCAD appears to be wave (y) of ((e)) of X [triangle]. This means the decline is a terminal wave. For this wave count to hold true, wave ((e)) must finish above the December 2023 low of 1.3177.
Bottom Line
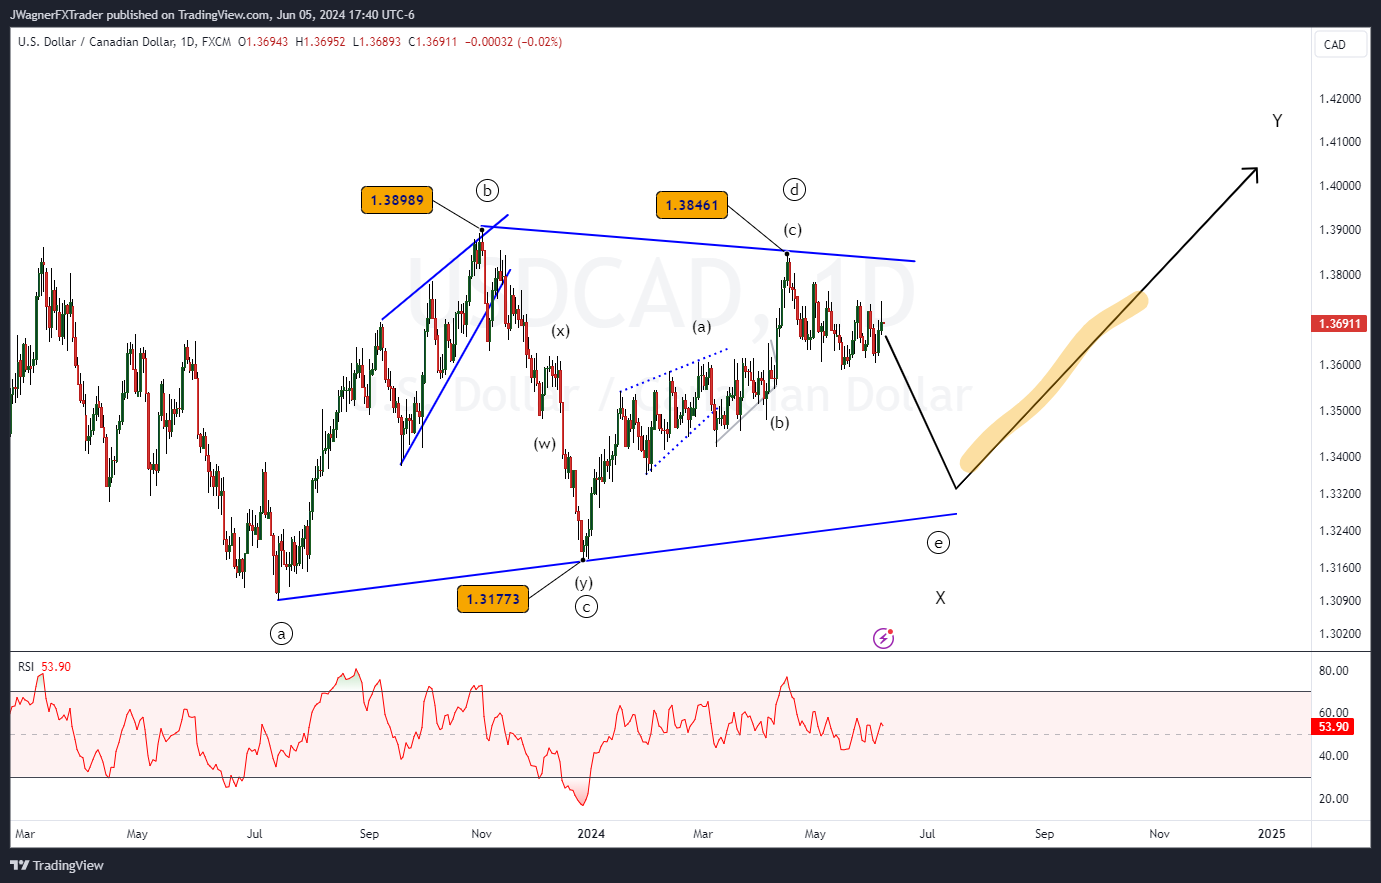
USD/CAD appears to be declining in a wave that may terminate a large triangle pattern going back to October 2022. If so, then this decline may carry down to 1.34-1.35 but must hold above 1.3177.
Once this decline is finalized, the next rally could carry 1000 pips higher.


