


- Elliott Wave
- April 15, 2024
- 2 min read
US Dollar Reaching Decision Point
EXECUTIVE SUMMARY:
- US Dollar (DXY) has moved beyond 78.6% Fibonacci retracement
- 107.35 is the key level for bears with a target of 99
- If 107.35 is broken, then the door is open to 109.20-111.50
Current Elliott Wave
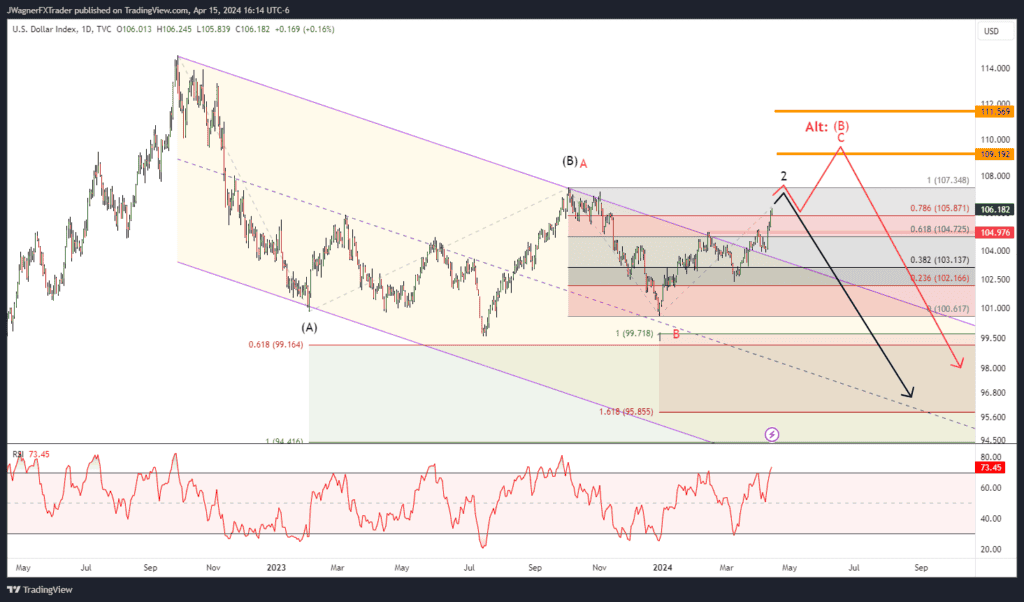
The current Elliott wave for DXY is considered wave 2 of (C) on the daily chart. This wave count suggests wave 2 is nearing a terminal point and will begin a large correction down to below 99. [black labels on the chart above]
For this wave count to remain valid, DXY will have to hold below 107.35, the beginning of wave 1 of (C).
This wave count, though still valid, is beginning to test its limits and we need to have in mind an alternative count should 107.35 break.
You see, the DXY rally has carried above the 78.6% Fibonacci retracement level of the proposed wave 1 of (C). There is nothing that prevents wave 2 from retracing that deep, but we are beginning to enter rarified air.
Alternate Elliott Wave Count
107.35 is the key level for bears and if this is broken to the upside, it simply means wave (B) has not finished and is extending higher. [see alternate red label on the chart above]
Under this scenario, we’ll look back to the September 2022 to January 2023 downtrend and apply Fibonacci retracement levels. A target zone of 109.20-111.50 is generated representing the 61.8% to 78.6% retracement level.
If DXY does break 107.35, then look for it to continue higher into the 109.20-111.50 price zone. At that point, we would anticipate a top to wave C of (B) and larger wave (C) beginning to the downside.


