


- Elliott Wave
- April 17, 2024
- 2 min read
EUR/USD Elliott Wave: Searching For A Bottom
Executive Summary:
- EUR/USD has declined 250 pips over the past week
- Anticipating a bullish reversal near 1.06; while price holds above 1.0451
- The next bullish wave in EURUSD may carry up to 1.13, 1.17, and possibly higher levels
Current Elliott Wave in EUR/USD
The current decline in EURUSD is viewed as wave (c) of ((y)) of 2. If this count is correct, then EURUSD is about to begin a wave 3, typically one of the longest and strongest waves of the impulse wave pattern.
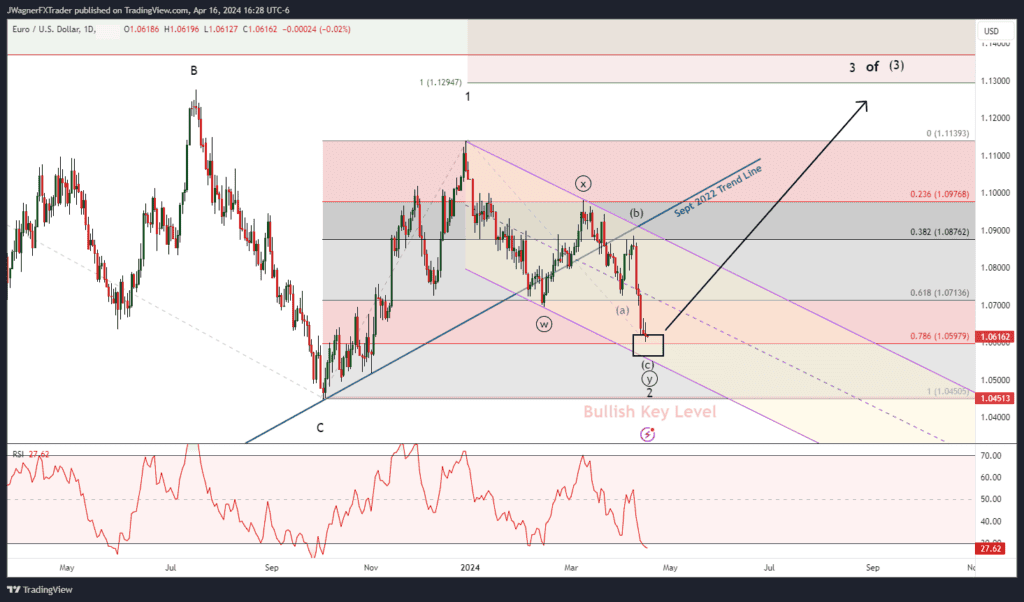
On the daily price chart above, wave 2 began at the 1.1138 high in December 2023 and has been trending lower for the past four months. The wave 2 decline is viewed as a double zigzag labeled ((w))-((x))-((y)).
It appears we are in the final stages of wave ((y)) and it is subdividing as an (a)-(b)-(c) zigzag.
The 78.6% Fibonacci retracement level is near 1.0593. This level represents a deep, but normal retracement for a wave 2. Since appear appears EURUSD is in the late stages of wave (c), we can anticipate a bullish reversal.
For this wave count to remain valid, the bullish reversal would need to take place above 1.0451. If this wave count is correct, then wave 3 would carry up to 1.13 and possibly extend to 1.17 or higher levels.
1.13 represents where wave 3 would equal wave 1 and 1.17 is where wave 3 is 1.618 times the length of wave 1.
If EURUSD were to fall below 1.0451, then we would need to reconsider this decline as a larger degree wave (2).


