


Written by:


- Chart of the Day
- April 4, 2024
- 2 min read
Chart of the Day: NZDUSD Approaches a Major Trendline Support
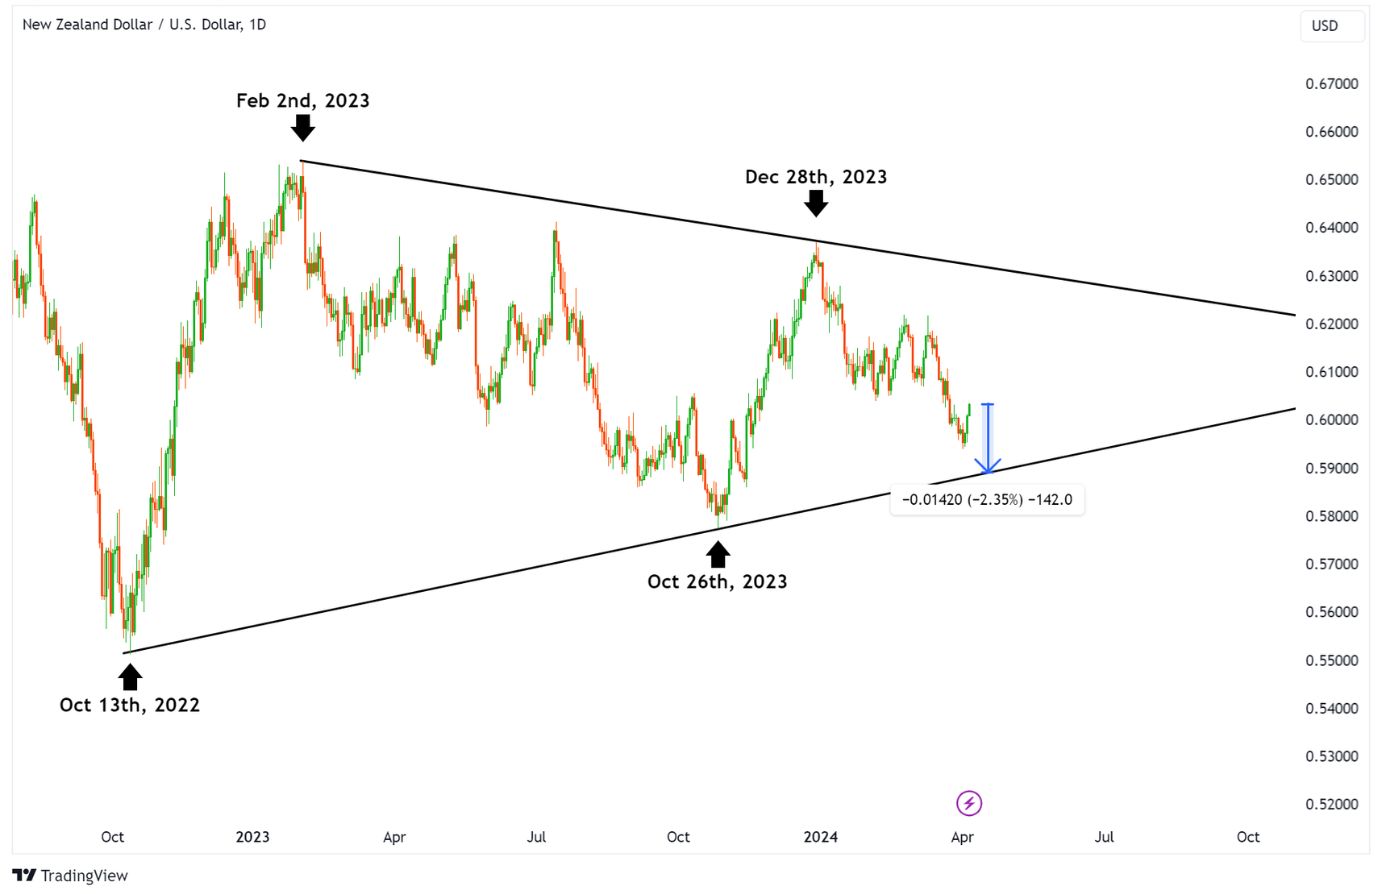
NZDUSD is approaching a trendline formed by the 2022 and 2023 lows. If NZDUSD continues to climb lower towards approximately $0.59, this lower trendline could provide major support.
Scenarios:
- If NZDUSD holds, it may rally to retest the triangle’s top trendline at around $0.628.
- If the support is broken, then NZDUSD may retest the October 26 low of $0.57 or lower.
The previous two times this trendline support was met, NZDUSD made significant rallies of 18% and 10% respectively, so, we can safely assume this is a respected area of support. If broken, the implications could be catastrophic for NZDUSD.
Now, how likely is the trendline to break? It’s hard to say.
The technicals tell us that the triangle should hold, and the DXY is approaching a resistance level at 105 and 107. However, as the conflict in the Middle East expands, we may begin to see investors derisk – therefore selling their assets back into USD to hold.
Either way, it would be prudent to keep a watchful eye on NZDUSD and other majors for a bullish reversal, or a bearish break in the upcoming days and weeks.


