| This is a longer term Chart of the Day where trade opportunities could occur in the coming weeks or days. |
The 3M stock has broken out of a falling wedge created from 2018 to 2024, a bullish indication for investors and traders looking to enter a swing trade.
Now, the price of 3M sits at around $135 with a weekly bearish divergence, which hints at a pullback, or even potentially a major reversal if the broader markets take a slump.
If this pullback does occur, bullish investors and traders could get in on the prospective 3M wedge trade with a technical target of $217.19, the top of the Falling Wedge.
Technical Analysis of 3M (MMM) Chart on October 7th, 2024
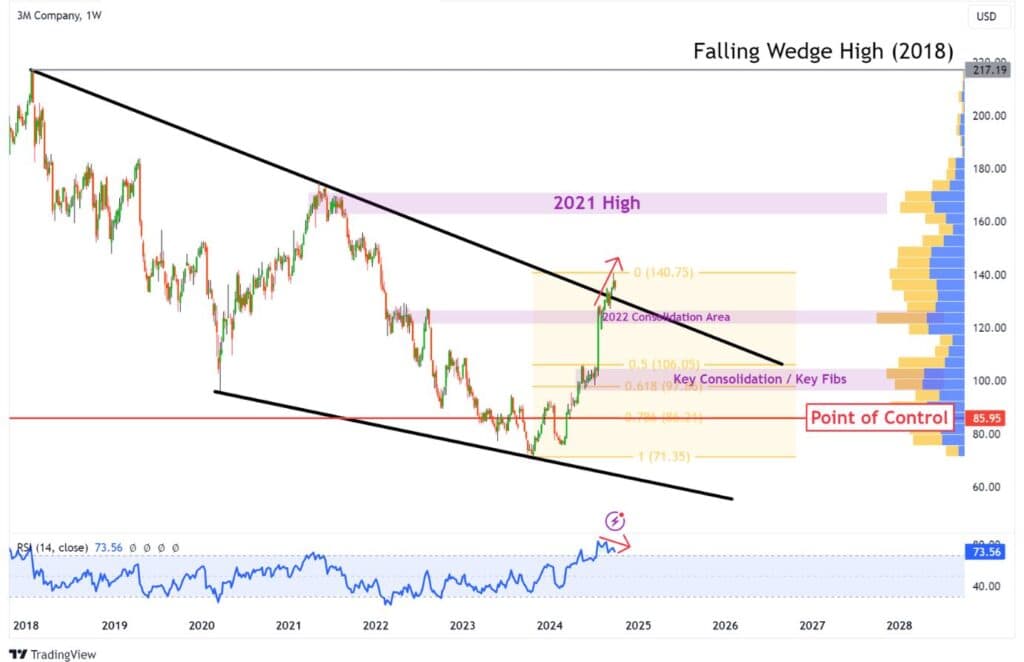
Current Price Action: The current 3M stock has been slowly grinding up, but with clear overbought signs on the RSI indicator and even a weekly bearish divergence. While this suggests a potential reversal on the 3M (MMM) price, there are many key levels below the current $135 region, which could provide support for the price of 3M to continue its rise.
Support Levels: Drawing an anchored volume profile from January 2018, the start of the falling wedge, we can identify several price zones with high trading volume. These high volume areas indicate traders’ interest in transacting at these price points, which lend credence to their ability to act as key support, should the price of 3M revisit them.
| Key Support Levels to Watch on 3M | ||
| 2022 Consolidation Area | $121 – $127 | From May to August 2022, the price of 3M moved in a tight range around these prices. |
| Key Consolidation / Key Fibs | $106.05 (50% Fib)$97.86 (61.8% Fib)$100.50 (Midpoint) | The 50% and 61.8% Fibonacci bullish retracement levels, drawn with the Fib tool from the recent low to high pivot, are aligned here with a significant volume profile node. |
| Point of Control | $85.95 | This is the price point with the highest amount of trading volume since the falling wedge’s formation in 2018. |
Resistance Levels / Target Levels: The volume profile reveals that there aren’t many major resistance levels for the 3M stock. Even if the price of 3M makes a stop at other resistances not mentioned in this analysis, it’s likely to just be a temporary pit stop – although, nothing is 100% for certain.
| Key Resistance Levels to Watch on 3M | ||
| 2021 Highs | $162.62 – $171.35(Absolute high $174.70) | For a significant part of 2021 (March to August), 3M consolidated in this region before declining to new lows in 2023 at $70. |
| Falling Wedge High | $217.19 | The ultimate take profit target of this falling wedge pattern would be the top of the wedge – formed in January 2018. |
Should the aforementioned support levels break, they would then flip into resistance levels to watch.
The marked levels have higher-than-usual trading volume, signalling their importance to traders and investors of 3M. However, keep in mind that 3M can pitstops at minor levels in the chart, such as pivot formed in 2022 (above the current price).
You may also be interested in:
Middle East Tensions and New Zealand’s Rate Cut Shake Up Outlook
USD/CHF On A Steady Downward Path? (Elliott Wave)