What is a Wyckoff Accumulation Pattern?
The Wyckoff Accumulation pattern is a technical analysis concept indicating how large institutional investors accumulate stock, often signalling the end of a downtrend and the start of an uptrend.
This Wyckoff Accumulation pattern includes five distinct phases such as preliminary support, selling climax, automatic rally, secondary test, and the spring or shakeout, which collectively create the accumulation pattern and point to potential price increases. Wyckoff accumulation is just one part of the Wyckoff Method, a larger cycle of buying and selling. We will be discussing Wyckoff distribution in a separate post.
Who is Richard Wyckoff
The Wyckoff Method was discovered by Richard D. Wyckoff in the early 20th century. While working with brokers, Wyckoff wanted to better understand why some traders were making money while others were losing in the stock market. As a result, his work focused on understanding market behaviour and sentiment through patterns of accumulation and distribution. His research led to the development of the Wyckoff Method, a comprehensive approach to understanding market behavior. Wyckoff’s techniques continue to guide traders in identifying significant market trends and reversals to this day.
Wyckoff Methodology in 5 steps
The Wyckoff Method is a description of the entire market cycle for identifying actions of large institutional investors during the accumulation (buying) and distribution (selling) of publicly traded shares. This obviously involves buying and selling. The Wyckoff Methodology offers a structured approach to determine which stocks to trade and the price the trade entry would take place. Here are the five steps the Wyckoff Method offers:
1. Analyse the Current Market Position and Future Trend
This step involves analysing the current market trend and identifying the phase of the market cycle. Wyckoff categorised market trends into four phases: accumulation, markup (uptrend), distribution, and markdown (downtrend).
By studying price and volume patterns, traders can determine if the market is in an accumulation phase (where smart money is buying), a markup (where prices are rising), distribution phase (where institutions are selling), or markdown. This analysis helps predict the probable future direction of the market.
2. Choose Stocks that Match the Market Trend
Once the market trend is identified, the next step is to select individual stocks that align with this trend. During an accumulation phase, traders look for stocks that are also in their own accumulation phases, showing signs of relative strength and the potential for upward movement. Conversely, in a distribution phase, traders focus on stocks that are exhibiting weakness and are likely to decline in price.
Most stocks tend to follow the broader market. This step ensures that stock selections are in harmony with the overall market direction.
3. Identify Stocks Building a Big Enough Base to Fuel A Strong Breakout
Wyckoff’s third step involves calculating the potential price movement based on the size of the base it is building. This step involves careful calculation of individual stocks using Point and Figure charts. Wyckoff discovered that the length of the trading range has an impact on the size of a move following a breakout.
When studying and carefully analysing a stock’s chart, the trader can use the size of the accumulation pattern to estimate a potential price target. As a result, traders will want to select stocks with potentially significant upside or downside, ensuring that the reward justifies the investment.
4. Assess the Stocks’ Readiness for Movement
Wyckoff then provided key signals to determine if a stock was ready to make its move. Within the accumulation phase, traders will look for specific price and volume patterns that indicate the stock is poised for a breakout.
Key signals include broken upward resistance, rallies on increased volume and price declines on reduced volume, completion of specific Wyckoff price patterns such as selling climax, secondary test, and springs. These signals (among others) suggest that the asset is building energy for a substantial price movement.
5. Align Your Trade Timing with Market Turns
The final step in Wyckoff’s process for stock picking is to time the trade entry with a turn in the overall market. This step underscores the importance of aligning individual stock trades with broader market movements.
By entering trades when the market index confirms the anticipated trend, traders can increase the chance of success. This timing involves monitoring market indices for confirmation signals such as breaking key support or resistance levels or exhibiting strong price and volume action in the direction of the trade.
Wyckoff’s Composite Man
When teaching the Wyckoff Method to others, Wyckoff introduced the concept of the “Composite Man” as a way to understand market movements and price behaviour. This heuristic tool helps traders visualise market activity as if it were driven by a single, strategic entity. The Composite Man is a theoretical figure representing the collective actions of large institutional investors and market manipulators and does not represent a single entity, but the concept does make learning the market movements, and patterns a little easier.
Wyckoff’s idea of the Composite Man is rooted in the observation that large operators carefully plan and execute their trading strategies to maximise profits. They accumulate shares quietly and sell them at rising prices, often manipulating the market to create favourable conditions for their trades.
Wyckoff advised traders to approach the market with the mindset of the Composite Man, which involves a couple key principles:
- Strategic Planning: The Composite Man meticulously plans his trading campaigns. He accumulates shares over time without significantly impacting the price. Once his position has been accumulated, his goal is to drive the price up to attract public interest. Understanding this process helps smart money traders identify accumulation phases, where smart money is building positions.
- Market Manipulation: To create the illusion of a continued downtrend or a bullish breakout, the Composite Man conducts numerous transactions, making it appear as if there is widespread interest in a particular stock. In the case of the downtrend, the Composite Man creates a bear trap to mislead retail traders and shake out weak hands. Composite Man will also use the bullish breakout to attract retail investors, allowing the Composite Man to sell his shares at higher prices.
Composite Man operates in large volumes and leaves a trail on the price charts. Traders should study stock charts to discern the actions of the Composite Man. By analysing price and volume patterns, traders can identify accumulation and distribution phases to help estimate future price movements. Key patterns, such as springs (false breakouts) and upthrusts (false breakdowns), indicate manipulation and signal potential trading opportunities. Wyckoff emphasised the importance of understanding the motives behind price actions.
By aligning their trades with the actions of the Composite Man, traders can improve their chances of more consistent trading.
Wyckoff Price Cycle
According to Richard D. Wyckoff, the market’s movements can be understood and anticipated through a detailed analysis of supply and demand, which is central to the Wyckoff market cycle. Supply and demand can be observed by studying price action and volume.
Wyckoff’s insights were shaped by his experience as a broker, where he closely observed the activities of influential traders and institutions that dominated specific stocks. By employing vertical (bar) and Point and Figure charts, Wyckoff was able to decode the strategies and future intentions of these major market players.
Wyckoff conceptualised the market in terms of a price cycle, which he divided into distinct phases: accumulation, markup, distribution, and markdown. Each phase reflects the behaviour of large interests as they prepare for and execute their market strategies.
Accumulation Phase
The accumulation phase marks the beginning of the price cycle. During this period, large investors, or the Composite Man, quietly build substantial positions in a stock without driving up the price. This phase is characterised by a trading range where the stock’s price moves sideways. Key signals of accumulation include increasing volume on up days and decreasing volume on down days, indicating that strong hands are absorbing supply from weaker hands.
Markup Phase
Once accumulation is complete, the market enters the markup phase. This is when prices start to rise as demand outstrips supply. The Composite Man begins to advertise his stock, creating an appearance of strength and attracting public interest. This phase is characterised by higher highs and higher lows, with significant price increases often accompanied by strong volume. Traders aim to enter long positions towards the end of the accumulation phase to capitalise on any subsequent expected markup.
Distribution Phase
Following the markup phase, the market enters the distribution phase. Here, the Composite Man gradually sells off his accumulated shares to the public at higher prices. This phase is marked by another trading range where prices move sideways or slightly upwards. During distribution, there is a noticeable increase in volume on down days, signalling that large interests are offloading their positions. Traders should be cautious and look for signs of weakness and increased selling pressure. During the distribution phase, upthrusts can be sold.
Markdown Phase
The final phase of the Wyckoff price cycle is the markdown phase. As the distribution phase concludes, the market enters a period of declining prices. Supply overwhelms demand, leading to lower highs and lower lows. The Composite Man has successfully distributed his holdings, and the market sentiment turns bearish. This is the time for traders to consider short positions, anticipating further price declines. Volume typically increases on down days during this phase, confirming selling pressure in the declining trend.
By understanding these phases and of the Wyckoff price cycle, traders can better anticipate market movements and identify optimal entry and exit points. The key lies in recognising the signs of accumulation, markup, distribution, and markdown, and aligning one’s trading strategy with the underlying market dynamics.
Three Wyckoff Laws
Richard D. Wyckoff formulated three foundational laws that are central to his method of technical analysis. These laws—supply and demand, cause and effect, and effort versus result—provide a framework for understanding and predicting market movements.
The Law of Supply and Demand
This law is the cornerstone of Wyckoff’s methodology. It states that the price of an asset moves according to the balance between supply (selling pressure) and demand (buying pressure). When demand exceeds supply, prices rise; when supply exceeds demand, prices fall. By analysing price and volume data, traders can gauge whether supply or demand is dominant and make informed trading decisions. For instance, a significant price increase accompanied by high volume suggests strong demand and likely further price appreciation.
The Law of Cause and Effect
Wyckoff’s second law explains that market movements are the result of prior accumulation (cause) and distribution (effect). The length and depth of a price trend can be anticipated by measuring the horizontal price movement within a trading range. This law helps traders set price targets by analysing the “cause” built during accumulation or distribution phases. For example, a prolonged accumulation phase within the accumulation trading range can lead to a substantial price increase once the markup phase begins.
The Law of Effort Versus Result
The law of effort and result are about a result (output) that matches the effort (input).
Volume is viewed as the effort. When effort is high, the resulting trend is believable. If the volume is low, then the trend, regardless of what it is, cannot be relied on.
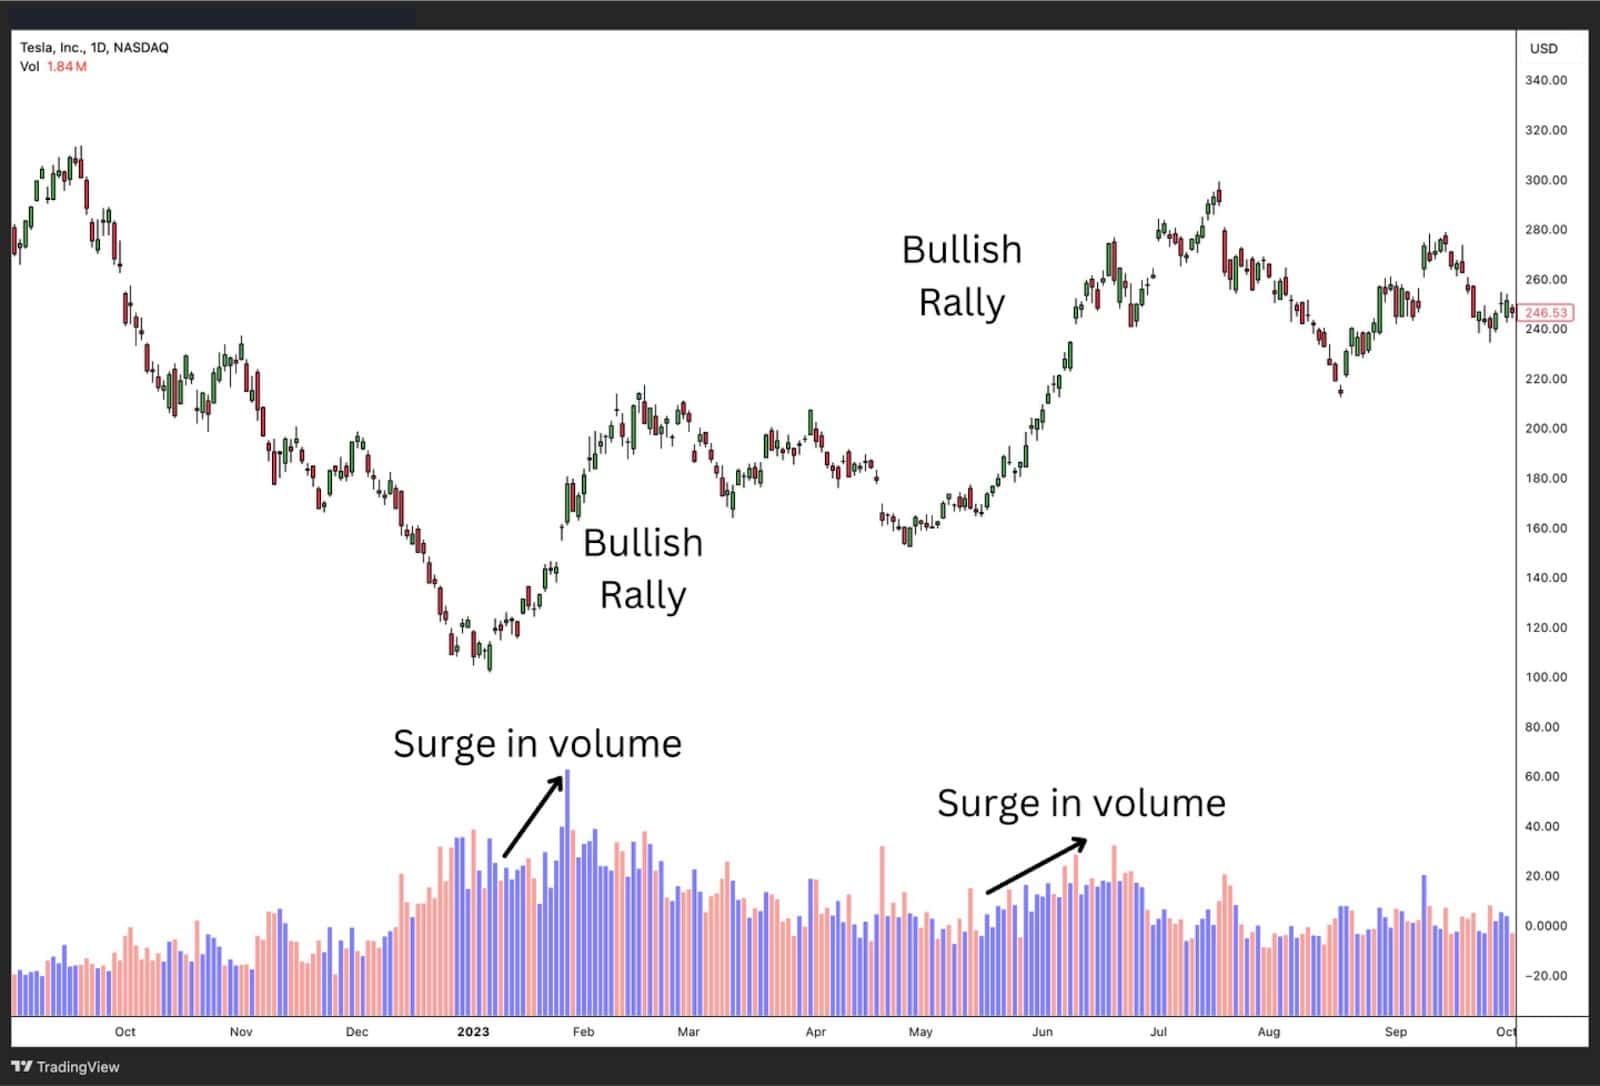
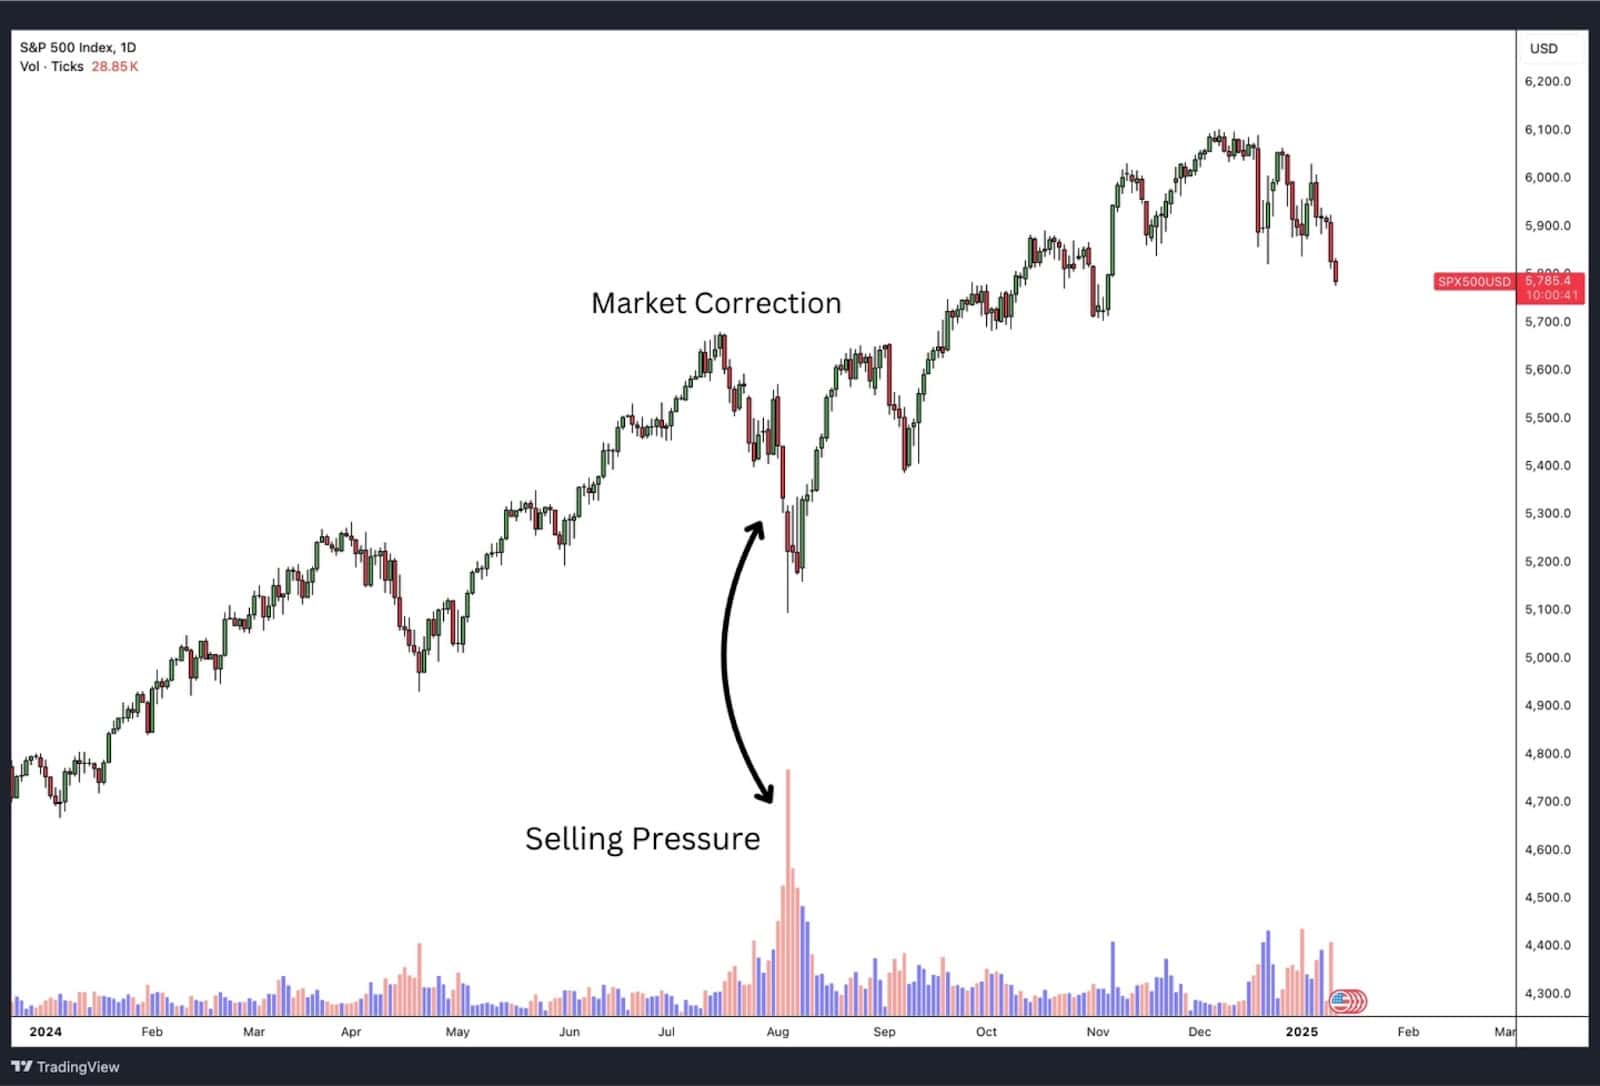
In the first chart, we see a bullish rally accompanied by a surge in volume, which aligns with Wyckoff’s Law of Effort Versus Result. The increasing volume (effort) drives the price higher (result), confirming strong buying interest and momentum. This suggests that demand is in control, pushing the trend upwards efficiently.
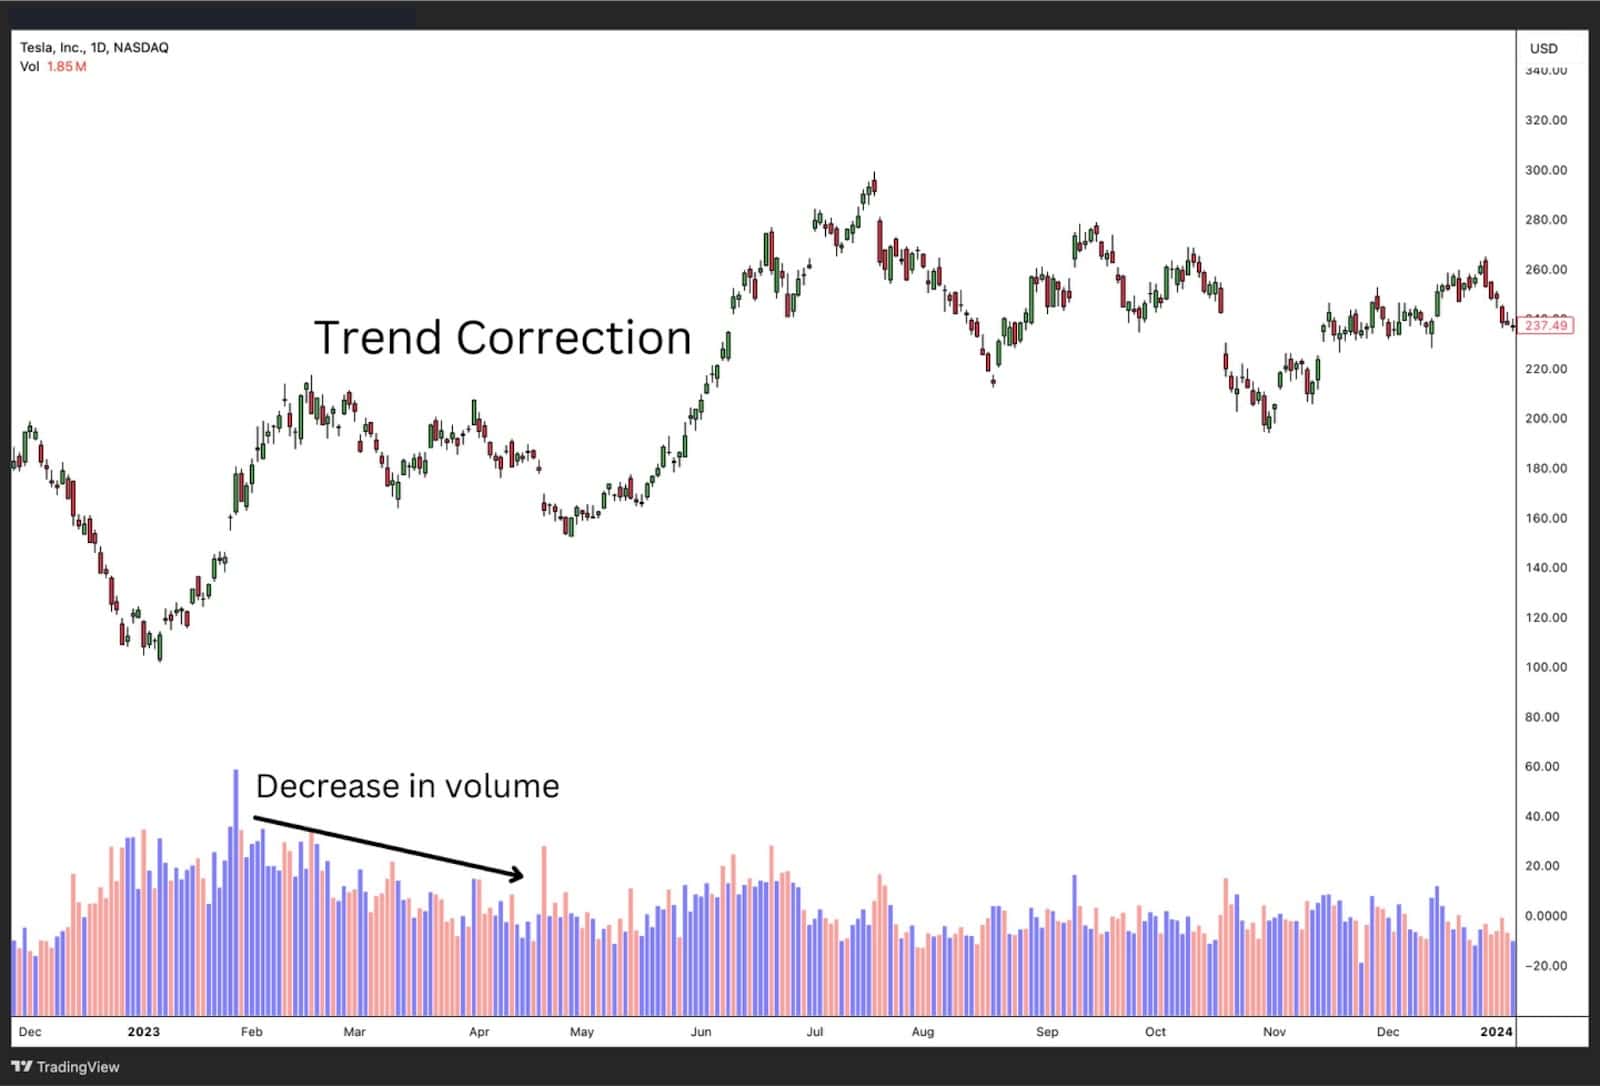
However, in the second chart, as the rally stalls and the market enters a corrective phase, we notice a decline in volume, including more red bars. This indicates weakening effort—buyers are less aggressive, and sellers are starting to step in. However, the overall volume is fading which suggests the corresponding trend is unreliable.
In the chart above, the lower volume signals that the trend may need a pause or reverse prior to resuming higher. Understanding these shifts helps traders anticipate potential turning points in the market.
Analysing the Wyckoff Accumulation Process
The Wyckoff Accumulation process is an important component of the Wyckoff Method as it provides traders with valuable insights into market dynamics and trading strategies. Understanding this process can help traders identify trading opportunities within the accumulation phase.
Psychology of Accumulation – Understanding Selling Pressure and Smart Money
In the Wyckoff Accumulation process, selling pressure refers to the downward force exerted on stock prices as sellers dominate the market. This pressure often results in panic selling by weaker market participants. On the other hand, smart money, typically large institutional investors, strategically absorb this selling pressure, positioning themselves for future gains as they anticipate an eventual price rise. Recognizing the interplay between selling pressure and smart money is key to understanding the accumulation phase.
Price Action Analysis Techniques
Analyzing price action involves studying the historical price movements of an asset to predict its probable future trend. Traders use this analysis to identify key price levels, such as support and resistance, which are crucial for making informed trading decisions. By examining price trends, traders can anticipate market movements and align their strategies with the overall market dynamics.
Identifying Key Price Levels
Key price levels, including support and resistance, play a significant role in the Wyckoff Accumulation process. Support levels are areas where buying interest emerges, preventing further price declines, while resistance levels are points where selling pressure halts upward price movements. Identifying these levels helps traders navigate the trading range effectively and where institutional investors may be accumulating. Volume analysis is often used alongside price levels to confirm price movements as institutional investors buy in large volumes leaving behind tracks of their behavior.
Volume Analysis
Volume analysis is a critical tool in the Wyckoff Accumulation process, as it reveals the intensity of buying and selling activities. By examining trading volume patterns, traders can confirm price movements and identify shifts in market sentiment. Volume expansion during rallies and contraction during reactions can signal the absorption of selling pressure, indicating a potential transition to the markup phase.
Market Structure
Understanding market structure is essential for successfully navigating the Wyckoff Accumulation process. The market structure encompasses the overall arrangement of price trends, trading ranges, and volume patterns. By recognizing these elements, traders can better predict price direction and make informed trading decisions. The Wyckoff Accumulation process emphasizes the importance of aligning trading strategies with market structure to capitalize on sound risk management and achieve successful trades.
How to Identify the Wyckoff Accumulation Pattern?
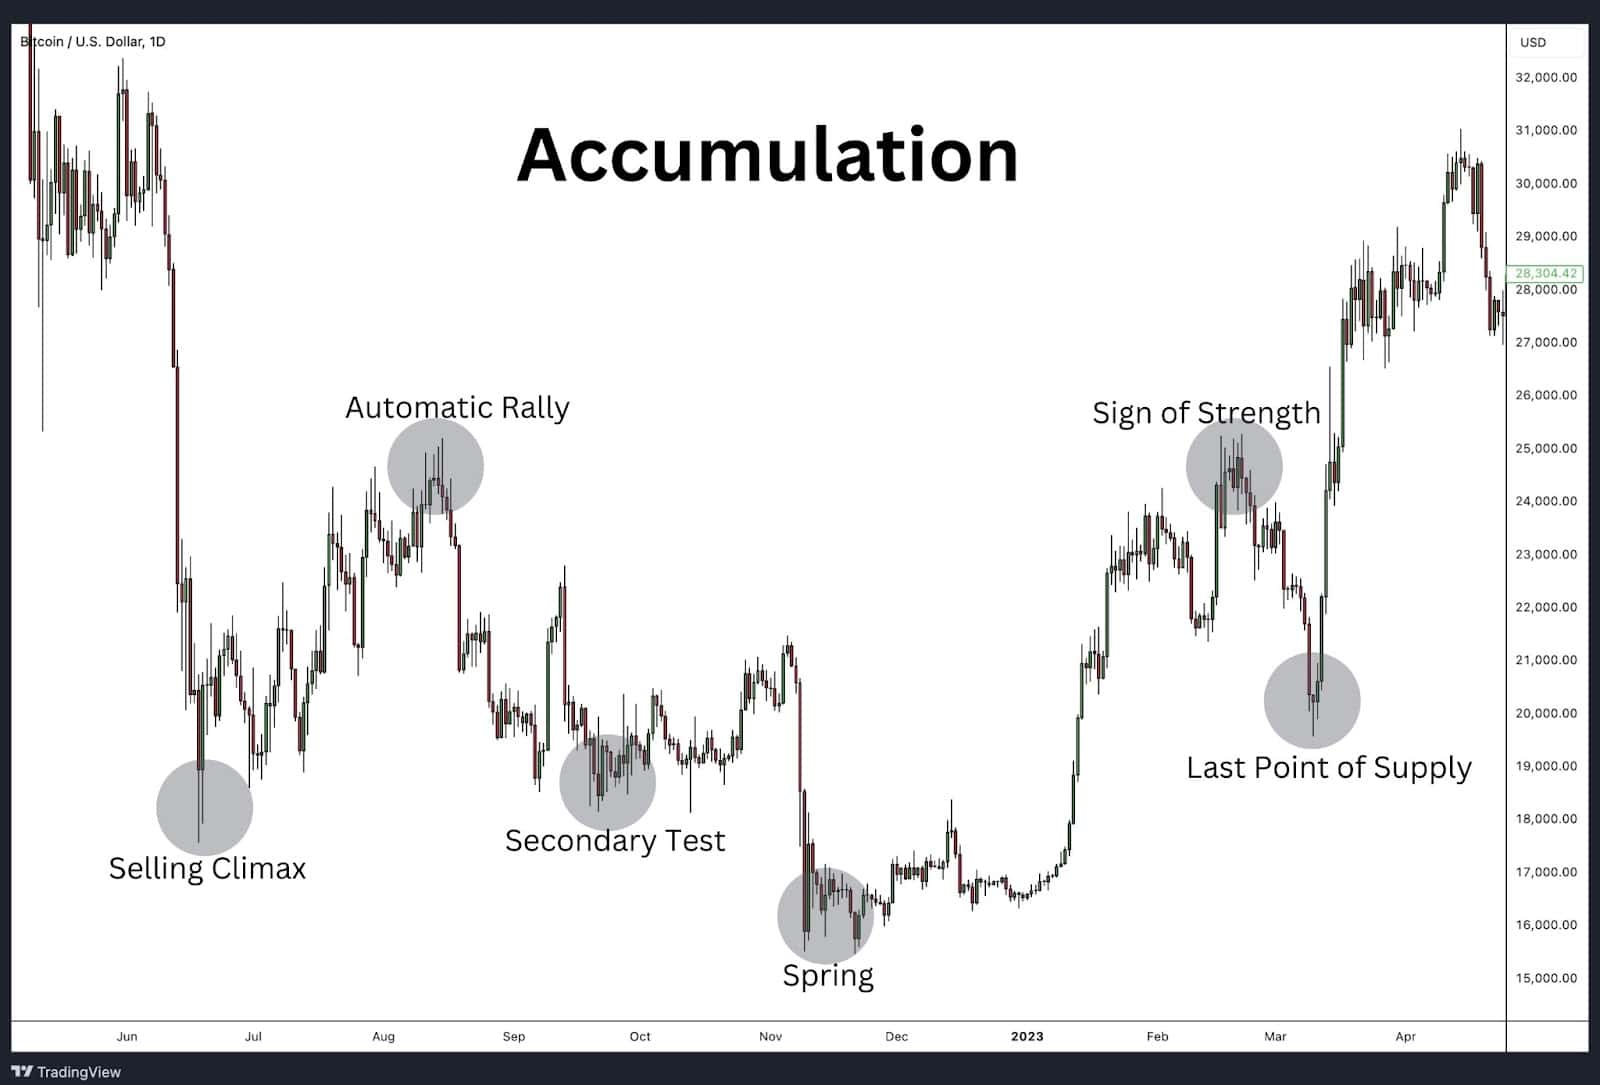
There are a few road markers that help identify the Wyckoff Accumulation chart pattern. You’ll find them identified on the chart above.
A. Selling Climax, Automatic Rally, and Secondary Test:
- The selling climax marks intense selling absorbed by smart money, leading to a sharp decline followed by a significant rebound.
- The automatic rally is a short-term upward movement due to reduced selling pressure.
- The secondary test revisits the selling climax area to test supply and demand balance, typically showing higher lows, indicating diminishing selling pressure.
B. Secondary Test Phase B:
- The secondary test in phase B confirms the stability of the trading range with diminishing selling pressure.
C. Spring and Sign of Strength:
- The spring is a false breakdown below support, shaking out weak hands before the price moves higher.
- The sign of strength is a strong upward movement, indicating demand dominance.
D. Last Point of Supply:
- The last point of supply is a final test of the trading range, showing readiness for a sustained markup.
E. Rally to the Upside:
- The rally to the upside confirms the breakout from the trading range with increased volume and price movement, starting a new uptrend.
Remember, after the accumulation phase comes the markup. So the series of patterns above would then lead to an imbalance of buyers and sellers causing the price to rally higher.
Key Characteristic of Wyckoff Accumulation Pattern
The Wyckoff Accumulation pattern is a phase where large institutional investors accumulate stock without significantly affecting the price. Recognizing this pattern involves understanding several key characteristics:
Preliminary Support
- Preliminary support occurs when substantial buying halts the downward movement of prices. This support level sets the stage for the accumulation phase by indicating that smart money is beginning to absorb shares.
Trading Range
- During the trading range, prices move sideways between established support and resistance levels. This range signifies a period of consolidation where large investors continue to build their positions.
Absorption of Selling Pressure
- As the accumulation phase progresses, selling pressure diminishes. This is indicated by decreasing volume on down days and increasing volume on up days, suggesting that smart money is absorbing the available supply.
Markup and Breakout
- The accumulation phase culminates in a breakout above the resistance level, often accompanied by increased volume and strong upward price movement. This breakout marks the transition to the markup phase, where prices begin to rise more significantly as demand outpaces supply.
Importance of Wyckoff Accumulation Pattern
The Wyckoff Accumulation pattern is important to understand for several reasons:
1. Identifying Market Bottoms: The Wyckoff Accumulation Pattern helps traders and investors identify the end of a downtrend and the formation of a market bottom. By recognizing the key phases of accumulation, such as preliminary support, trading range, and the absorption of selling pressure, market participants can anticipate potential reversals and prepare for upcoming bullish trends. This identification is crucial for entering positions at favourable prices and maximising profit potential as the market transitions to an uptrend.
2. Insight into Institutional Activity: The pattern provides a window into the actions of large institutional investors, often referred to as “smart money.” Institutions have the resources and influence to move markets, and their buying activities during the accumulation phase signal their confidence in the stock’s future performance. By analysing the Wyckoff Accumulation Pattern, traders can align their strategies with those of these powerful market players, potentially increasing their chances of success.
3. Risk Management: Recognizing the Wyckoff Accumulation Pattern aids in effective risk management. By identifying key support and resistance levels within the trading range, traders can set stop-loss orders and manage their trades more effectively. The pattern’s phases also offer clear signals for entry and exit points, reducing the uncertainty and emotional decision-making often associated with trading.
4. Forecasting Price Movements: The Wyckoff Accumulation Pattern is instrumental in forecasting future price movements. The transition from accumulation to markup phases indicates a shift from supply dominance to demand dominance, suggesting that prices are likely to rise. This predictive power enables traders to position themselves advantageously before significant price increases occur, thereby capitalising on the early stages of a bull market.
The Wyckoff Accumulation Pattern is a powerful tool for understanding market and smart money behavior of the small retail trade and large institution. The pattern also allows the trader to forecast price movements and implement effective risk management strategies.
Wyckoff Accumulation Pattern Examples
Tesla Inc. (TSLA) – Weekly Timeframe
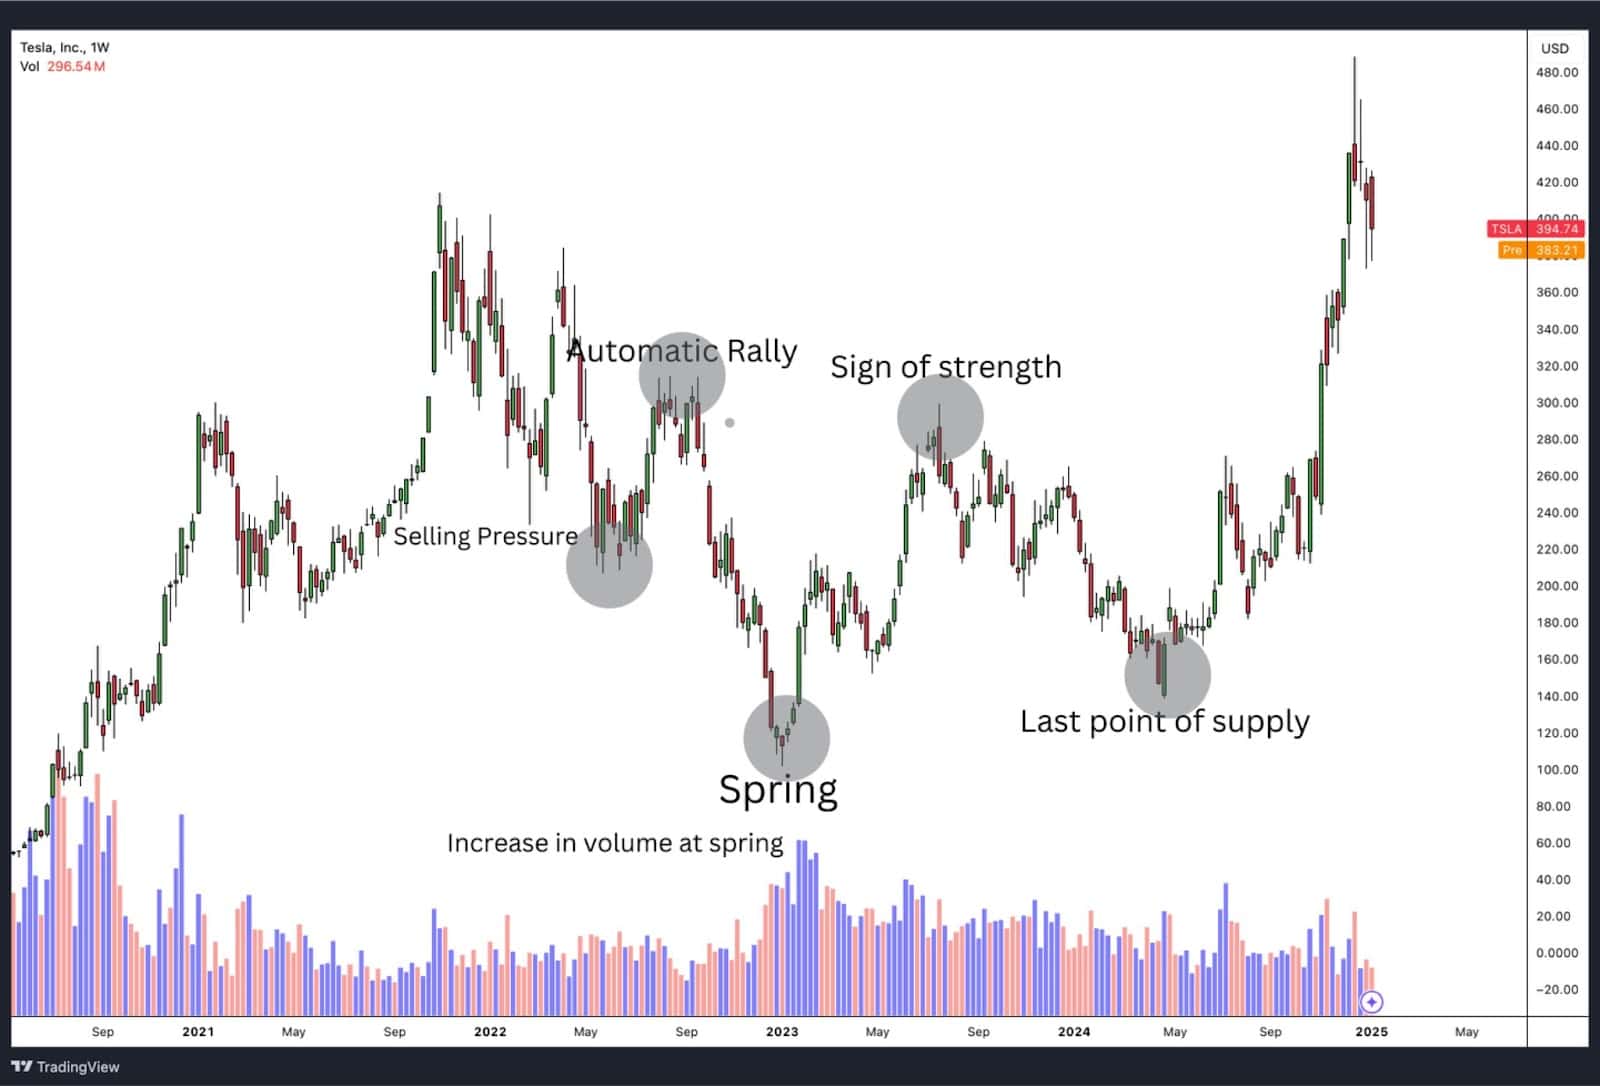
Between 2022 and late 2024, Tesla Inc. (TSLA) displayed a classic Wyckoff Accumulation chart pattern on the weekly chart. The pattern began with selling pressure, culminating in a Selling Climax (SC), where high volume indicated institutional absorption. This was followed by an Automatic Rally (AR), which defined the upper boundary of the trading range. A pivotal Spring occurred in early 2023, with the price briefly breaking below support, trapping bearish traders before rebounding sharply, confirmed by a volume spike. Following the Spring, the price formed a Last Point of Support (LPS), where a retest of support showed diminished selling pressure. Finally, a Sign of Strength (SOS) occurred in late 2024, with the price breaking above resistance on strong volume, marking the transition into the markup phase and the start of a sustained uptrend. This pattern provided clear evidence of accumulation by smart money and several low-risk trading opportunities.
Gold Spot/USD – Weekly Timeframe
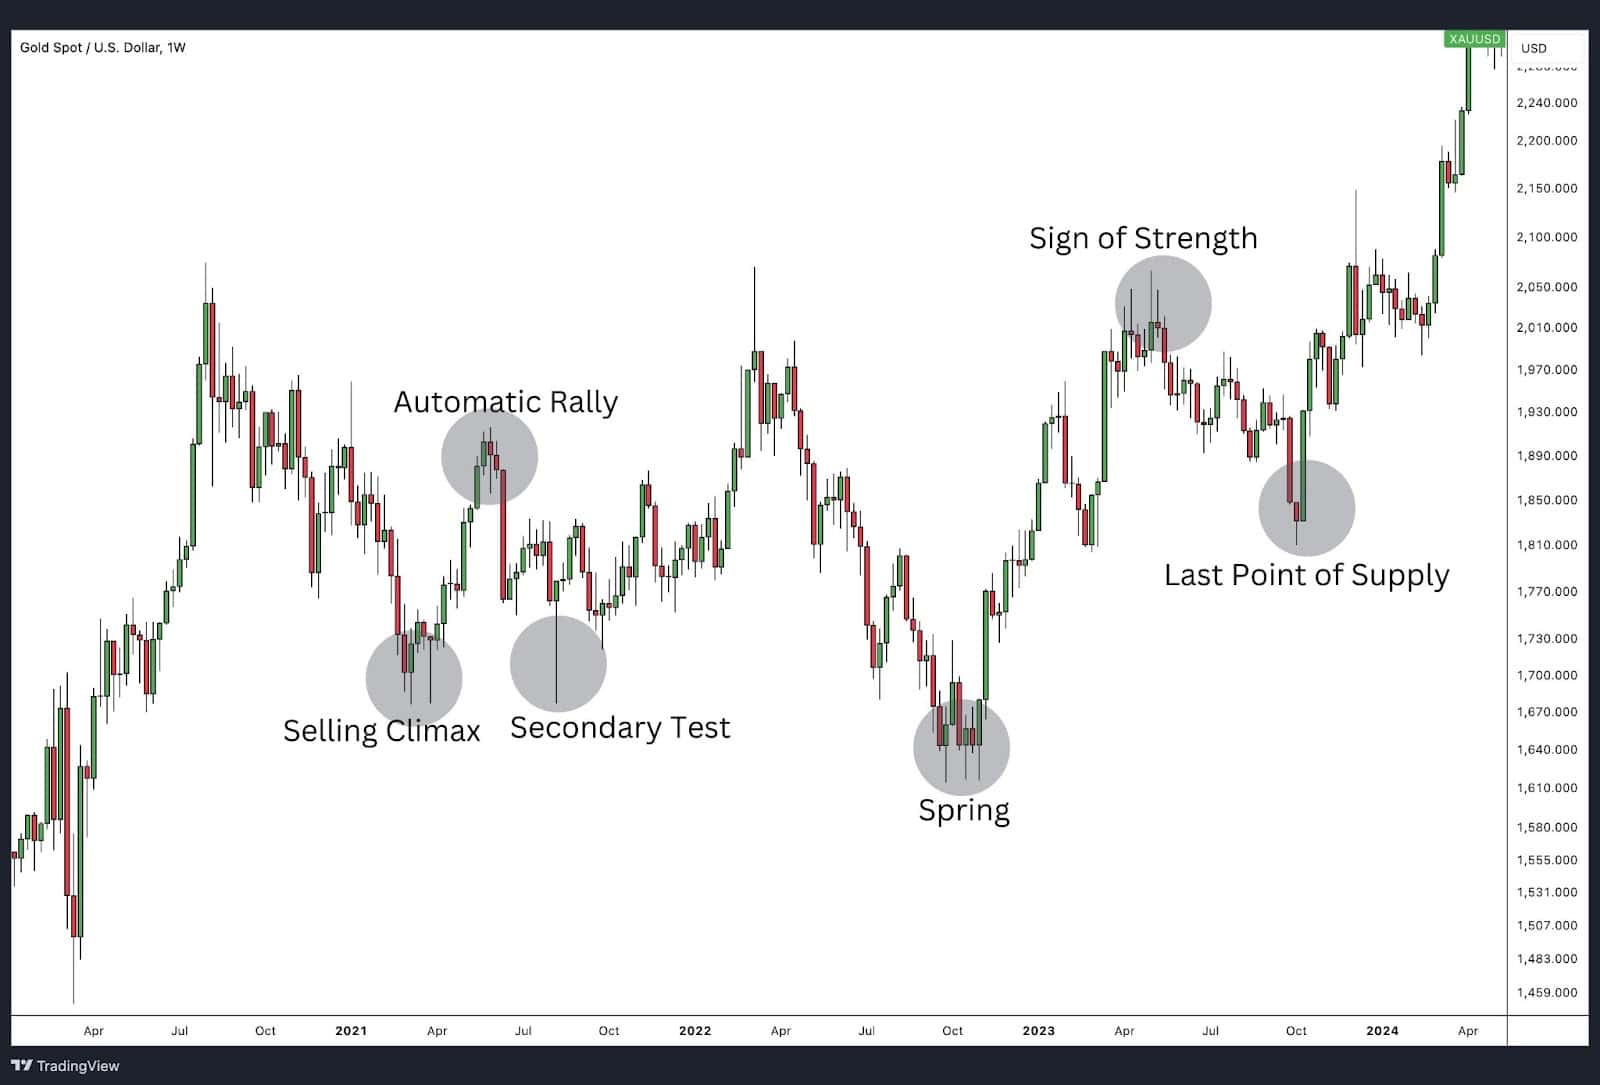
Gold showed an accumulation phase from early 2021 to late 2023. This phase was marked by sideways trading, reduced volatility, and key support levels. The accumulation phase ended with a breakout, leading to a strong upward trend as gold prices surged.
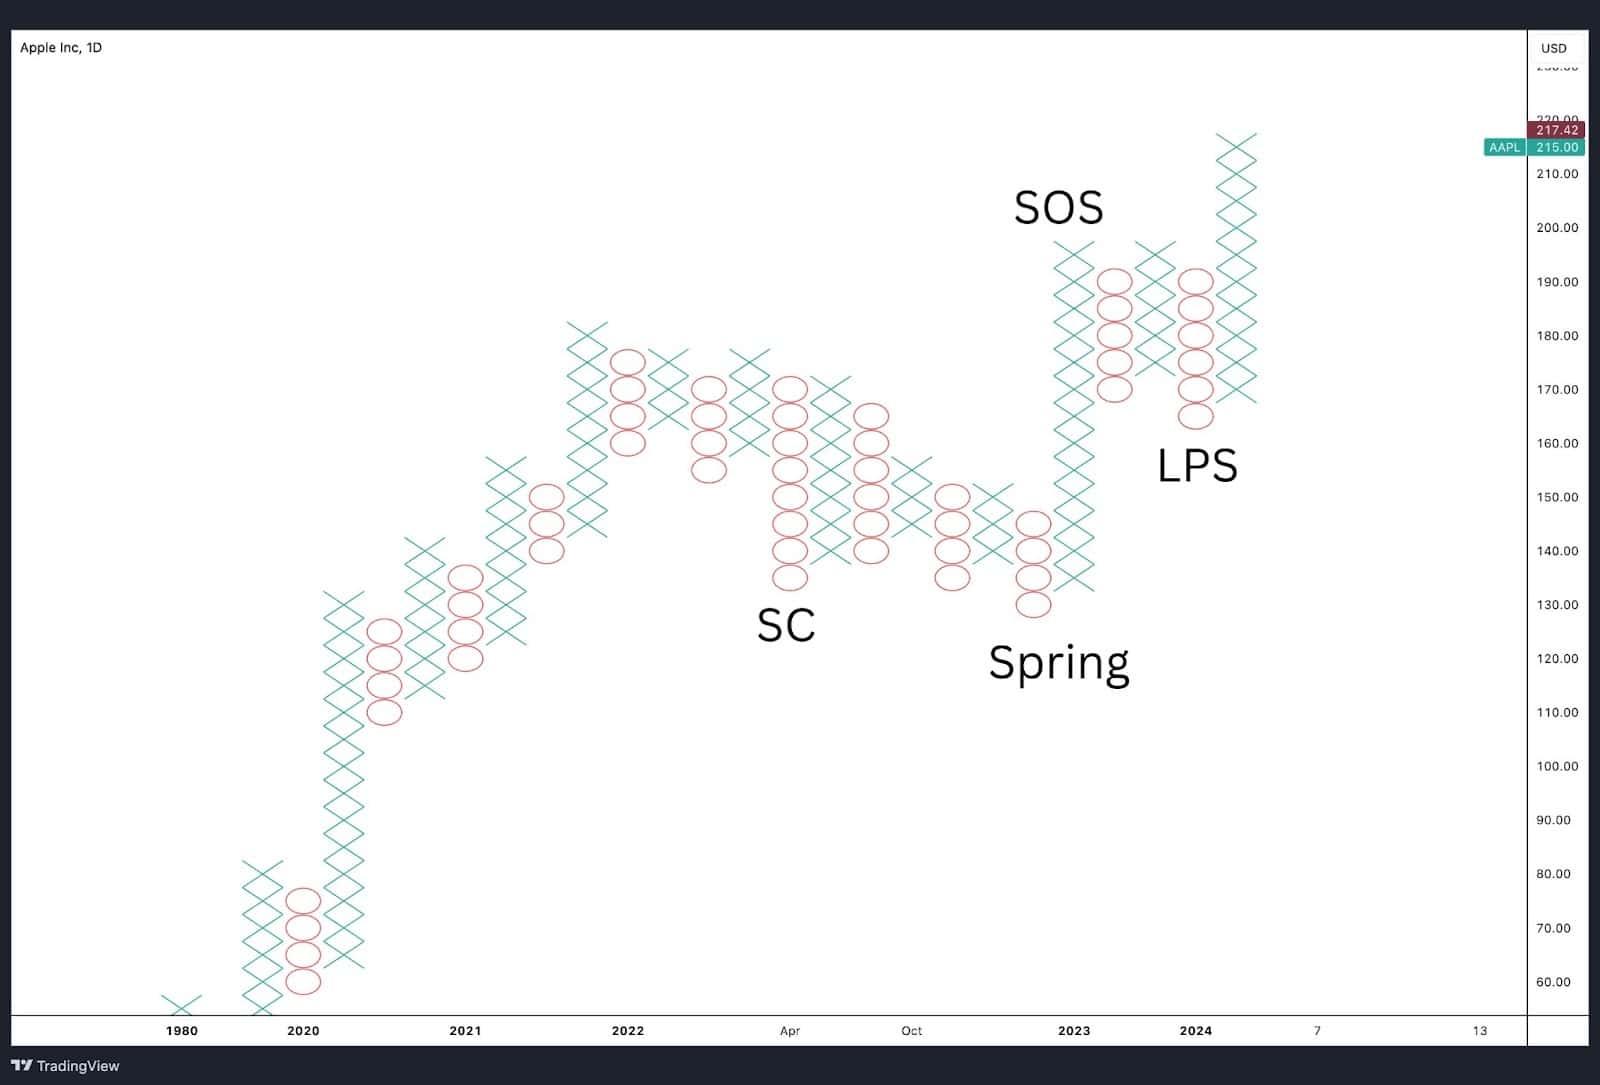
Apple (AAPL) – H4 Timeframe
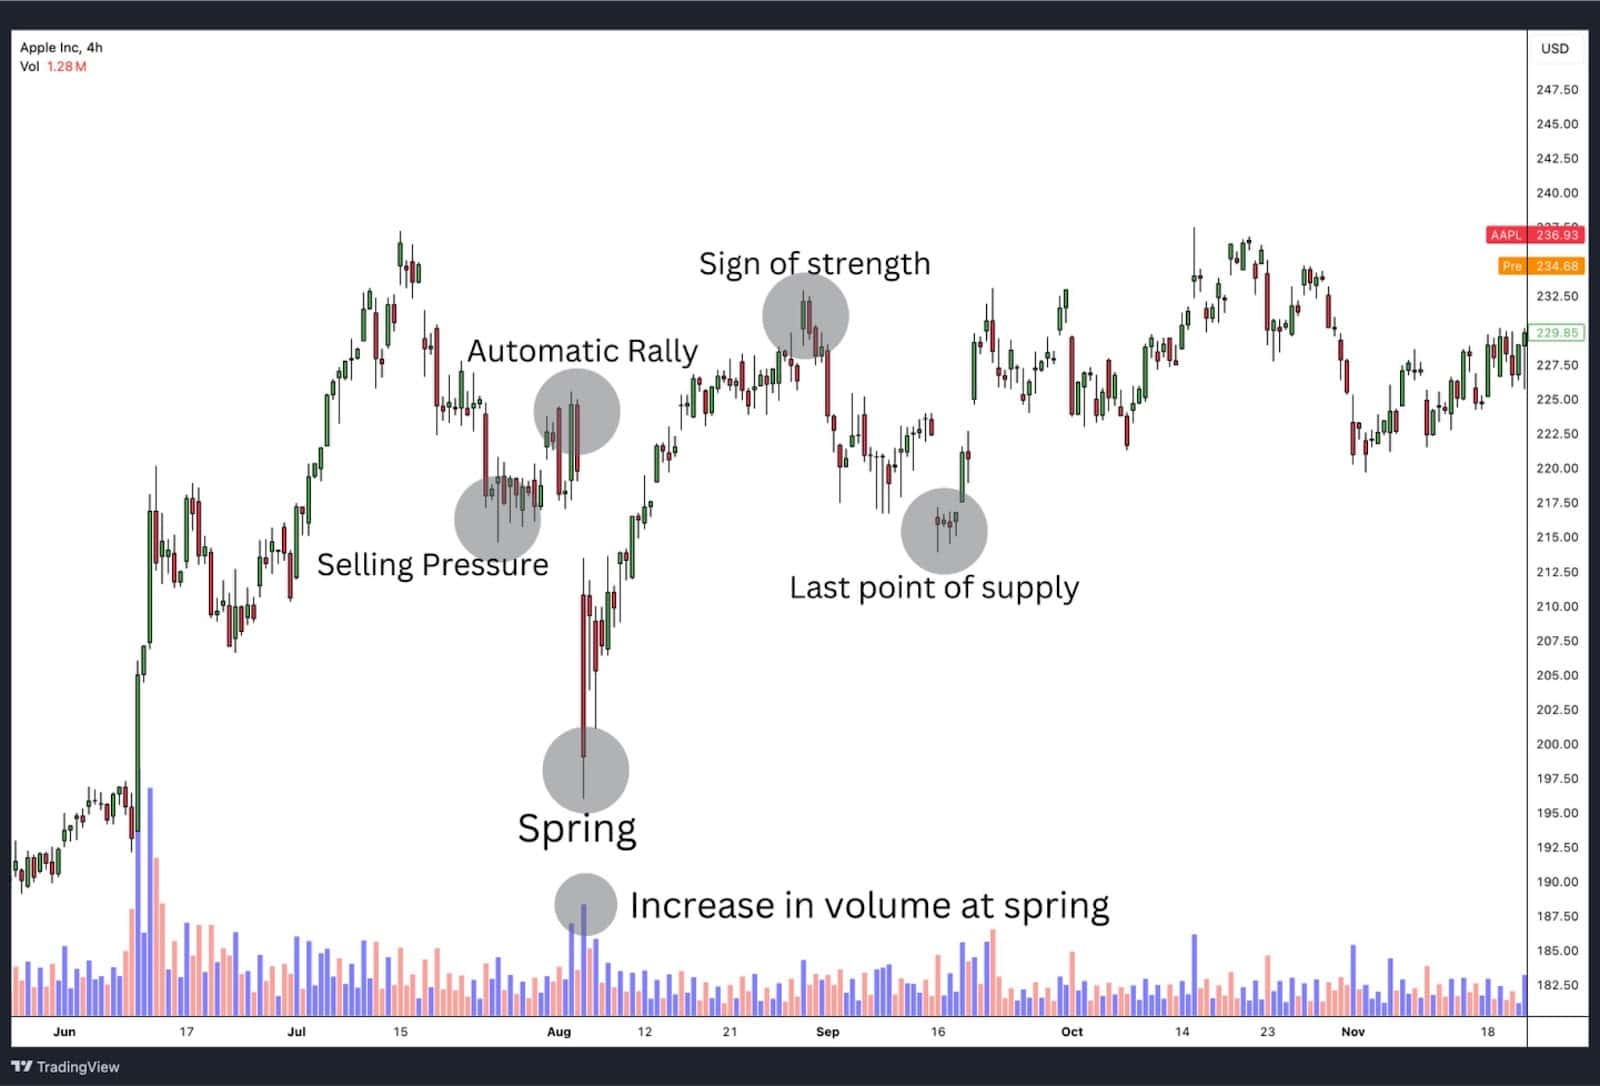
Between June and November 2023, Apple Inc. (AAPL) exhibited a classic Wyckoff Accumulation Pattern. The sequence began with selling pressure leading to a Selling Climax (SC), followed by an Automatic Rally (AR) marking the trading range. A Spring occurred with a false breakdown below support, confirmed by a volume spike, before the price reclaimed support. After a Last Point of Support (LPS) retest, the price surged in a Sign of Strength (SOS), breaking resistance with high volume and transitioning into the markup phase. This pattern provided clear signals of accumulation and a strong uptrend.
Microsoft (MFST) – H4 Timeframe
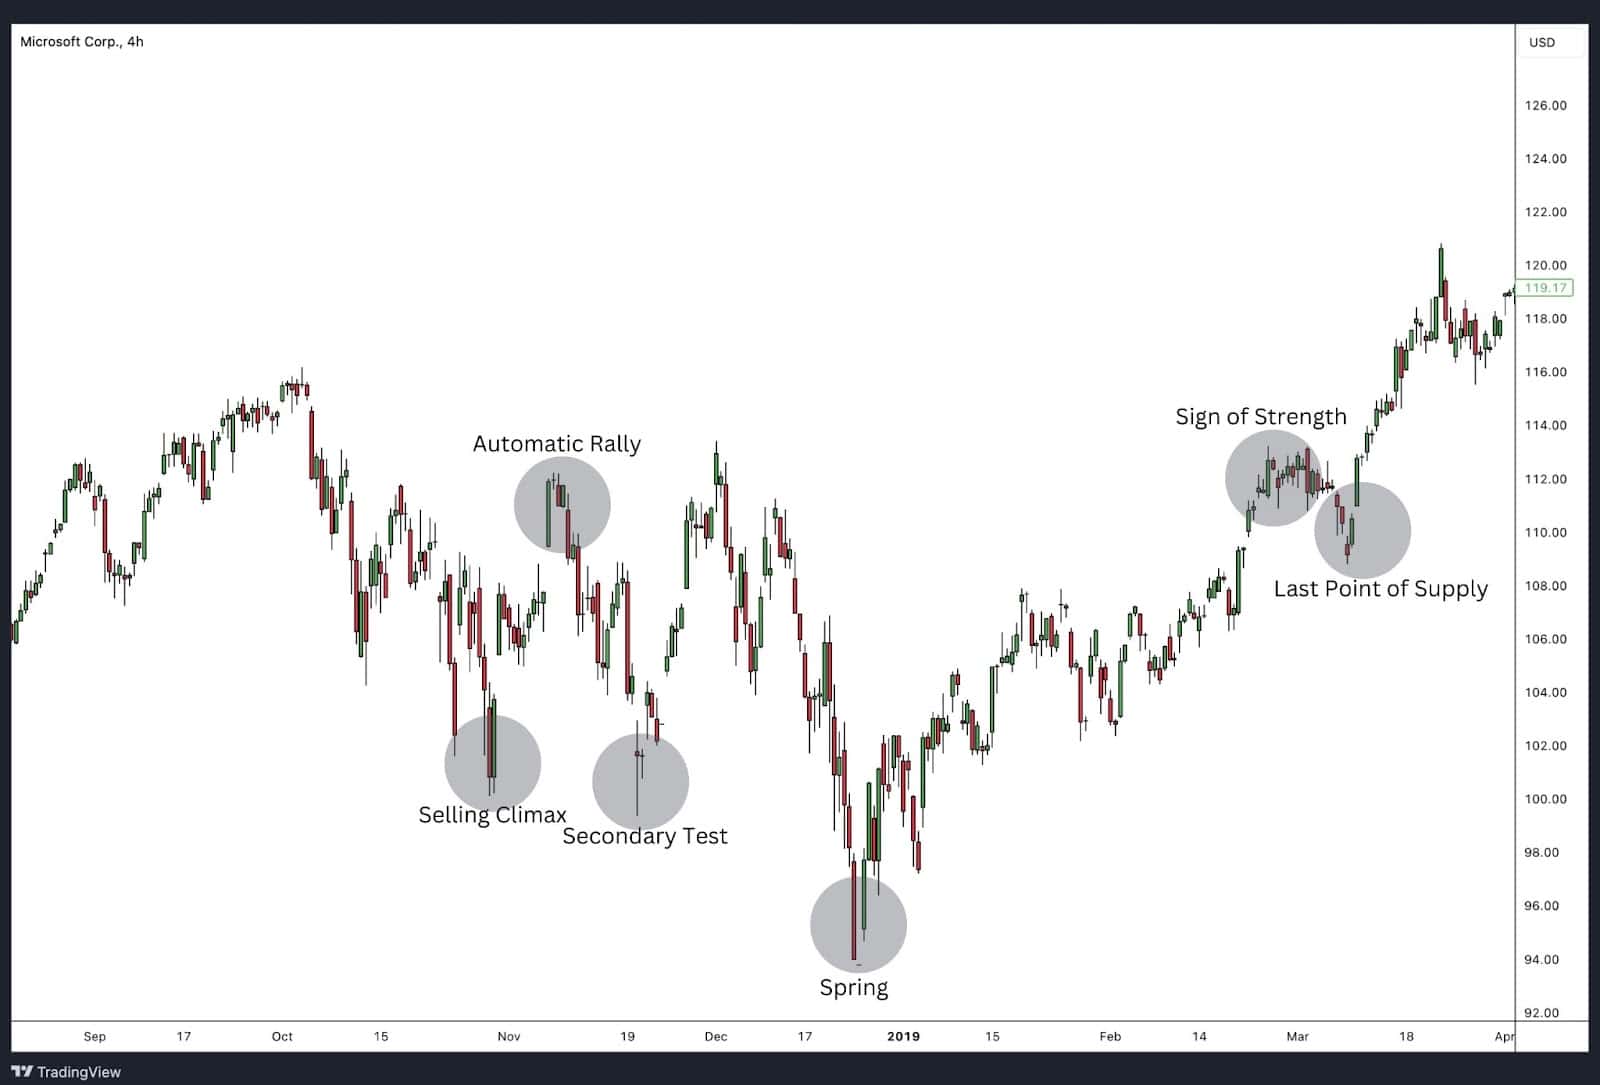
The chart illustrates Microsoft’s Wyckoff Accumulation Phase from late 2018 to early 2019. The sequence begins with a Selling Climax in October, followed by an Automatic Rally in November, which sets the range’s resistance. The Secondary Test in November confirms support. A Spring in January 2019 shakes out weak holders, leading to a Sign of Strength in February. Finally, the Last Point of Supply in March indicates the start of the markup phase, confirming accumulation.
Wyckoff Accumulation Pattern Trading Strategies
The Wyckoff Accumulation Pattern provides traders with a structured approach to identify optimal trading opportunities during periods of accumulation. By leveraging price action, volume, and specific trading strategies, traders can take advantage of the market dynamics within this pattern. Here are two effective strategies to trade the Wyckoff Accumulation Pattern:
1. Buying the Dip on the Spring
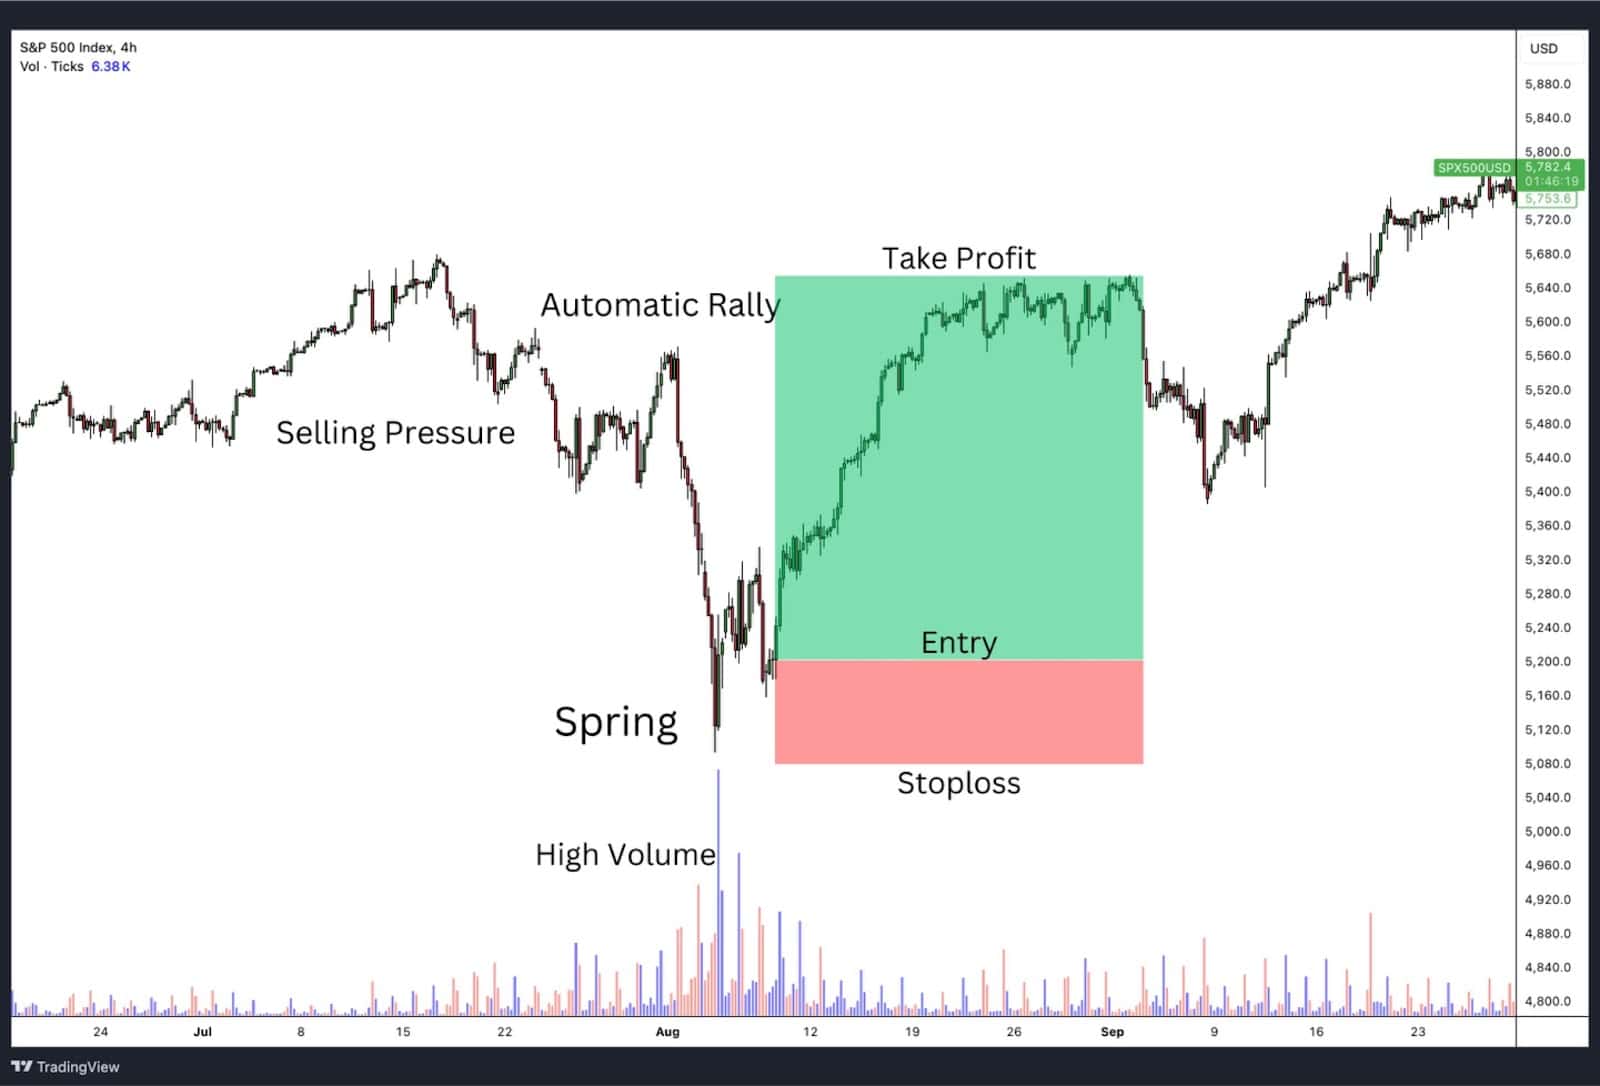
The Spring is a pivotal moment in the Wyckoff Accumulation Pattern, characterized by a false breakdown below the support level, designed to trap bearish traders. This phase provides an excellent buying opportunity when combined with proper volume analysis and technical indicators.
How to Trade the Spring:
- Entry Criteria:
- Watch for a price drop below the support level, followed by a quick recovery back into the trading range.
- Confirm the Spring with a volume spike during the breakdown and subsequent recovery.
- Entry Point:
Enter the trade once the price closes back above the support level, confirming the Spring as valid. - Stop-Loss (SL):
Place the stop-loss just below the lowest point of the Spring to protect against further downside risk. - Take-Profit (TP):
Target the resistance level within the trading range or the expected breakout level during the markup phase.
2. Buying a Breakout Above Resistance After the Spring
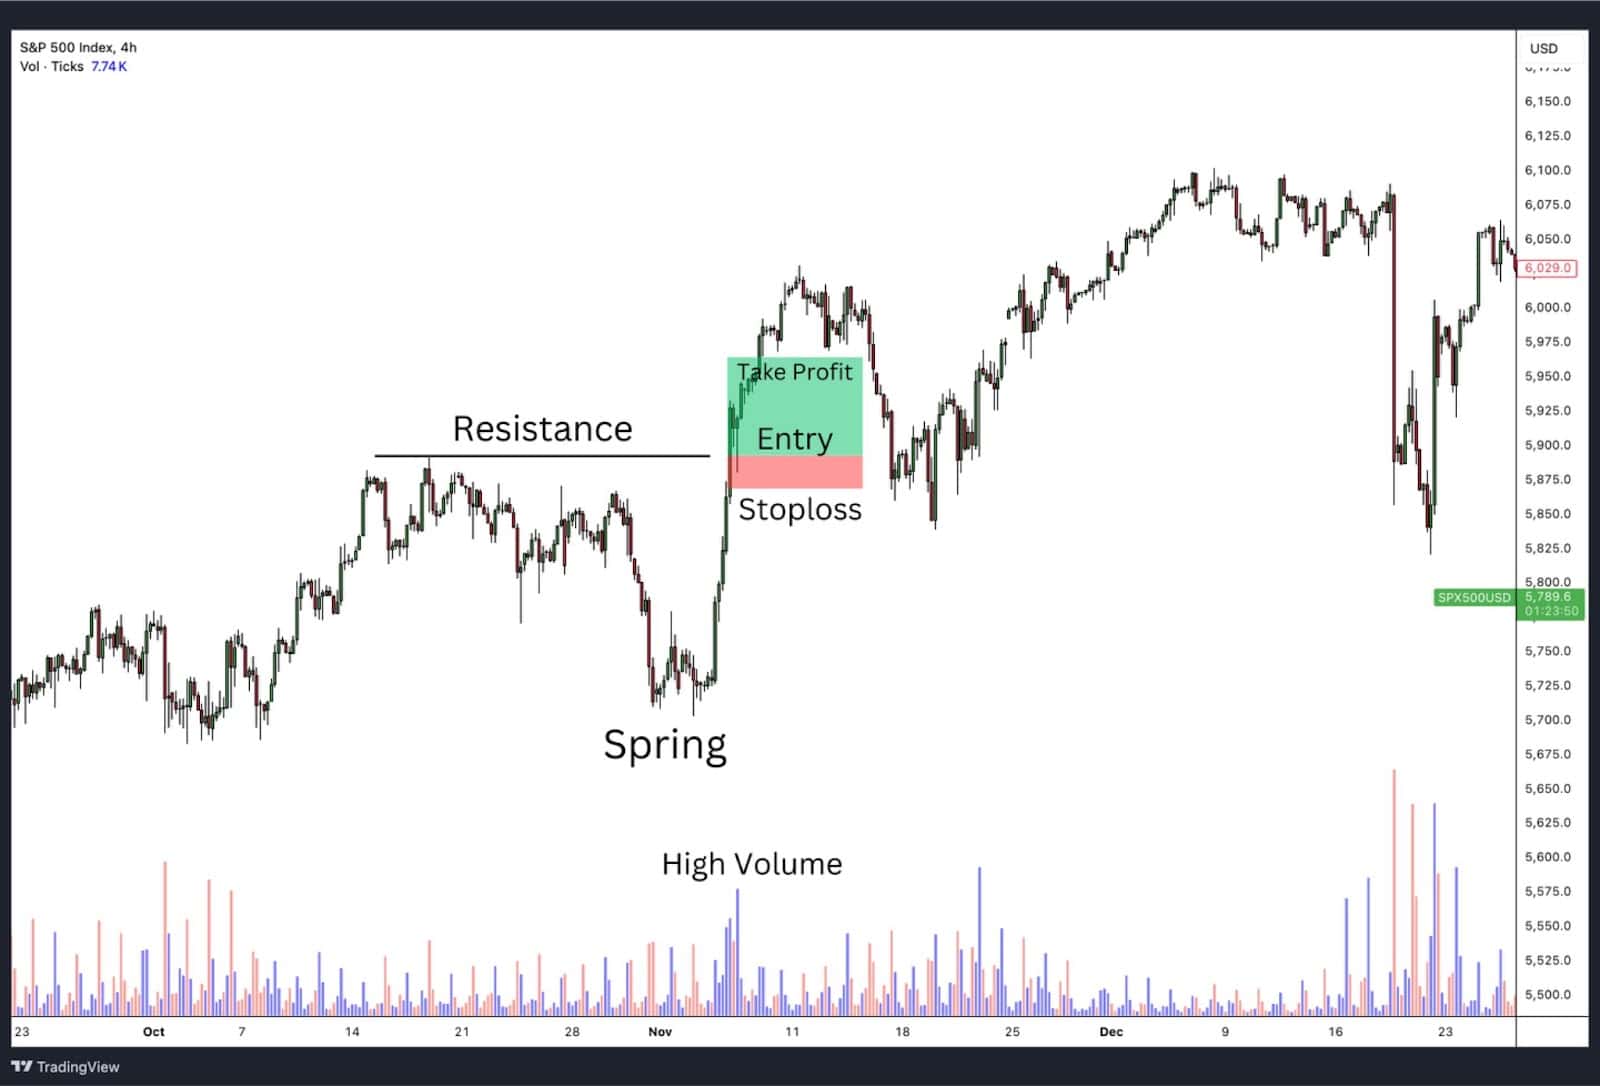
After the Spring, a breakout above the trading range’s resistance often signals the start of the markup phase. This breakout is an ideal entry point for traders.
How to Trade the Breakout:
- Entry Criteria:
- Wait for the price to break and close above the resistance level.
- Confirm the breakout with higher-than-average volume.
- Entry Point:
Enter the trade after the breakout is confirmed by the price closing above resistance. - Stop-Loss (SL):
Place the stop-loss just below the resistance level, which now serves as support. - Take-Profit (TP):
Use the height of the trading range to estimate the price target or set a specific reward-to-risk ratio (e.g., 3:1).
Wyckoff Accumulation Schematics
The Wyckoff Accumulation Schematic outlines the process through which institutional investors accumulate a stock over time, preparing for a significant upward price movement. This schematic is divided into distinct phases, each with specific characteristics and events.
Phase A: End of a Downtrend
- Selling Climax (SC): Intense selling pressure is absorbed by institutional investors, often resulting in a sharp price drop followed by an automatic rally (AR).
Phase B: Building a Cause
- The price moves sideways within a trading range as the stock is accumulated by strong hands. Multiple secondary tests (ST) occur to confirm the support level established in Phase A.
Phase C: Spring
- A final test of the lower boundary of the trading range, often a false breakdown intended to shake out weak hands. This “spring” sets the stage for the final phase of accumulation.
Phase D: Transition to Uptrend
- Last Point of Supply (LPS): Higher lows indicate diminishing selling pressure.
- Sign of Strength (SOS): Significant upward price movement on increased volume, confirming the start of a new uptrend.
Phase E: Markup
- The stock breaks out of the trading range, beginning a sustained uptrend driven by increased demand and reduced supply.
By understanding and identifying these phases, traders can align their strategies with institutional buying patterns, positioning themselves as the stock enters the markup phase.
Wyckoff Accumulation Phases
Wyckoff Accumulation Events
The Wyckoff Accumulation pattern involves several key events that traders use to identify when institutional investors are accumulating a stock. Once a stock is in accumulation, then a trader will follow the accumulation phases to ready for a markup and rally.
1. Downside Price Objective Accomplished: This event marks the point where the price has declined to a level that meets or exceeds bearish expectations of a previous price projection. It often indicates that the selling pressure is exhausted and the asset is poised for accumulation. Traders look for signs that the downward momentum is waning, setting the stage for a potential reversal.
2. Preliminary Support, Selling Climax (SC), and Secondary Test (ST)
- Preliminary Support: This is the initial area where significant buying begins to slow the decline. It’s often accompanied by increased volume as institutional investors start to absorb shares.
- Selling Climax (SC): The selling climax is characterised by a dramatic increase in volume and volatility as panic selling reaches its peak. This event marks the end of the downtrend and often leads to a sharp rebound known as the automatic rally.
- Secondary Test (ST): After the selling climax and automatic rally, the secondary test occurs when the price revisits the area of the selling climax to test the supply-demand balance. Successful secondary tests usually show decreased volume and less downward price movement, confirming that selling pressure has been absorbed.
3. Activity Bullish (Volume Increases on Rallies and Diminishes During Reactions) During the accumulation phase, the volume should increase on price rallies and decrease during reactions or pullbacks. This volume pattern indicates that demand is outweighing supply, and smart money is accumulating shares. The consistent higher volume on up moves suggests strong buying interest.
4. Downward Stride Broken A key indication of the end of the downtrend is when the downward stride (the trend of lower highs and lower lows) is broken. This break is often marked by a significant price move above the resistance levels established during the downtrend. It’s a strong signal that the accumulation phase is progressing and a new uptrend may begin.
5. Higher Lows As accumulation progresses, the stock begins to form higher lows. This pattern suggests that the selling pressure is diminishing and buyers are becoming more active at progressively higher price levels. Higher lows are a bullish sign and confirm the presence of strong demand.
6. Higher Highs Following the formation of higher lows, the stock starts to make higher highs. This pattern indicates that the buying pressure is increasing, and the stock is likely entering the markup phase. Higher highs, along with higher lows, signify a bullish trend and the potential for significant price appreciation.
7. Stock Stronger Than the Market Relative strength is a critical concept in Wyckoff analysis. A stock showing relative strength during the accumulation phase means it is performing better than the broader market or its sector. This outperformance suggests that the stock is likely to lead in the subsequent markup phase, making it an attractive candidate for long positions.
8. Base Forming The accumulation phase often forms a base, which is a period of consolidation where the stock trades within a defined range. This base indicates that institutional investors are accumulating shares quietly. The longer and tighter the base, the stronger the subsequent breakout is likely to be, as it represents a significant buildup of buying interest.
9. Estimated Upside Profit Potential One of the key principles of the Wyckoff Method is to ensure that the estimated upside profit potential is at least three times the potential loss if the initial stop-loss were hit. This risk-reward ratio helps traders manage risk effectively while maximising potential gains. By estimating the upside potential and comparing it to the downside risk, traders can make more informed decisions about entering and exiting positions.
These events, when identified correctly, provide traders with a structured approach to capitalise on the Wyckoff Accumulation pattern. By understanding these key elements, traders can align their strategies with the actions of institutional investors, improving their chances of success in the market.
Trading Range Identification Techniques
Identify Key Support and Resistance Levels: Determine the boundaries of the trading range by identifying significant support and resistance levels. These levels mark the zones where buying and selling pressures are balanced.
Draw Trendlines: Use trendlines to visualise the accumulation phase. The end of this phase and the start of the markup phase is often indicated by a breakout above the resistance level.
Spring or Shakeout: Look for a spring or shakeout, where the price briefly falls below the support level before quickly recovering. This move traps bearish traders in believing the bear trend is continuing only to find the price rallying aggressively. This spring lower is designed to shakeout any weak buyers making them believe the downtrend is continuing and forcing them to sell. In actuality, this phase presents a good buying opportunity.
Volume Confirmation: Confirm the accumulation phase by analysing volume. Increased volume on rallies and decreased volume on pullbacks suggest accumulation by large players.
Price Confirmation: Watch for price action that confirms accumulation, such as higher lows within the trading range, indicating increasing demand.
Backing Up Action: Observe the “backing up” action where the price retests the breakout level. Successful retests confirm the start of the markup phase.
Consolidating at Wyckoff Distribution Pattern
The Wyckoff Distribution pattern signals when the markup phase is over and the stock may soon decline. The distribution phase is where large institutional investors, or smart money, gradually offload their positions to retail traders and weaker market participants. During this phase, the stock price typically moves within a defined trading range, characterized by a series of lower highs and lower lows, indicating the emergence of selling pressure.
Traders can leverage the Wyckoff Distribution pattern to anticipate potential price declines and prepare for the ensuing markdown phase. By analyzing trading volume, price action, and market sentiment during this consolidation period, traders can make informed decisions to manage risk and identify profitable trading opportunities.
Comparative Strength Analysis
Comparative Strength Analysis is a powerful tool used to evaluate the relative performance of different stocks or industries. By analyzing the relative strength, traders can identify which stocks or sectors are outperforming or underperforming the broader market. This analysis is essential for determining potential candidates for long or short positions within the Wyckoff Accumulation pattern.
Traders often use relative strength indicators to compare the price movements of a stock against a benchmark index, such as the S&P 500. A stock showing greater relative strength than the index is considered a strong candidate for a long position, indicating buying interest and a potential for price appreciation. Conversely, stocks exhibiting weaker relative strength may be suitable for short positions, signaling selling pressure and a likelihood of further price declines.
Incorporating Comparative Strength Analysis into trading strategies can enhance decision-making by focusing on stocks that align with the overall market trends and dynamics. This approach allows traders to capitalize on the momentum of stronger stocks while avoiding or shorting weaker ones, ultimately leading to more informed trading decisions and profitable trades.
Wyckoff Point and Figure (P&F) Count Guide
Wyckoff developed a uniquely effective method to identify price targets for both long and short trades using Point and Figure (P&F) charts. This method embodies Wyckoff’s fundamental law of Cause and Effect, where the horizontal P&F count within a trading range represents the Cause and the subsequent price movement out of the trading range represents the Effect.
The Wyckoff Count Guide Process:
- Chart Selection:
- Use a bar chart and a P&F chart encompassing the same trading range and timeframe.
- Choose an appropriate box size based on stock price (e.g., 0.5 to 1 point for low-priced stocks, 5 points for high-priced stocks).
- Identify Key Points:
- Spot a sign of strength (SOS) towards the right side of the trading range on the bar chart.
- Locate the last point of support (LPS) on both charts and count from right to left at the LPS price level.
- Dividing Accumulation into Phases:
- On the bar chart, divide the accumulation area into phases, adding one complete phase at a time. P&F phases are distinct from Wyckoff’s phases A-E used in trading range analysis.
- Long-term Count Validation:
- For longer-term counts, validate using the LPS at the original level of preliminary support or selling climax (SC).
- Spring as LPS:
- A spring may serve as the LPS, often followed by a SOS. The reaction low after this SOS is also a valid LPS.
- Stepping Stone Confirming Count:
- As the trend progresses, price consolidation at higher levels can produce a “stepping stone confirming count” of the original P&F count.
- Using Smaller Box Sizes:
- For re-accumulation trading ranges, use smaller box sizes to measure P&F counts, confirming long-term counts with subsequent minor counts.
- Adding to Price Targets:
- Add the P&F count to the low of the trading range and the midpoint between the low and count line level for conservative estimates of minimum price targets.
- Observing Price Action:
- Use derived price targets as points to monitor (“stop, look, and listen”) rather than exact trend change points, and observe price action and volume as these targets are approached.
Advantages of Trading on the Wyckoff Accumulation Pattern
1. Anticipating Market Trends:
- The Wyckoff Accumulation pattern helps traders identify the end of a downtrend and the beginning of an uptrend, allowing for early entry into potentially profitable positions.
2. Insight into Institutional Activity:
- By understanding the actions of institutional investors, traders can align their strategies with those who have the most market influence, increasing the likelihood of success.
3. Structured Approach:
- The Wyckoff method provides a systematic framework for analyzing price and volume, enhancing decision-making with clear guidelines on phases and events.
4. Risk Management:
- Identifying key support and resistance levels within the trading range helps traders set stop-loss orders effectively, managing risk and protecting capital.
5. Predictive Power:
- The method’s ability to project price targets using Point and Figure charts aids in setting realistic profit goals and managing expectations.
Disadvantages of Trading on the Wyckoff Accumulation Pattern
1. Complexity:
- The Wyckoff method requires a deep understanding of various concepts and significant practice to apply effectively, which can be challenging for novice traders.
2. Time-Consuming:
- Analysing accumulation patterns and phases requires meticulous attention to detail and can be time-consuming, potentially leading to missed opportunities in fast-moving markets.
3. False Signals:
- Market conditions may sometimes produce false signals that mimic Wyckoff phases, leading to potential misinterpretation and losses if trades are based on incorrect analysis.
4. Delayed Confirmations:
- Waiting for confirmation of key events like springs or last points of support might delay entry, causing traders to miss the initial part of the move.
5. Subjectivity:
- The interpretation of price and volume patterns can be subjective, leading to differences in analysis and potential inconsistencies in trading decisions.
By weighing these advantages and disadvantages, traders can better determine if the Wyckoff Accumulation pattern fits their trading style and risk tolerance.
Wyckoff Accumulation vs Wyckoff Distribution
The Wyckoff Accumulation and Distribution patterns are fundamental concepts in the Wyckoff Method, representing the phases where smart money buys or sells significant quantities of stock, respectively. Here’s a comparison of the two:
Wyckoff Accumulation:
- Purpose: Indicates the phase where institutional investors are building positions in anticipation of an upward price movement.
- Phases: Includes Preliminary Support (PS), Selling Climax (SC), Automatic Rally (AR), Secondary Test (ST), Spring, and Sign of Strength (SOS).
- Behaviour: Characterised by increased buying on dips and a general sideways movement before a breakout, suggesting the end of a downtrend and the start of an uptrend.
Wyckoff Distribution:
- Purpose: Signifies the phase where institutional investors are offloading their positions in anticipation of a downward price movement.
- Phases: Includes Preliminary Supply (PSY), Buying Climax (BC), Automatic Reaction (AR), Secondary Test (ST), Upthrust, and Sign of Weakness (SOW).
- Behaviour: Characterised by increased selling on rallies and a general sideways movement before a breakdown, indicating the end of an uptrend and the onset of a downtrend.
Key Differences:
- Objective:
- Accumulation: To build large positions at low prices before a major uptrend.
- Distribution: To sell large positions at high prices before a major downtrend.
- Volume Patterns:
- Accumulation: Higher volume on up days, lower volume on down days.
- Distribution: Higher volume on down days, lower volume on up days.
- Price Movement:
- Accumulation: Sideways trading range followed by an upward breakout.
- Distribution: Sideways trading range followed by a downward breakdown.
- Psychology:
- Accumulation: Market participants are generally pessimistic, providing smart money opportunities to buy at lower prices.
- Distribution: Market participants are generally optimistic, allowing smart money to sell at higher prices.
Understanding these patterns helps traders align their strategies with market movements, enabling better anticipation of market turns and more informed trading decisions.
Putting it all Together: Mastering the Wyckoff Accumulation for Profitable Trading
The Wyckoff Method offers a thorough, systematized, and logical structure for identifying high-probability and highly profitable trades. By mastering the Wyckoff Accumulation Pattern, traders can capitalize on the intentions of large “smart money” interests and make informed trading decisions unclouded by emotion.
Wyckoff Accumulation vs Reaccumulation
Wyckoff Accumulation and Reaccumulation may look quite similar at first glance, however they do occur in different stages of the market and serve different purposes.
Accumulation marks the start of a new uptrend after a downtrend, where institutional players quietly absorb all of the supply to prepare for a rise in price. As opposed to reaccumulation, which happens during an existing uptrend, acting as a breather or consolidation phase that allows the trend to gather momentum before continuing. Both involve a trading range and the absorption of supply, but the key difference lies in their position within the market cycle.
Reaccumulation is often viewed as a “rest stop” for the market after a strong rally. It allows institutional buyers to build their positions without influencing a major price spike while also shaking out weaker hands. The challenge for traders is knowing the difference between whether a trading range signals accumulation, reaccumulation, or even distribution.
By analysing the bigger picture, including volume trends and prior price movements, traders can better predict whether the market is gearing up for a continuation or preparing for a reversal.
FAQ
Common Wyckoff Accumulation pattern mistakes to watch out for?
- Misinterpreting Volume Patterns: Ensure volume decreases on down days and increases on up days.
- Ignoring False Signals: Be cautious of false breakouts and breakdowns.
- Rushing Confirmations: Wait for clear confirmation of key phases like the spring and SOS.
What is the origin of the Wyckoff Accumulation pattern?
The Wyckoff Accumulation pattern was developed by Richard D. Wyckoff, an early 20th-century pioneer of technical analysis, to identify the buying activities of large institutional investors.
How reliable is the Wyckoff Accumulation pattern?
The Wyckoff Accumulation pattern is considered reliable by many traders due to its systematic approach to understanding market behaviour and institutional activity, though it requires practice to master.
Which is the best timeframe for Wyckoff Accumulation?
The best timeframe for Wyckoff Accumulation depends on your trading style, but daily and weekly charts often work well for spotting clear accumulation patterns.