


Verfasst von:


- Quarterly Forecast
- September 30, 2024
- 10 Min. Lesezeit
Q4 Forex Forecast: US Rate Cut Expectations Drive Majors Higher
As we enter Q4 of 2024, market participants are bracing for significant movements in the Forex space, driven largely by expectations of further rate cuts from the US Federal Reserve. The key theme in this quarter is the weakening US dollar, as the Fed continues to cut rates in response to slowing inflation and economic growth.
Central banks all over the world are playing catch up with the US in lowering interest rates to maintain competitive currencies, but the Fed still leads the charge in lowering rates. This is allowing G7 currencies to rise off the back of a weakening dollar.
Overall, the outlook on most main currencies against the Dollar for Q4 of 2024 appears to be bullish, due to the bearish outlook for the USD.
As of September 2024, the interest rate for the Dollar sits at 4.75% – 5%, which is expected to come down by another 75 bps by the year’s end, reaching 4.00% – 4.25% interest rates.
Fedwatch Tool and Its Impact on Q4 2024
The Fedwatch Tool — a crucial market indicator provided by the CME Group — gives us insight into the likelihood of US Federal Reserve rate decisions.
As we move into Q4, the tool shows a clear expectation for additional cuts, with the consensus leaning towards a 50, then 25 basis point reduction at the November and December meetings respectively.
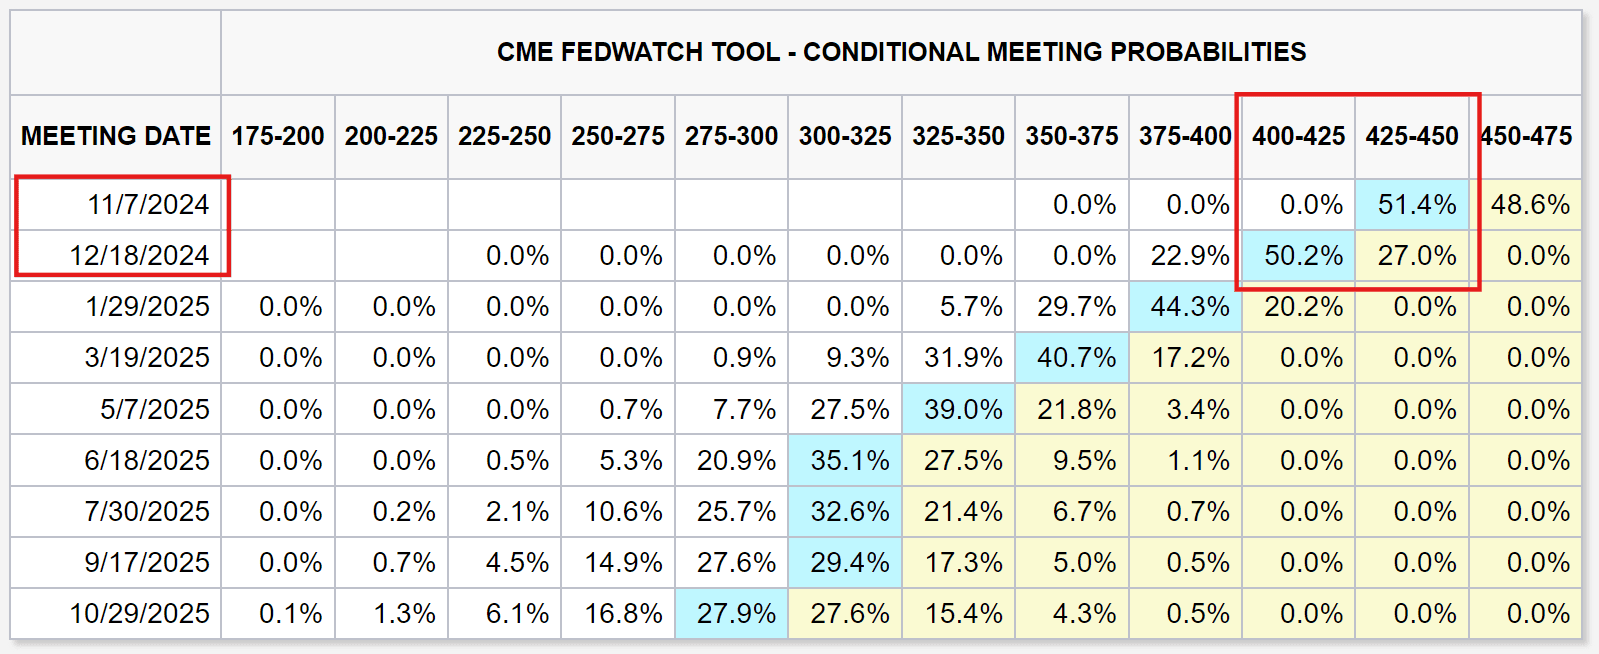
Source: FedWatch Tool, CME Group
As of Q4 2024, the Fedwatch Tool shows a strong expectation for continued rate cuts through the end of the year. The consensus is that the Fed will lower rates by 25 to 50 basis points in the upcoming November and December meetings, bringing rates down to 4.00% – 4.25% by the end of the year.
This anticipated easing is exerting bearish pressure on the US Dollar, and by extension, influencing G7 currencies to move higher against the US dollar.
DXY (US Dollar Strength Index) Q4 Forecast
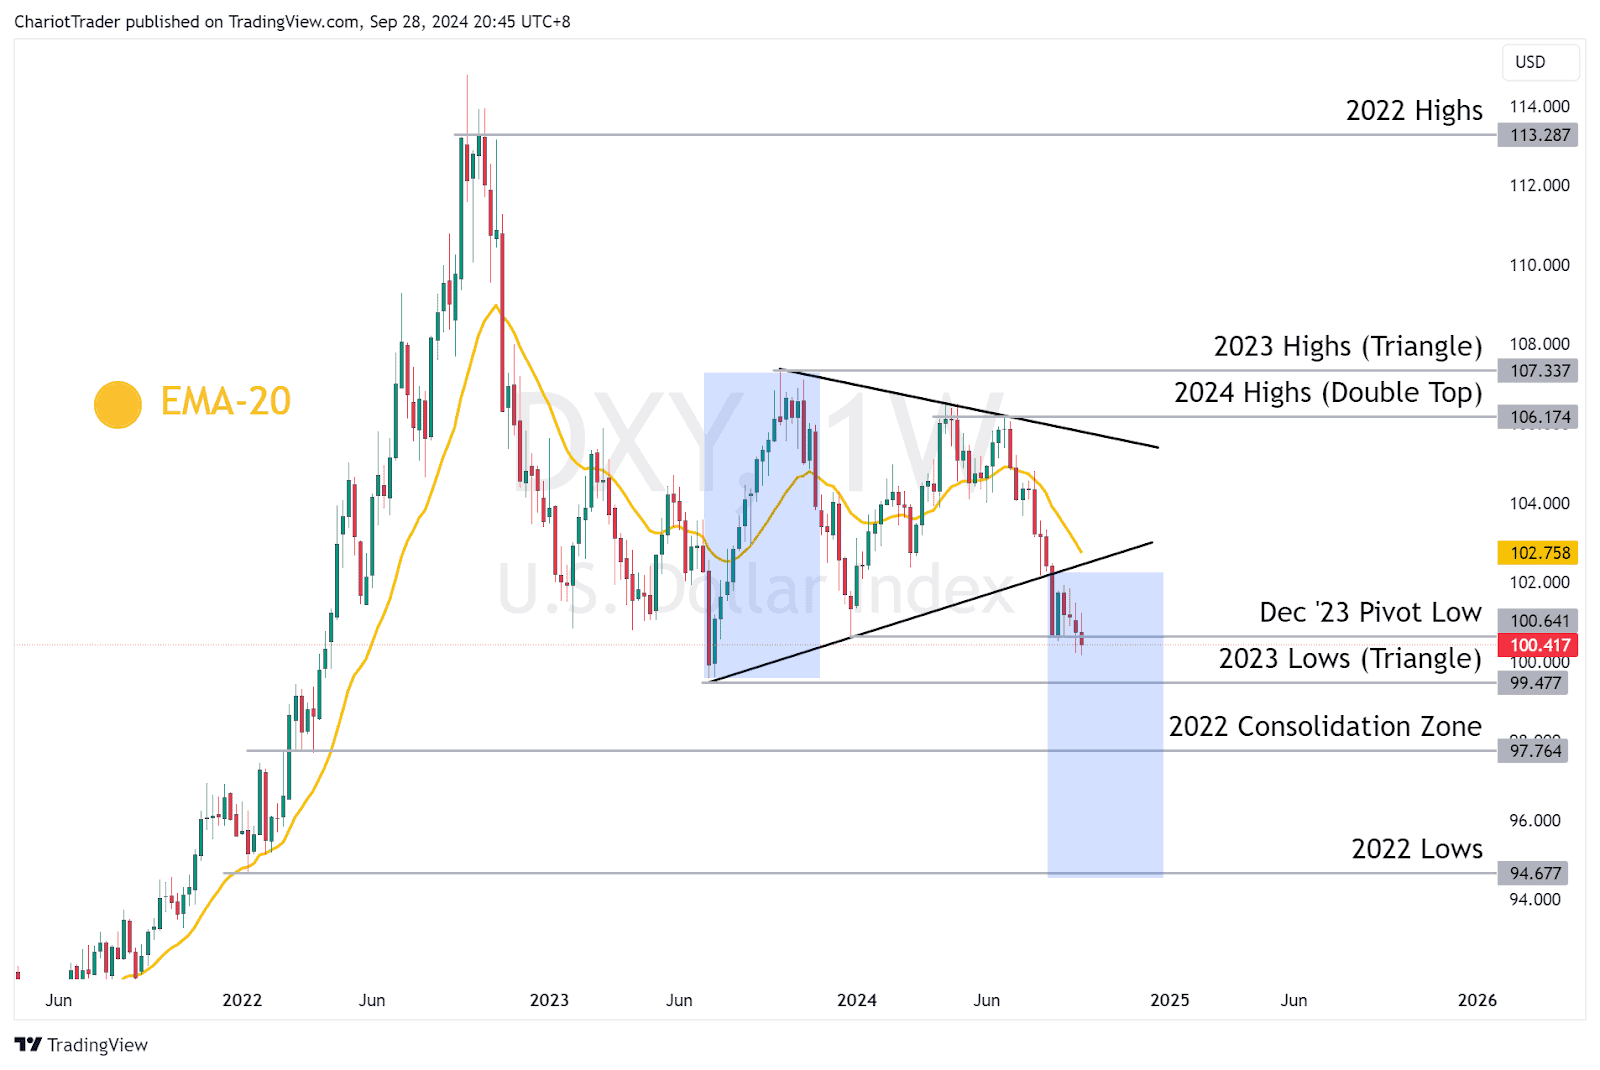
Thanks to the Fed’s rate cuts, we expect the DXY to continue trending down. These rate cut announcements are coming after a bearish break of the triangle pattern, formed from June 2023 to August 2024.
Taking the peaks of the triangle at 107.337, and the lows of the triangle at 99.477, the bearish breakout target suggests that the index might drop towards 94.67, aligning with the 2022 Lows.
Currently, the DXY is hovering around its December 2023 pivot low. Should the index close below this level on a weekly basis, a further decline towards 99.477 becomes more probable.
Conversely, a reversal in the DXY would require a break above the 20-week EMA and a breach of its 2024 highs. But until that happens, expect more bearish pressure on the greenback.
USDJPY Q4 Forecast
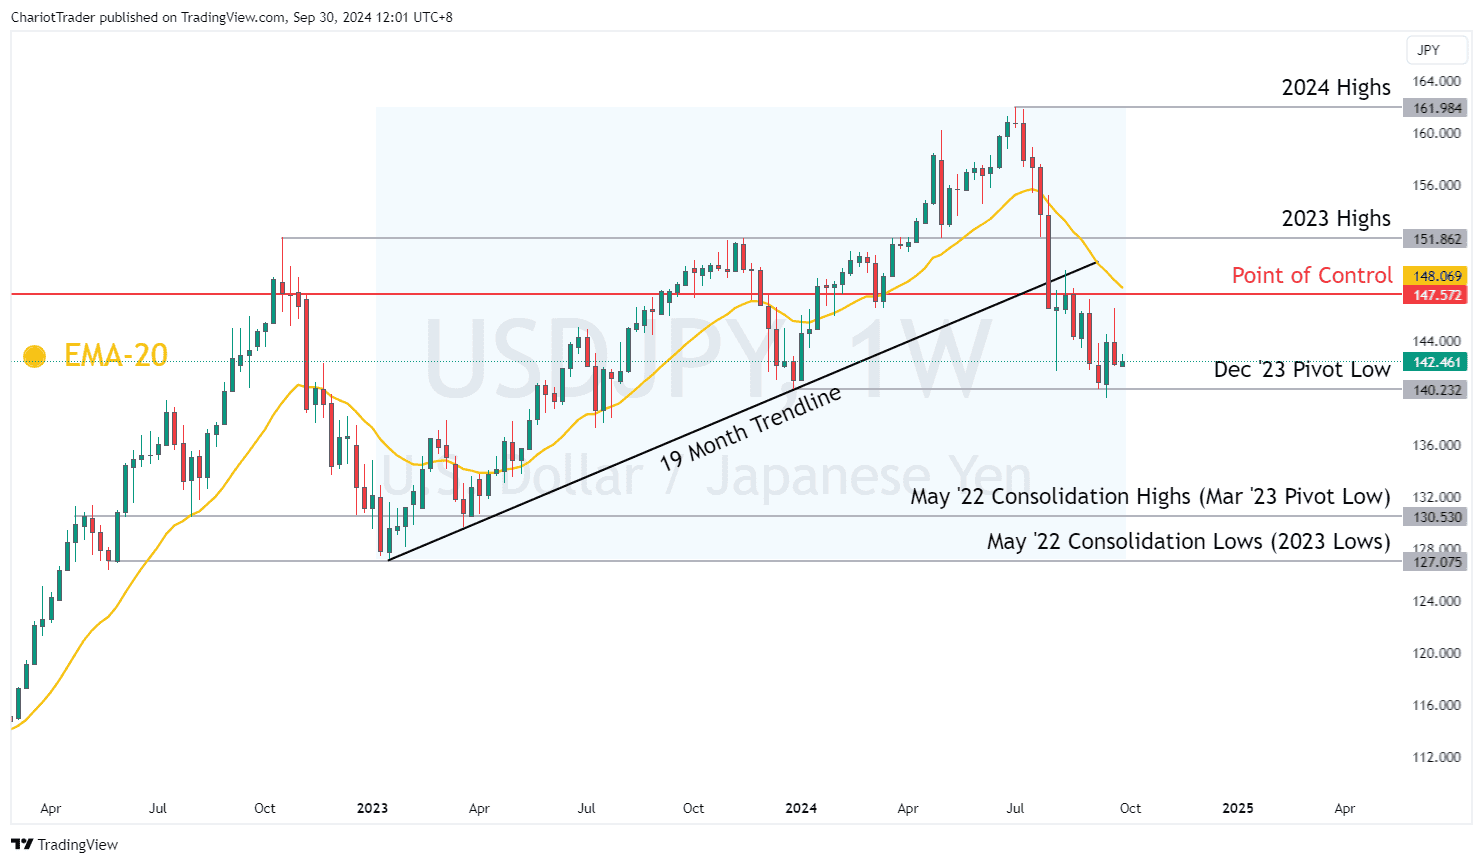
The USDJPY pair has entered a critical phase after breaking a 19-month-old trendline. The price is now at a key support level, which has already provided bounce, and could establish a potential range for the Dollar-Yen through the rest of Q4. Conversely, a breakdown here could see prices revisit its 2023 Lows.
The key support level, the December 2023 Pivot Low, is around ¥140.000. If USDJPY holds this level, it could stabilise and rise towards the Point of Control at ¥147.572. Beyond the POC, the asset may retest its 19-month trendline, Weekly EMA 20, and 2023 highs, which all align in the ¥148.000 – ¥151.800 range, likely serving as strong resistance.
These factors suggest that the pair may trade sideways during Q4, with a range between the December ’23 Pivot Low around ¥140 and resistance zones between ¥147.500 and ¥151.800.
However, the breakdown of the 19-month trendline is a bearish signal. For the range trade to remain valid, the December ’23 Pivot Low at ¥140.232 must hold as support.
If this level fails, the price could revisit the consolidation zones from May 2022, between approximately ¥127.00 and ¥130.50, which serve as key support levels. These zones also coincide with the beginning of the 19-month trendline, and 2023 Lows (¥127.075), making them key areas of interest for traders.
EURUSD Q4 Forecast
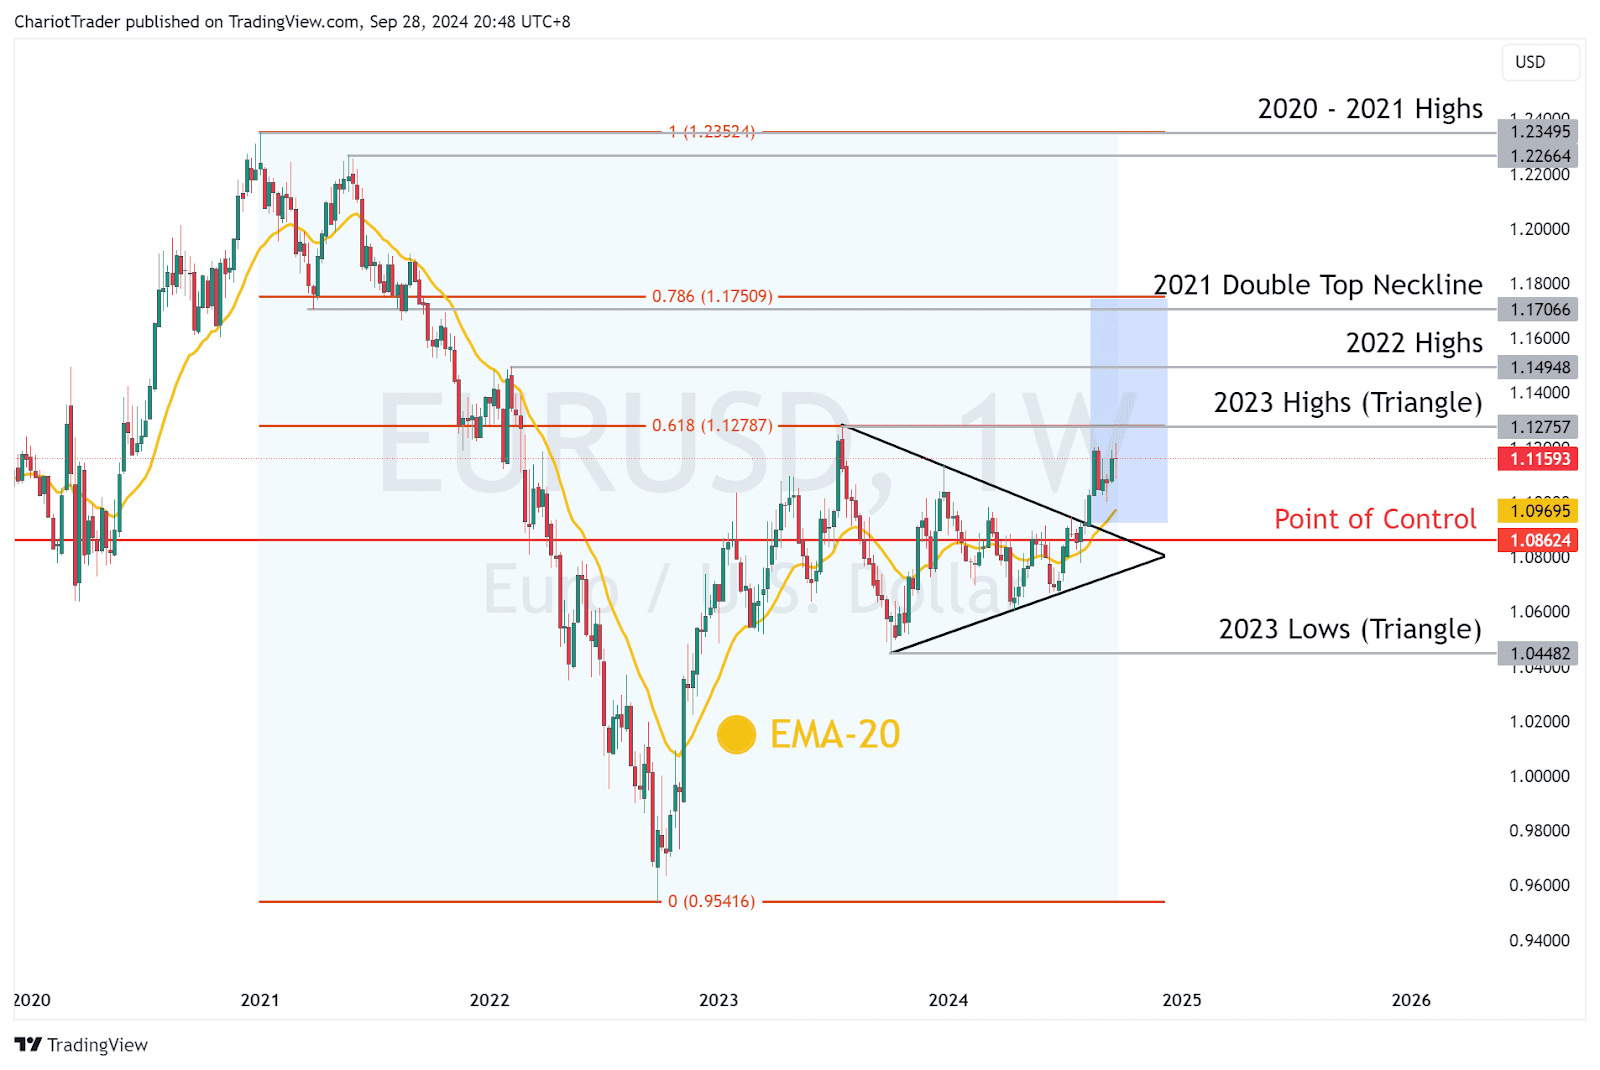
The EURUSD pair is looking strong! It’s sitting above the weekly EMA 20, which is a solid bullish sign, and it recently broke out of a triangle pattern.
Taking the distance from the highs and lows of the triangle pattern, EURUSD would have a breakout target at its 0.786 Fibonacci Retracement level at $1.17509, drawn from the 2020 – 2021 Highs to the lows at $0.95416. This also aligns with the 2021 Double-Top neckline at $1.17066.
That being said, the most immediate resistance level EURUSD faces is at the 2023 highs, the peak of the triangle pattern. This level also lines up with the 0.618 Fibonacci retracement.
If the pair drops, the $1.08624 level is your line in the sand, as it’s been the Point of Control since 2021, the price level with most trading volume.
GBPUSD Q4 Forecast
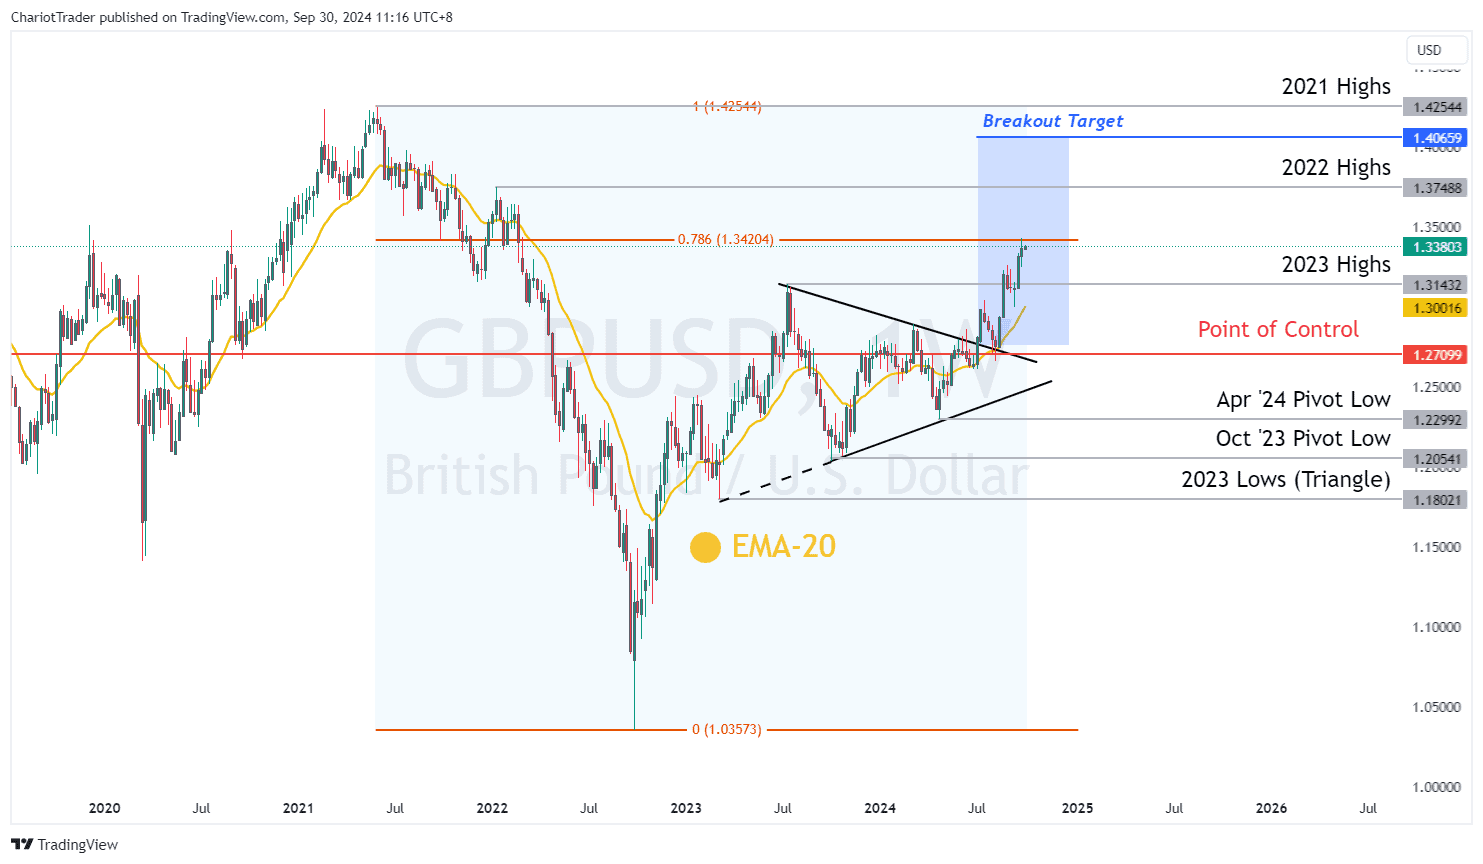
GBPUSD has enjoyed a strong breakout from a triangle pattern, setting the stage for further gains in Q4. The pair bounced off the weekly EMA 20, then subsequently used the 2023 Highs as another support level and surged upwards to test the 0.786 resistance at $1.34204.
Taking the distance from its triangle peak (2023 Highs) at $1.31432, and its triangle lows (2023 Lows) at $1.18021, a breakout target at approximately $1.40659 would be projected.
Traders should be mindful of potential resistance at the 2022 highs, which stand in the way of the breakout target, and should be considered as an alternative take profit target. Additionally, if the triangle pattern is drawn from the October ‘23 Pivot Low instead of the 2023 Lows, the pattern’s breakout target would shift to align with the 2022 Highs.
In the event of a pullback, the Point of Control at $1.27099, October ‘23 Lows at $1.20541, and 2023 Lows at $1.18021 provide strong support, which could help maintain the bullish momentum.
Given the overall sentiment surrounding the US dollar and the ongoing interest rate cuts, GBPUSD is well-positioned to maintain its upward trajectory.
USDCAD Q4 Forecast
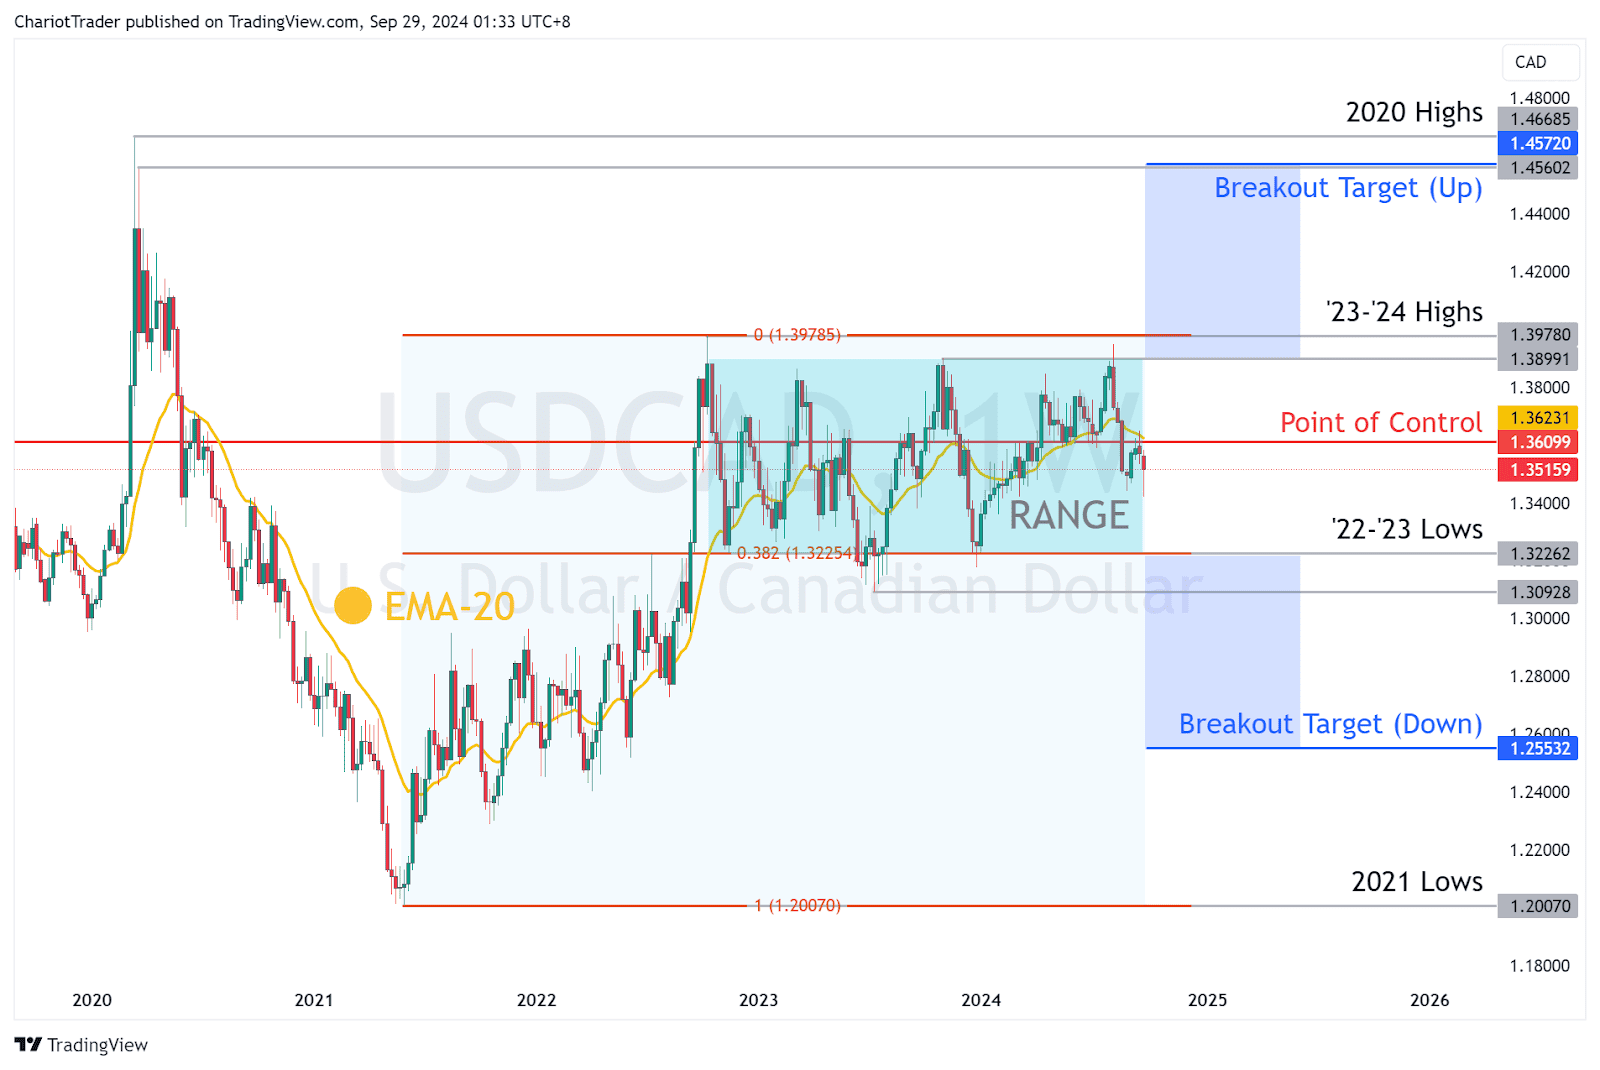
USDCAD remains range-bound as we enter Q4, with key levels offering insight into potential breakout opportunities. On the lower end of the range, we have the 0.382 Fibonacci retracement at $1.32254, while the upper end is capped by the 2023-2024 highs at $1.38991 to $1.39780.
Drawing a conservative range between its wicks and body closes, USDCAD’s range of movement between 2023 to 2024 is about 650 pips.
If the range breaks towards the upside, the breakout target (up) would align with its 2020 Highs at $1.45602. Traders should look for resistance at the 2024 highs, which could provide a challenge for further bullish movement. Conversely, a breakdown would take the asset to approximately $1.25532.
AUDUSD Q4 Forecast
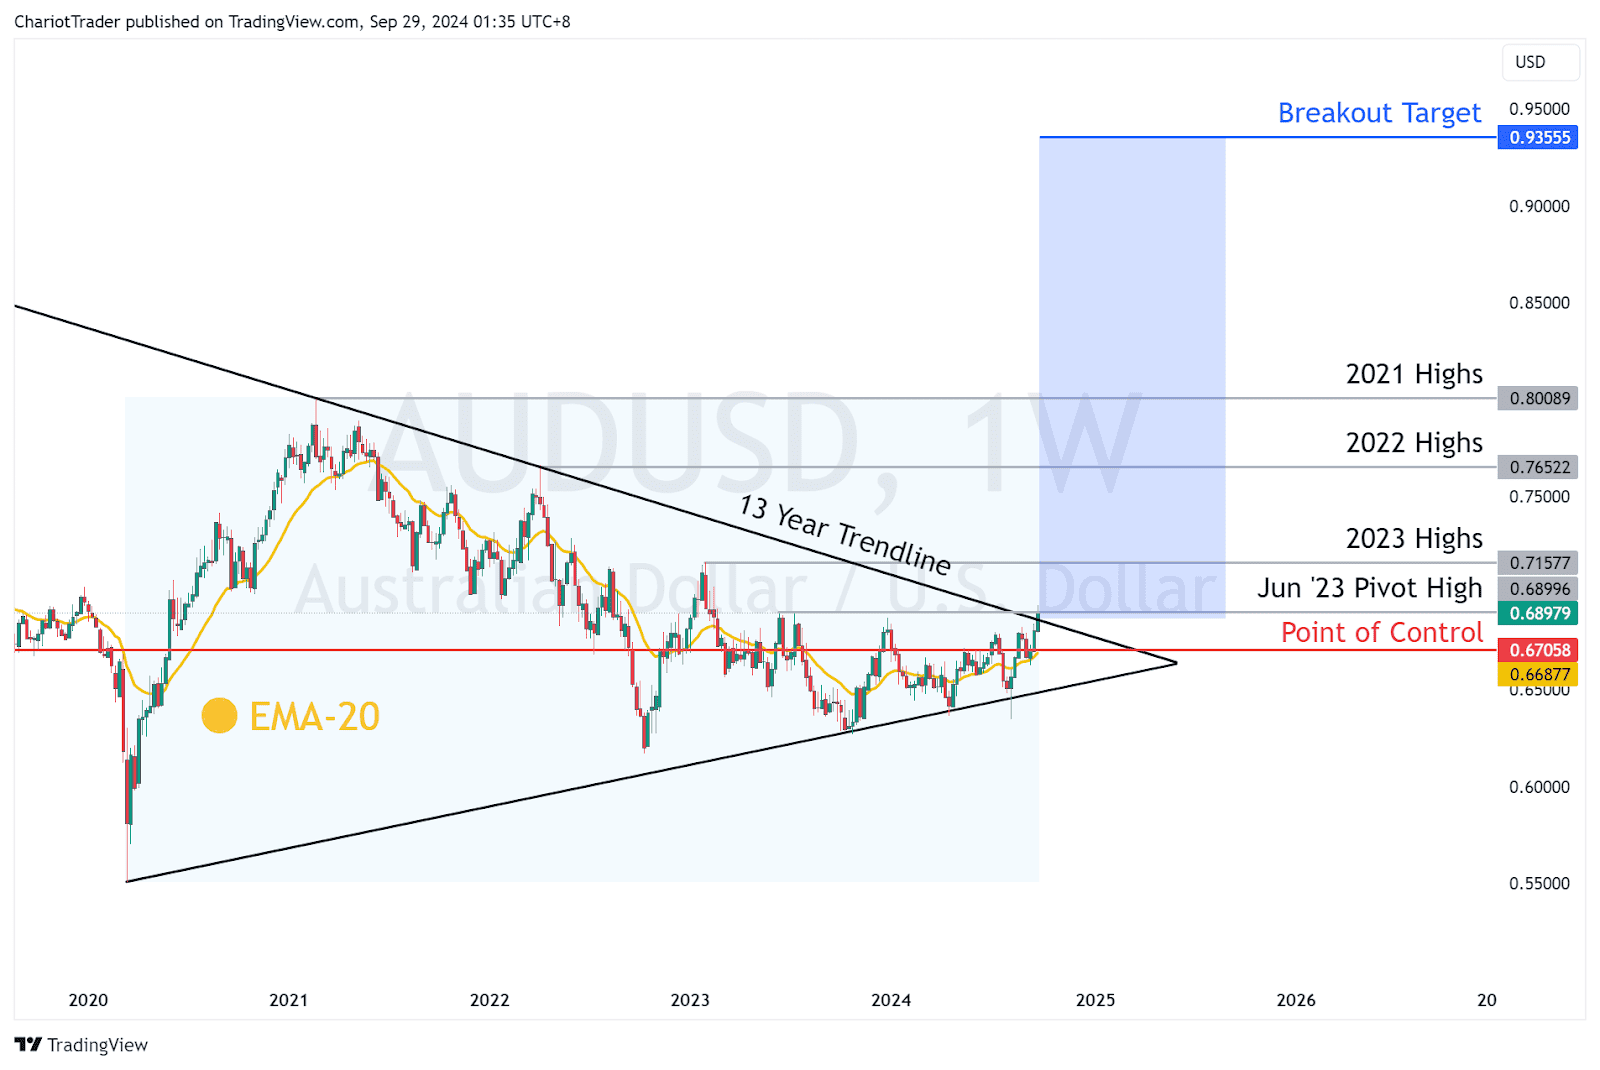
AUDUSD might be about to break a 13-year trendline, which is pretty exciting!
The June 2023 Pivot High and the upper triangle trendline pose as resistances, but if AUDUSD can push through, it would open the door to the next level of potential resistance at its 2023 Highs ($0.71577).
A breakout beyond this level could signal a significant shift in the market, with an extended target that stretches beyond the 2022 Highs ($0.76522) and 2021 highs ($0.80089).
It’s important to note that while this breakout would be a strong bullish signal, the target of a 2,450-pip move may not be realised within Q4. Should AUDUSD pull back from resistance, traders can look to the June 2023 Pivot High ($0.68996) and Point of Control ($0.67058) as key support levels.
With the Reserve Bank of Australia holding rates steady, and with the Fed scheduled to aggressively cut rates, the interest rate spread is shifting towards AUD’s favour. The Aussie Dollar is looking like a solid currency to hold while the US dollar keeps dropping.
Read more: RBA Holds Cash Rate Steady at 4.35% Amid Persistent Inflationary Pressures
NZDUSD Q4 Forecast
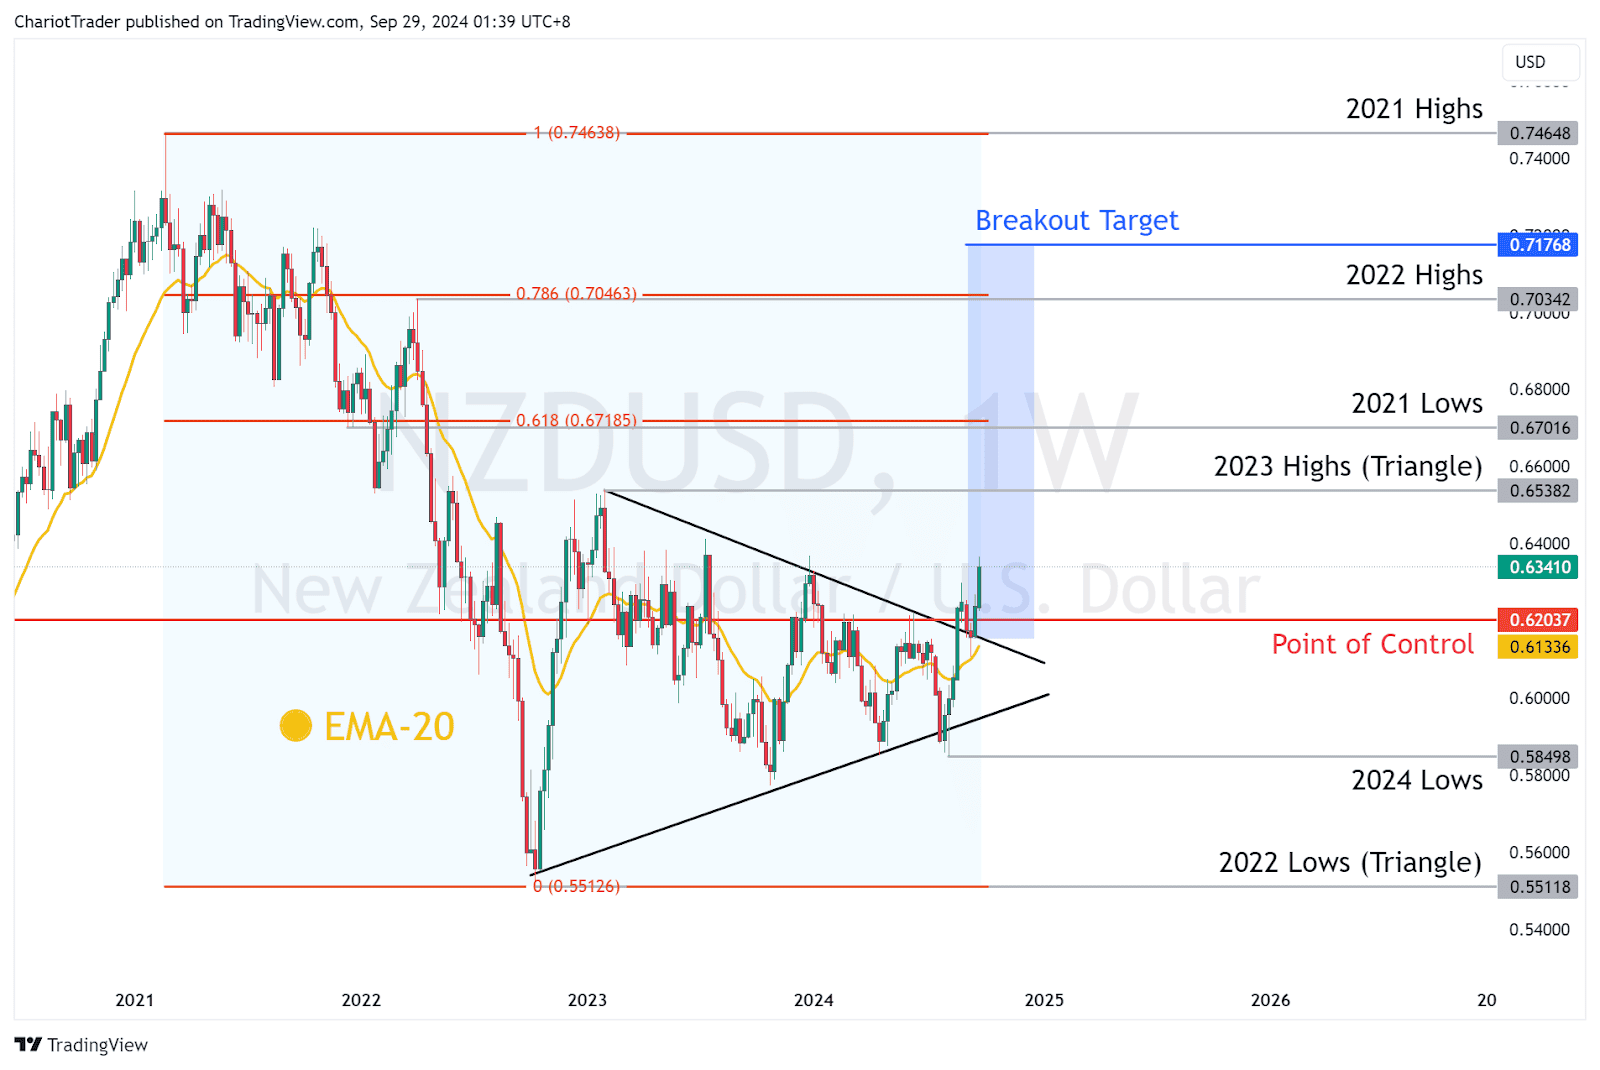
NZDUSD is also in a bullish position as Q4 2024 begins. After breaking out of a triangle pattern that began in 2022, the pair is currently trading above its 20-week EMA and the Point of Control ($0.62037), giving it a clear bullish edge.
The first major resistance lies at the 2023 Highs ($0.65382), with a further potential upside target at the 0.618 Fibonacci retracement ($0.67185), which aligns with the 2021 Lows ($0.67016).
If NZDUSD breaks above this level, it could target the 0.786 Fibonacci retracement ($0.70463), which lines up nicely with the 2022 Highs ($0.70342). This alignment of resistance levels makes these areas critical for traders watching the pair’s momentum.
On the downside, the Point of Control, around $0.62037, acts as a solid support. This level has seen the most trading volume since 2021 and should offer robust support if revisited again.
USDCHF Q4 Forecast
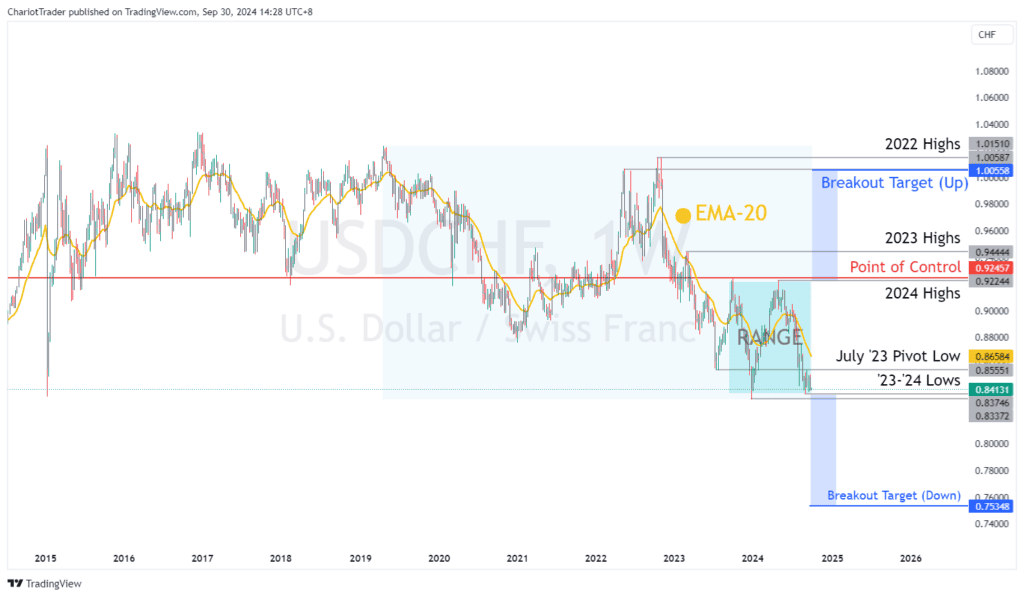
USDCHF is bouncing between 0.8375 and 0.9225 Swiss Francs, represented by its ‘23-’24 Lows and 2024 highs. The price is currently below the 20-week EMA, signalling bearish bias. If it can grind higher, it’ll face resistance at the July 2023 Pivot Low (0.85551 Francs) and EMA 20 (0.86842 Francs).
Ultimately, to shift back into bullish territory, USDCHF would need to break above and regain ground above its 2024 Highs (0.92244 Francs) and Point of Control (0.92457 Francs).
However, given the lack of intervention or significant policy changes from the Swiss National Bank, USDCHF may struggle to achieve these levels. For now, we should consider the USDCHF price to be trading within a range, and only look for higher or lower targets when a breakout, or breakdown occurs.
In the event of a breakout (up), the breakout target distance would be equal to USDCHF’s price range from 2023 – 2024 – this could take the asset up to its 2022 Highs at 1.0058 Francs.
In the event of a breakdown, USDCHF’s next major low target would be 0.74499. Though not marked on the chart, this level aligns with the asset’s lows last seen in 2011. While such a move would be dramatic, it’s not entirely out of the question, particularly if the dollar remains under sustained pressure.
Key Takeaways:
- Continued Weakness for the USD: The US dollar is expected to weaken further due to ongoing rate cuts by the Federal Reserve, with a potential 25-50 basis point reduction anticipated in November.
- DXY’s Bearish Trend: The US Dollar Index (DXY) is projected to continue its decline, with a target of 94.67, aligning with 2022 lows. This reflects broad bearish sentiment for the USD.
- Rate Cuts Driving Forex Markets: The Fedwatch Tool suggests further cuts, pushing rates down to 4.00% – 4.25% by year-end. This is a key driver behind the rally in major currency pairs against the USD.
For any bullish reversal, the DXY would need to reclaim its 20-week EMA and surpass 2024 highs, which seems unlikely in the current economic environment.
As we move into Q4 2024, the US dollar faces significant downward pressure due to the Federal Reserve’s aggressive rate-cutting strategy. The DXY is on a steady decline, with expectations for further drops, fueled by forecasts of more rate cuts from the Fedwatch Tool.
| Note: This analysis was created on September 30th, 2024. New economic developments could drastically shift the outlook of Forex trading in Q4. |
You may also be interested in:


