Mastering the Markets

The Essential Guide to Stocks, Currencies & Indices
Disclaimer
This report is provided for educational and informational purposes only. It does not constitute investment advice, a recommendation, or an offer to buy or sell any financial instrument. References to specific companies are for analysis and market education, not trading signals. Markets involve risk and can move rapidly. Past performance is not indicative of future results.

Mastering the Markets: The Essential Guide to Stocks, Currencies & Indices

Financial markets can appear complex, fast-moving, and unpredictable. Prices shift in response to economic data, corporate developments, policy decisions, and changes in investor sentiment. For new traders, this constant movement can feel overwhelming. However, beneath daily volatility lies a structured system governed by supply and demand, liquidity, expectations, and risk.
This guide was created to provide clarity.
Rather than focusing on shortcuts or predictions, it introduces the foundational principles that support responsible and informed participation in global markets. It explains how currencies, indices, stocks, and commodities function, what drives their movements, and how traders can approach them within a structured framework.
Understanding markets begins with structure. Why do prices move? Who participates? How do global trading sessions influence volatility? These questions form the starting point of the guide. By recognizing that markets reflect collective expectations rather than isolated events, traders can shift from reacting emotionally to interpreting context more objectively.
The guide then explores the major asset classes available to traders. Each market behaves differently. Currency markets are heavily influenced by macroeconomic trends and central bank decisions. Indices reflect broader economic sentiment and corporate performance. Individual stocks respond to earnings, competitive positioning, and sector dynamics. Commodities are often driven by supply-demand imbalances and geopolitical developments. Understanding these distinctions helps traders align their focus with markets that suit their interests and risk tolerance.
Core trading mechanics are addressed next. Concepts such as bid and ask prices, spreads, leverage, margin, execution speed, and slippage are often overlooked by beginners, yet they shape every trade. A solid understanding of these mechanics reduces confusion and supports more disciplined decision-making.
Risk management forms the centre of sustainable trading. No strategy wins all the time. Position sizing, risk per trade, and disciplined stop-loss placement determine whether losses remain manageable or become destructive. The guide emphasizes that protecting capital is not about avoiding losses entirely — it is about controlling them so that consistency can develop over time.
Basic analytical approaches such as trend-following, support and resistance, and breakout structures are introduced in a practical, non-promotional way. These methods are not presented as guarantees, but as structured frameworks that help traders interpret price behaviour.
Psychology is treated as an essential component rather than an afterthought. Emotional discipline, patience, and realistic expectations often determine long-term consistency more than technical precision. The guide reinforces that structured execution, not prediction accuracy, drives sustainable progress.
Finally, the guide brings all elements together into a simple, repeatable process. It encourages practice in a risk-free environment, structured review, and gradual refinement rather than rapid escalation. The objective is steady development, not short-term excitement.
This guide is designed to provide education, not investment advice. It aims to equip traders with the foundational knowledge required to approach global markets with structure, discipline, and perspective.
Markets evolve. Structure endures.
01

Introduction: How the Global Markets Really Work

Financial markets can appear complex at first glance. Prices move constantly, headlines influence sentiment, and traders across the world react in real time to new information. However, beneath this apparent chaos lies a structured system shaped by economic forces, institutional activity, liquidity, and expectations. Understanding how global markets function does not require predicting every price movement. Instead, it requires understanding why markets exist, who participates in them, and what drives price changes over time.
This chapter lays the foundation for everything that follows. Before learning strategies or tools, it is important to understand the environment in which trading takes place.

Why Markets Move

At their core, financial markets are mechanisms for price discovery. They exist to match buyers and sellers of financial instruments such as currencies, stocks, indices, and commodities. Prices move when there is an imbalance between supply and demand.
If more participants want to buy than sell, prices tend to rise. If more participants want to sell than buy, prices tend to fall. While this principle is simple, the reasons behind buying and selling decisions are often complex.
Market movements are influenced by several interconnected forces. Economic data such as inflation, employment figures, and interest rate decisions can alter expectations about future growth. Corporate earnings reports can change how investors value companies. Geopolitical events can introduce uncertainty or shift trade dynamics. Even shifts in sentiment or positioning among large market participants can cause price fluctuations.
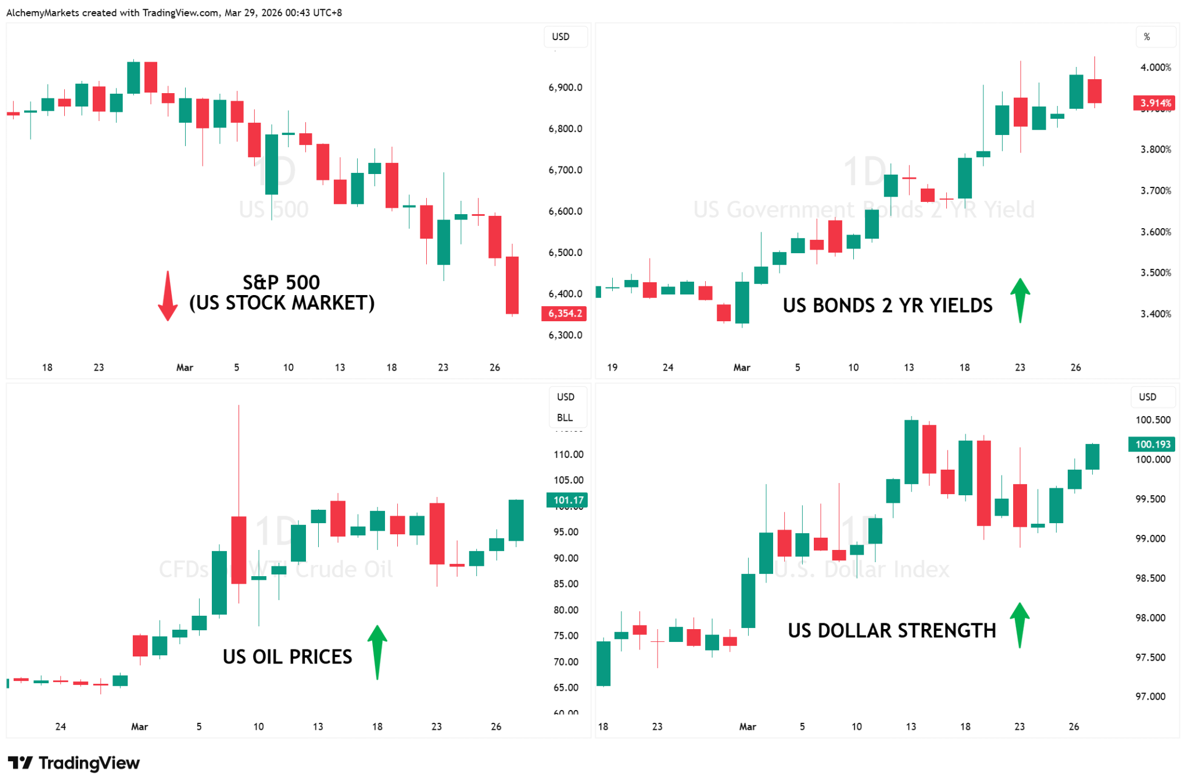
S&P 500, US 2-year bond yields, US oil prices and US dollar strength reacting together
Importantly, markets are forward-looking. Prices often reflect expectations about the future rather than current conditions. This is why markets sometimes move before official data is released or react strongly to changes in guidance.
Understanding that markets move based on expectations — not just current facts — helps explain why volatility can occur even when news appears neutral.

Who Participates in Global Markets

Financial markets are not driven by one type of participant. They include a wide range of actors, each operating with different objectives, time horizons, and levels of capital.
Institutional participants such as banks, hedge funds, pension funds, asset managers, and multinational corporations account for a significant share of global trading volume. These participants may trade to hedge currency exposure, manage portfolios, allocate capital across regions, or implement macroeconomic views.
For example, a multinational corporation may exchange currencies to manage international revenues. A pension fund may rebalance its equity portfolio based on long-term allocation targets. A hedge fund may trade based on macroeconomic analysis or quantitative models.
Retail traders also participate in global markets, often with shorter time horizons and smaller capital allocations. Advances in technology have made it possible for individuals to access markets that were once limited primarily to institutions.
While retail and institutional participants operate on different scales, they interact within the same price discovery mechanism. Understanding that prices reflect the combined actions of all these participants helps explain why markets can sometimes behave unpredictably in the short term.

Why Understanding Structure Matters More Than Prediction

Many beginners approach trading with a focus on prediction. They look for ways to forecast exactly where prices will move next. However, experienced market participants often focus less on prediction and more on structure.
Market structure refers to how prices form, how liquidity flows through the market, and how different timeframes interact. It includes understanding trends, volatility patterns, and how major sessions such as London or New York influence trading activity.
Rather than attempting to forecast every movement, a structured approach asks different questions. What is driving the current trend? Is volatility increasing or decreasing? Are markets reacting to economic data or broader themes? How does this asset behave during specific trading sessions?
By focusing on structure, traders can shift from trying to be “right” about every move to managing risk within a broader framework. Markets are uncertain by nature. No strategy eliminates uncertainty. However, understanding structure helps reduce randomness in decision-making.
This guide builds on that principle. Before exploring strategies or tools, it establishes a clear understanding of how global markets function and why they move.
In the next chapter, we explore the major asset classes available to traders — currencies, indices, stocks, and commodities — and how each behaves within the broader financial system.
02

Understanding Asset Classes

Financial markets are made up of different asset classes, each with its own characteristics, drivers, and behavior patterns. While the core principle of supply and demand applies across all markets, currencies do not move in the same way as stocks, and commodities do not behave exactly like indices.
Understanding these differences is essential. Choosing what to trade should not be random. It should reflect an understanding of how each market works and what influences price movement.
This chapter introduces four major asset classes commonly accessed by traders: currencies (FX), stock indices, individual equities, and commodities.

2.1 Currencies (Foreign Exchange – FX)

The foreign exchange market, often referred to as FX or Forex, is the largest financial market in the world. Unlike stocks, which represent ownership in companies, currencies are traded in pairs. When trading a currency pair such as EUR/USD, one currency is being exchanged for another.
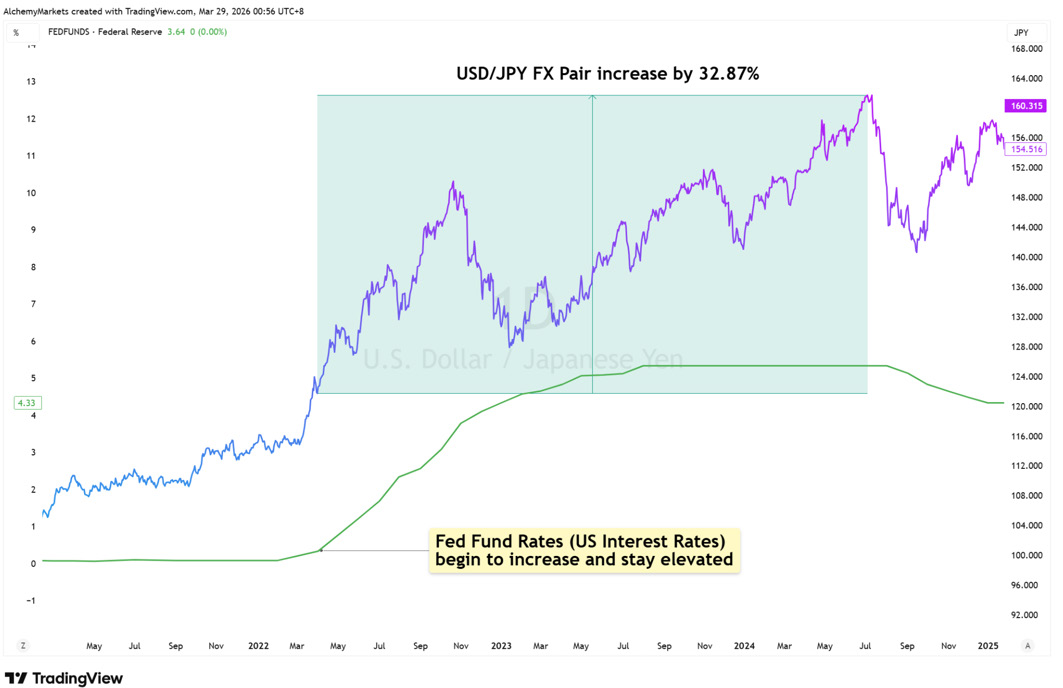
Currency prices are primarily influenced by macroeconomic factors. Interest rates play a central role. When a country raises interest rates, its currency may become more attractive to investors seeking higher returns. Inflation levels, employment data, economic growth, and central bank policy decisions also influence currency movements.
USD/JPY rising alongside elevated US Fed Fund interest rates
Currencies are typically grouped into major, minor, and exotic pairs. Major pairs involve the world’s most widely traded currencies, such as the US dollar, euro, British pound, and Japanese yen. These pairs tend to have higher liquidity and tighter spreads. Minor pairs involve major currencies excluding the US dollar. Exotic pairs include currencies from smaller or emerging economies and may experience wider spreads and greater volatility.
Because currencies reflect the relative strength of one economy versus another, they are often sensitive to economic data releases and central bank communication. FX markets operate 24 hours a day during the trading week, making them accessible across different time zones.
Understanding macroeconomic influence is particularly important in FX trading, as price movements are closely linked to shifts in expectations about interest rates and economic stability.

2.2 Indices

A stock index represents a group of companies combined into a single benchmark. Rather than trading an individual company, traders can gain exposure to an entire market or sector through an index.
For example, indices in the United States often track large publicly listed companies across different sectors. In the United Kingdom and Europe, indices represent the performance of leading national or regional firms. Each index has its own weighting methodology, meaning some companies may have a greater influence on price movement than others.
Indices are influenced by corporate earnings, economic growth expectations, geopolitical developments, and overall investor sentiment. Because they represent multiple companies, they can provide diversification compared to trading a single stock.
Indices are often considered popular among traders due to their volatility and responsiveness to macroeconomic news. They tend to react strongly to economic data, central bank decisions, and global risk sentiment. For example, if markets expect stronger economic growth, equity indices may rise as investors anticipate improved corporate earnings. Conversely, during periods of uncertainty, indices may decline as risk appetite decreases.
Trading indices allows market participants to take a broader view of economic conditions rather than focusing on individual company performance.

2.3 Equities (Stocks)

When trading stocks, investors and traders are buying or selling shares in a specific company. Unlike indices, which represent baskets of firms, individual equities are directly influenced by company-specific developments.
Stock prices are affected by earnings reports, revenue growth, management decisions, competitive positioning, product innovation, and broader industry conditions. Investor sentiment also plays an important role. If market participants believe a company has strong growth potential, its valuation may increase. If uncertainty rises or earnings disappoint, prices may fall.
NVIDIA share price jumping after its May 2023 earnings report
Companies are often categorized into different types. Blue-chip stocks generally refer to large, established companies with stable earnings histories. Growth stocks are typically companies reinvesting profits to expand operations, often operating in innovative or fast-growing industries. Each type may behave differently depending on economic conditions.
Individual stocks can offer targeted exposure to specific sectors or themes. However, they may also carry higher company-specific risk compared to indices. Monitoring earnings calendars and sector developments becomes particularly important when trading equities.

2.4 Commodities

Commodities are physical goods that are traded on global markets. These include energy products such as crude oil and natural gas, metals such as gold and silver, and agricultural products such as wheat or corn.
Commodity prices are largely influenced by supply and demand dynamics. Weather conditions, geopolitical tensions, production levels, and global economic growth can all affect prices. For example, disruptions in oil supply may lead to price increases, while strong agricultural harvests may influence crop prices.
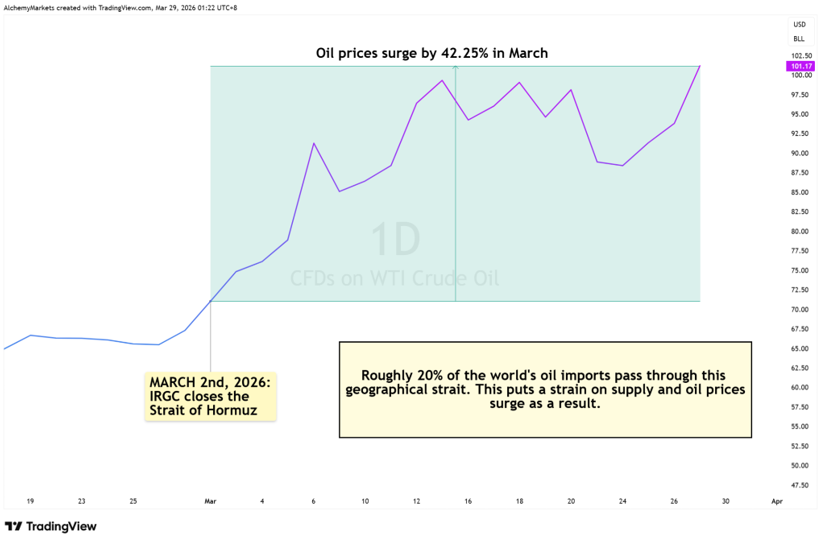
WTI crude oil prices surging after a supply disruption at the Strait of Hormuz
Inflation expectations can also influence commodity markets. During periods of rising inflation, certain commodities—particularly precious metals like gold—are sometimes viewed as stores of value. This can increase demand under specific economic conditions.
Commodities often behave differently from equities and currencies. While stock markets may respond to earnings or economic growth expectations, commodities may respond more directly to supply disruptions or inventory data.
Understanding the unique drivers behind commodities helps traders recognize why price movements may differ significantly from other asset classes.

Choosing the Right Market

Each asset class offers different characteristics in terms of volatility, liquidity, and sensitivity to economic developments. Some traders prefer the macro-driven nature of FX markets. Others focus on indices to gain exposure to broader economic trends. Some may concentrate on individual equities to follow specific companies or sectors. Commodities may appeal to those interested in global supply-demand dynamics.
There is no single “best” market. The key is understanding how each behaves and aligning that knowledge with personal objectives and risk tolerance.
In the next chapter, we explore how global trading sessions and market liquidity influence volatility — and why timing can matter just as much as asset selection.
03

Market Sessions, Liquidity & Volatility

Financial markets operate across time zones, economic regions, and institutional centers. While technology allows traders to access markets from almost anywhere, price activity is not evenly distributed throughout the day. Liquidity, participation, and volatility shift depending on which global trading session is active.
Understanding when markets are most active — and why — can help traders interpret price behavior more effectively. Timing does not guarantee outcomes, but it influences conditions such as spreads, speed of movement, and market responsiveness to news.
This chapter explores how global sessions function, how liquidity affects trading conditions, and why volatility tends to increase at specific times.

The Three Major Trading Sessions

Although financial markets are interconnected, trading activity tends to cluster around three major regional sessions: the Asian session, the European session, and the US session.
The Asian session begins with financial centers such as Tokyo and Sydney. During this period, currency pairs involving the Japanese yen, Australian dollar, or New Zealand dollar may see relatively higher activity. However, overall volatility can sometimes be more moderate compared to later sessions, particularly in equity indices tied to Western markets.
The European session, centered around London, is often considered one of the most active trading periods in the world. London plays a central role in global foreign exchange markets, and liquidity typically increases significantly when this session opens. Currency pairs involving the euro and British pound may experience stronger movements, and European equity indices become more active.
The US session begins with New York and overlaps for several hours with the European session. This overlap often represents one of the most liquid and volatile periods of the trading day. US economic data releases, corporate news, and institutional flows can generate significant price activity across currencies, indices, commodities, and stocks.
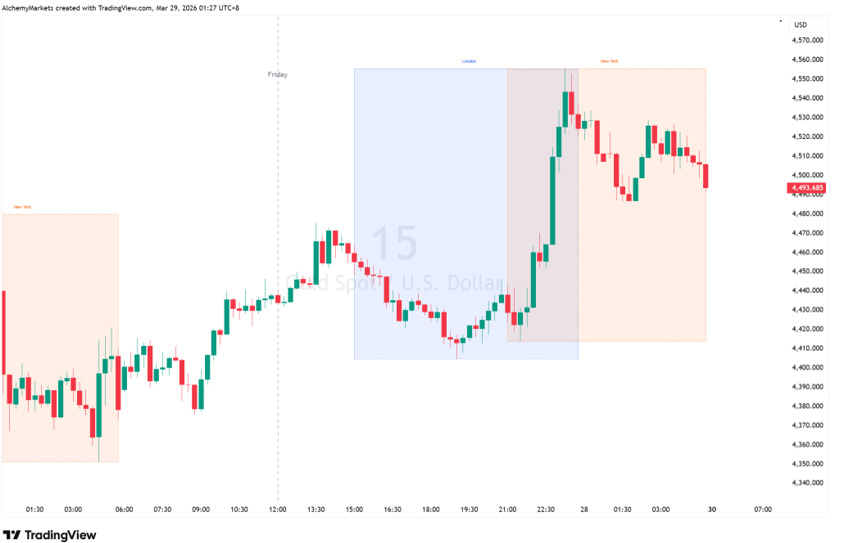
Gold price activity across the New York and London trading sessions
Because markets are global, developments in one region can influence price movements in another. However, liquidity and participation levels often peak when major financial centers are open simultaneously.

Understanding Liquidity

Liquidity refers to how easily an asset can be bought or sold without causing significant price disruption. In highly liquid markets, there are many buyers and sellers active at different price levels. This typically results in tighter spreads and smoother execution.
During periods of lower liquidity, price movements may become less predictable. Spreads can widen, and sudden moves may occur if large orders enter the market. Liquidity often fluctuates depending on the time of day, economic releases, and broader market conditions.
For example, currency pairs involving major economies tend to have strong liquidity during overlapping European and US sessions. Conversely, some markets may experience reduced activity during quieter hours, which can influence trading conditions.
Understanding liquidity helps explain why execution speed and spreads may vary throughout the day. It also highlights why certain times may experience sharper price swings.

When Volatility Increases

Volatility refers to the degree of price fluctuation within a given period. While markets can move at any time, volatility tends to increase under specific conditions.
One key driver of volatility is economic data. Scheduled releases such as inflation reports, employment figures, or central bank announcements often trigger rapid price adjustments as market participants update expectations.
Corporate earnings announcements can also generate volatility in individual stocks and indices. Unexpected results or changes in forward guidance can lead to sharp movements.
Geopolitical developments, policy decisions, or unexpected global events may introduce uncertainty, prompting shifts in investor sentiment. During these periods, volatility may increase across multiple asset classes simultaneously.
It is important to understand that volatility is not inherently positive or negative. It simply reflects the speed and magnitude of price changes. However, higher volatility can amplify both opportunity and risk.

Matching Asset Classes to Trading Times

Different asset classes may behave differently depending on the active session. Currency markets are often most active during session overlaps, particularly when both London and New York are open. This period may provide deeper liquidity and stronger price momentum.
Equity indices tend to show increased activity during their respective regional market hours. For example, US indices are often most active during the US session, especially around the market open and during major economic announcements. Commodities such as oil may experience heightened volatility during US trading hours due to inventory data releases and broader energy market participation.
Recognizing these patterns does not require constant monitoring. Instead, it provides context. Traders who understand when markets are typically more active may be better prepared for changes in volatility and liquidity.

The Importance of Context

Markets do not move randomly throughout the day. Activity tends to concentrate around institutional participation, economic releases, and session overlaps. Liquidity conditions influence spreads and execution, while volatility reflects shifts in expectations.
By understanding how global sessions operate, traders can move beyond simply reacting to price changes and begin interpreting why those changes may be occurring at a particular time.
In the next chapter, we move from market structure to core trading mechanics — exploring concepts such as spreads, leverage, margin, and execution quality.
04

Core Market Mechanics & Trading Fundamentals

Before exploring strategies or advanced tools, it is essential to understand the basic mechanics behind how trades are executed. Many new traders focus primarily on charts and price direction, but understanding how orders are placed, how pricing works, and how capital is managed is equally important.
Trading involves more than deciding whether an asset will rise or fall. It also involves understanding spreads, leverage, margin requirements, and execution conditions. These elements shape the practical experience of participating in financial markets.
This chapter explains the foundational mechanics every trader should understand.

Bid and Ask Prices

In financial markets, every tradable asset has two prices at any given moment: the bid price and the ask price.
The bid price represents the highest price a buyer is willing to pay for an asset. The ask price represents the lowest price a seller is willing to accept. The difference between these two prices is known as the spread.
When entering a trade, a trader typically buys at the ask price and sells at the bid price. This means that immediately after opening a position, there is often a small difference between the entry price and the current market value. This difference reflects the spread.
Spreads tend to be narrower in highly liquid markets and during active trading sessions. During quieter periods or times of increased uncertainty, spreads may widen. Understanding spreads helps explain why market conditions can vary depending on liquidity and timing.

Spreads and Trading Costs

The spread represents one of the primary transaction costs in trading. In markets with strong liquidity, spreads are often tighter, allowing for more efficient entry and exit. In less liquid markets or during volatile periods, spreads may increase.
For example, major currency pairs typically have relatively tight spreads during peak trading hours. Exotic currency pairs or smaller-cap stocks may experience wider spreads due to lower liquidity.
Being aware of spreads helps traders understand the cost of entering and exiting positions. Over time, transaction costs can influence overall performance, particularly for shorter-term trading approaches.

Leverage and Margin

Leverage allows traders to control a larger position size than their deposited capital alone would permit. While leverage can increase potential returns, it also increases potential losses.
Margin refers to the amount of capital required to open and maintain a leveraged position. When a trade is opened using leverage, only a portion of the full position value is required as margin. The broker effectively facilitates exposure to the larger amount.
For example, if leverage allows a trader to control a position worth ten times their margin deposit, price movements will be amplified relative to the capital committed. This amplification applies to both gains and losses.
It is important to understand that leverage does not change market risk; it magnifies exposure. Responsible use of leverage requires careful risk management and awareness of potential drawdowns.

Execution Speed and Slippage

Execution refers to how quickly and efficiently an order is filled in the market. In fast-moving conditions, the price available at the time of order placement may change before execution occurs. This difference between the expected price and the executed price is known as slippage.
Slippage can occur during high volatility, major economic announcements, or periods of reduced liquidity. It may result in a trade being executed at a slightly better or worse price than anticipated.
Execution quality depends on market liquidity, technology infrastructure, and the speed at which orders are processed. While traders cannot eliminate slippage entirely, understanding that it exists helps set realistic expectations.

Why Trading Conditions Matter

Trading conditions include factors such as spreads, execution quality, leverage availability, and overall market liquidity. These conditions shape the practical experience of participating in financial markets.
Two traders may analyze the same chart and reach similar conclusions, but differences in execution quality or cost structure can influence outcomes. For this reason, understanding trading mechanics is just as important as understanding price direction.
Market conditions are not static. Liquidity fluctuates throughout the day, volatility increases during major announcements, and spreads may adjust in response to market uncertainty. Being aware of these variables helps traders make more informed decisions.

Building a Strong Foundation

Core trading mechanics form the foundation of responsible market participation. Understanding bid and ask prices, spreads, leverage, and execution dynamics reduces confusion and improves clarity.
Many trading mistakes occur not because of poor analysis, but because of misunderstanding how trades are structured. A solid grasp of these mechanics helps traders approach markets with greater confidence and discipline.
In the next chapter, we move from mechanics to risk management — one of the most important components of long-term trading consistency.
05

Introduction to Risk Management

If there is one concept that separates sustainable trading from short-lived speculation, it is risk management.
Markets are uncertain by nature. No strategy wins all the time. Even well-researched ideas can fail due to unexpected data, sentiment shifts, or volatility spikes. The difference between traders who survive and those who disappear is not prediction accuracy — it is how much they risk when they are wrong.
Risk management is not about avoiding losses. It is about controlling them.

Risk Per Trade & Position Sizing

Before entering any trade, one question must be answered clearly: How much of your account are you willing to lose if this trade fails?
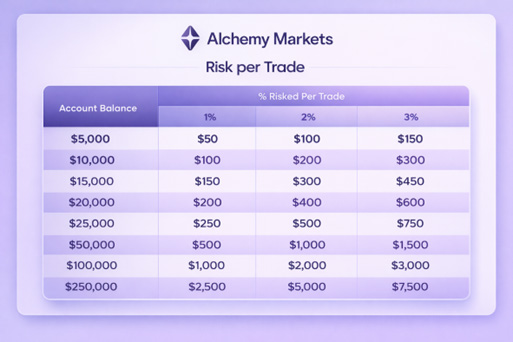
Below is the position sizing framework illustrating how risk per trade translates across different account sizes.
Risk per trade table showing 1%, 2% and 3% risked across account balances from $5,000 to $250,000
Position sizing always starts with one decision: how much of your account are you willing to lose if you are wrong. This is known as risk per trade, and it is the single most important variable in trading. Everything else flows from it.
Traders typically risk between 1% and 2% of their account per trade, and often less. This is not because they lack confidence, but because losing trades are unavoidable. Even strong strategies experience losing streaks. Keeping risk small ensures that a bad run causes damage, not destruction.
The stop-loss is what makes this possible. A stop is not just a technical level but also a risk-defining tool. Before entering any trade, you must know exactly where the idea is invalidated. Once that level is set, position size is calculated so that, if price hits the stop, the loss equals your predefined risk amount.
For example, if you decide to risk 1% of your account and your stop is 5% away, your position size must be small enough that a 5% move equals only a 1% account loss.
If the stop is tighter, the position can be larger. If the stop is wider, the position must be smaller. The stop determines the size, not your confidence in the trade.
Risking small amounts allows compounding to work without exposing the account to catastrophic drawdowns. A trader risking 1% can survive long losing streaks, remain emotionally stable, and continue executing their process. A trader risking 5–10% per trade may grow quickly when things go right, but they are mathematically set up to eventually blow up.
Good position sizing does not maximise returns in a single trade. It keeps you in the game long enough for your edge to play out. That is how real accounts grow.

Understanding Risk-to-Reward

Risk per trade defines how much you lose when wrong. Risk-to-reward determines whether a trade is worth taking in the first place.
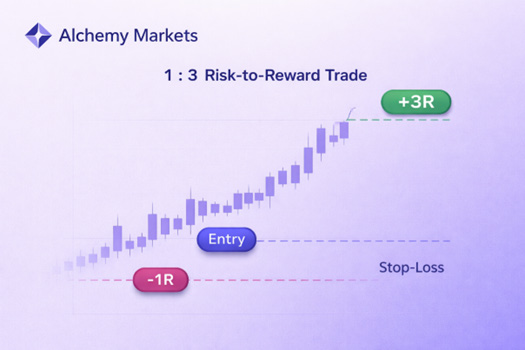
A 1:3 risk-to-reward trade with entry, -1R stop-loss and +3R target
Risk-to-reward answers a simple question: is this trade worth taking at all? You can be right only half the time and still make money if your winners are meaningfully larger than your losers.
At a basic level, risk is what you lose if your stop is hit. Reward is what you expect to make if the trade works. A 1:1 trade means you risk $1 to make $1. A 1:3 trade means you risk $1 to make $3. Professionals generally avoid anything below 1:2 unless the probability of success is unusually high.
What matters is not the ratio alone, but how it fits with your win rate. If you win 40% of the time, you need larger winners. If you win 60–65% of the time, you can tolerate slightly lower ratios. This relationship is what drives expectancy over many trades.
A common mistake is setting optimistic targets without justification. Reward should be based on realistic drivers: earnings revisions, multiple expansion, positioning unwinds, or a clear technical level where supply is likely to appear. If you cannot explain why the asset or security should move that far, the reward is probably imaginary.
Stops must also be credible. A tight stop improves the ratio on paper but increases the chance of being stopped out by normal volatility. A wide stop lowers the ratio but may better reflect the asset’s behaviour. There is no perfect answer, only consistency across many trades.
The professional mindset is simple: you do not need to trade everything. If the risk-to-reward is not there before entry, you pass.

Avoiding Overtrading

Overtrading is rarely about opportunity. It is usually about discomfort — discomfort with waiting, with missing moves, or with not feeling productive. In professional environments, this behaviour gets punished quickly.
The root cause is often a lack of predefined criteria. If you do not know exactly what qualifies as a trade, everything starts to look tradable. This leads to marginal setups, late entries, and weak catalysts.
The fix is structure. You should know in advance what conditions must be met before you act. That includes fundamental triggers, technical confirmation, and acceptable risk-to-reward. If those boxes are not ticked, there is no trade. This removes decision-making in the moment.
Another driver of overtrading is reacting to price instead of information. Price moving is not a catalyst. Price moving because something changed can be. Professionals wait for new information, not noise.
Position limits also help. A capped number of active positions forces you to choose the best ideas rather than adding more. If you are full, something must be removed before a new trade is added. This naturally raises quality.
You also need a review loop. If many trades end as small losers or scratches, that is often a sign of over-activity. Good trading frequently feels boring: long periods of waiting followed by short bursts of action.
The goal is not to trade often. The goal is to trade when it matters. Discipline here protects both your capital and your mental energy, which are equally important over time.

Why Risk Management Comes Before Strategy

Many new traders search endlessly for better entry techniques. However, risk management often matters more than the entry itself.
A mediocre strategy with disciplined risk control can survive. A strong strategy with poor risk control eventually fails.
Risk management ensures that no single trade determines your outcome. It allows you to stay consistent during losing streaks and stable during winning periods.
In the next chapter, we explore basic analytical approaches used across asset classes — including trend-following, support and resistance, and breakout strategies — always within the framework of disciplined risk management.
06

Basic Analytical Approaches Across Asset Classes

Once market structure and risk management are understood, the next step is learning how traders analyze price movement. There are many analytical methods available, but most approaches fall into a few broad categories.
This chapter introduces common analytical frameworks used across currencies, indices, and stocks. These are not guaranteed systems, but structured ways of interpreting market behaviour. The goal is not to find a perfect method, but to understand how different approaches fit within a disciplined risk framework.

Trend-Following

One of the most widely used approaches in financial markets is trend-following. The concept is simple: markets often move in directional phases, and traders attempt to participate in those movements rather than fight them.
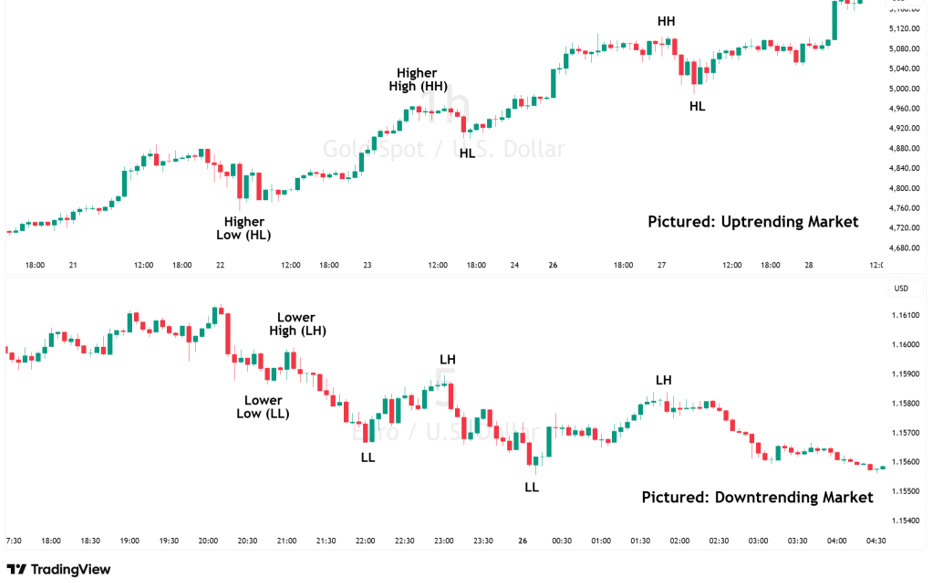
An uptrend typically forms when prices make higher highs and higher lows. A downtrend forms when prices make lower highs and lower lows. Identifying this structure allows traders to align their positions with prevailing momentum rather than attempting to predict reversals.
An uptrending market with higher highs and higher lows above a downtrending market with lower highs and lower lows
Trend-following can be applied across asset classes. In currency markets, trends may develop following shifts in interest rate expectations or macroeconomic divergence between countries. In equity indices, sustained economic optimism or earnings growth can drive longer-term upward trends. Individual stocks may trend based on company-specific developments, such as revenue expansion or sector leadership.
However, trends do not last indefinitely. Markets move in cycles of expansion and consolidation. Trend-following works best when volatility is directional and liquidity supports sustained movement. During range-bound conditions, trend strategies may produce false signals.
Understanding when markets are trending versus consolidating is an important skill that develops with experience.

Support and Resistance

Support and resistance are foundational concepts in technical analysis. These levels represent areas where price has historically reacted, either by reversing or consolidating.
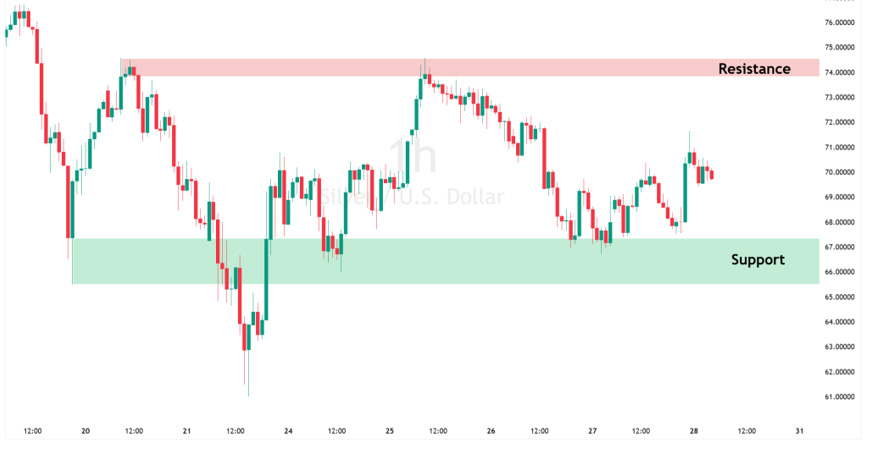
Support refers to a price level where buying interest has previously emerged. Resistance refers to a level where selling pressure has historically appeared. These zones often develop because market participants remember prior reactions and adjust their behaviour accordingly.
Support and resistance can be observed across currencies, indices, commodities, and stocks. In equities, earnings announcements may reinforce key levels. In FX markets, macroeconomic events may trigger reactions around previously established zones.
A price chart with highlighted support and resistance zones
It is important to recognize that support and resistance are not precise lines but areas of interest. Markets do not move with mathematical precision. Rather than expecting exact reversals, traders often view these areas as zones where probability may shift.
Stops and targets are often defined relative to these levels, reinforcing the connection between technical analysis and risk management.

Breakout Trading

Breakouts occur when price moves beyond a previously defined range or key level. This often signals a potential shift in supply and demand dynamics.
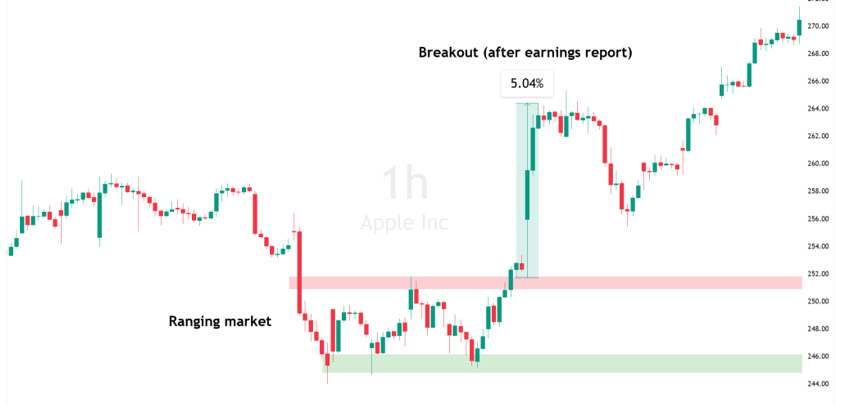
When markets trade within a range for an extended period, buyers and sellers reach temporary balance. A breakout suggests that one side has gained control, potentially initiating a new directional phase.
A ranging market breaking out of its range after an earnings report
Breakout strategies are commonly used during periods of increased volatility, such as after economic data releases or earnings announcements. In currency markets, central bank decisions can trigger breakouts. In equities, corporate guidance or sector developments may produce similar effects.
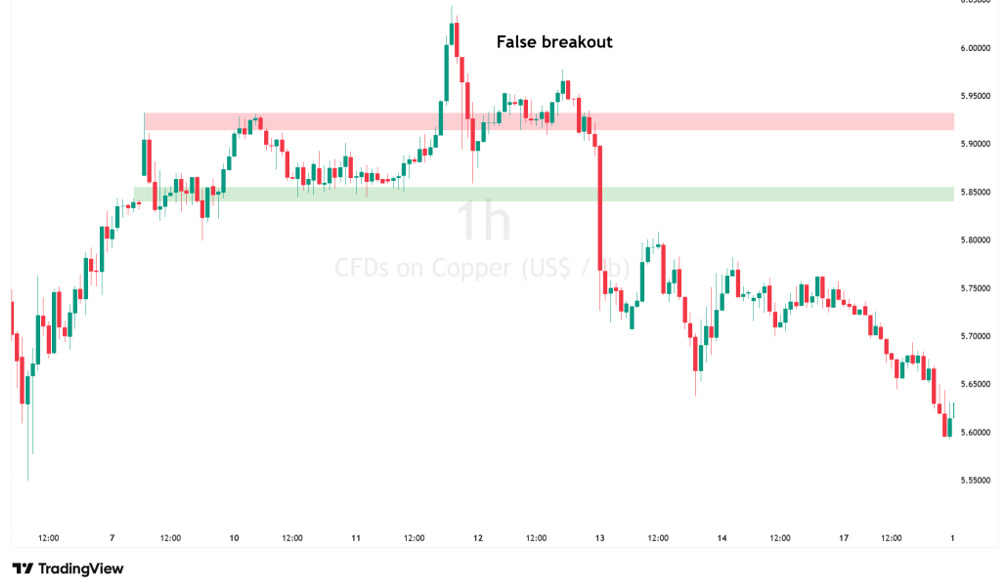
However, not all breakouts lead to sustained movement. False breakouts occur when price briefly moves beyond a level before returning into the range. This highlights the importance of confirmation and disciplined stop placement.
A false breakout on copper where price moves beyond resistance before reversing back into the range
Breakout trading often requires patience. Traders wait for structure to form before acting, rather than attempting to anticipate movement prematurely.

How Strategies Differ Across Asset Classes

Although analytical concepts are similar across markets, their application can vary.
In FX markets, macroeconomic data and interest rate expectations often drive directional moves. Trend-following may align with broader economic divergence themes. Breakouts may occur around central bank announcements or inflation data.
In equity indices, trends may reflect broader economic cycles, fiscal policy, or sector rotation. Support and resistance levels may be reinforced by institutional positioning and portfolio rebalancing.
Individual stocks can behave differently from indices. Company-specific earnings, management commentary, or competitive developments can trigger sharp moves independent of broader market conditions. As a result, traders often combine technical analysis with awareness of corporate calendars.
Commodities may respond more directly to supply disruptions, inventory reports, or geopolitical developments. Price movements can be influenced by factors unrelated to equity market sentiment.
Understanding these differences helps traders adapt their approach rather than applying the same method rigidly across all markets.

Strategy and Risk Must Work Together

No analytical approach eliminates uncertainty. Even well-structured strategies experience losing periods. That is why risk management must always come first.
Trend-following works when momentum persists. Support and resistance strategies work when levels hold. Breakout strategies work when new information drives sustained movement. Each approach performs differently depending on market conditions.
The key is consistency. Applying one structured approach within a clear risk framework is often more effective than constantly switching methods based on recent outcomes.
In the next chapter, we move beyond charts and structure to examine a factor that influences every trader, regardless of strategy: psychology.
07

Trading Psychology: The Silent Factor

Markets are analytical environments, but trading is a human activity. Charts, economic data, and structured strategies provide a framework, yet decisions are ultimately made by people. Emotions, biases, and reactions influence how traders interpret information and manage risk.
Many beginners assume that success depends primarily on finding the right strategy. In reality, psychological discipline often determines whether a strategy is applied consistently enough to work over time.
Trading psychology is sometimes overlooked because it is less visible than charts or indicators. However, it is one of the most important elements in long-term consistency.

Emotional Decision-Making

Financial markets trigger powerful emotions. Gains can create excitement and confidence. Losses can create frustration, doubt, or the urge to recover quickly. Rapid price movement can produce fear of missing out, while drawdowns can lead to hesitation.
These emotional responses are natural. The problem arises when decisions are driven by emotion rather than structure.
For example, increasing position size after a series of wins may feel justified in the moment, but it often introduces unnecessary risk. Likewise, avoiding valid setups after a losing streak may prevent a strategy from playing out as designed.
Emotional trading often results from focusing on outcomes rather than process. When attention shifts from “Did I follow my plan?” to “Did I make money today?”, consistency tends to decline.
Developing awareness of emotional reactions is the first step toward managing them. Recognizing discomfort, overconfidence, or impatience allows traders to pause rather than react impulsively.

Discipline and Patience

Discipline in trading means executing a plan consistently, even when short-term results fluctuate. Patience means waiting for predefined conditions rather than forcing opportunities.
Many trading errors occur not because of poor analysis, but because of impatience. Entering trades before confirmation, widening stops to avoid small losses, or closing positions prematurely are often emotional responses rather than strategic decisions.
Professional environments emphasize rule-based execution. Traders define criteria in advance and follow them without improvisation. This does not eliminate losses, but it reduces randomness.
Patience also involves accepting inactivity. There will be periods when market conditions do not align with a chosen approach. Waiting during these periods can feel uncomfortable, but forced trades rarely improve outcomes.
Over time, discipline becomes less about willpower and more about structure. When rules are clearly defined, decisions become simpler.

Building Consistency Over Time

Consistency is not achieved by avoiding losses. It is achieved by applying the same framework repeatedly across many trades.
Even strong analytical approaches experience drawdowns. Losses do not necessarily indicate failure. They are part of probability. The key is ensuring that losses remain controlled and that winning trades are allowed to develop according to plan.
One of the most effective tools for improving consistency is review. Keeping a trading journal allows traders to evaluate whether decisions were aligned with predefined criteria. Reviewing past trades objectively can reveal patterns, both positive and negative.
Consistency also requires realistic expectations. Markets do not produce steady gains every week. Performance often comes in cycles. Accepting variability reduces the emotional pressure to force results.

Managing Losing Streaks

Losing streaks are unavoidable in trading. Even strategies with positive long-term expectancy can experience multiple consecutive losses.
The psychological challenge during losing periods is maintaining confidence in the process without becoming reckless. Increasing position size to recover losses quickly often compounds the problem. Abandoning a structured approach after a short drawdown may prevent long-term edge from playing out.
This is where disciplined position sizing becomes critical. When risk per trade is kept small, losing streaks become manageable rather than destructive. Emotional stability improves when the account is not exposed to large fluctuations.
The goal is not to eliminate discomfort entirely. It is to ensure that discomfort does not dictate behaviour.

Avoiding Overconfidence

Winning streaks can be psychologically challenging as well. Success may lead to overconfidence, larger position sizes, or deviation from the original plan.
Markets can quickly shift from favorable to unfavorable conditions. Traders who expand risk aggressively after short-term gains may expose themselves to unnecessary volatility.
Maintaining consistent risk parameters during both winning and losing periods helps stabilize performance. Emotional neutrality is often more valuable than temporary excitement.

Psychology and Long-Term Growth

Trading psychology is not about suppressing emotion entirely. It is about recognizing emotion without allowing it to control decisions.
Structured risk management, predefined criteria, and disciplined review processes reduce emotional pressure. Over time, experience builds familiarity with volatility, reducing reactive behavior.
Consistency in trading does not come from predicting every move correctly. It comes from executing a structured plan across many market cycles while managing both capital and mindset.
In the next chapter, we explore tools that support decision-making — including charting platforms, indicators, and structured analysis techniques — and how they fit within a disciplined trading framework.
08

Tools That Help Traders Make Better Decisions

Successful trading is not built on intuition alone. It relies on structured analysis, reliable data, and tools that help interpret market information clearly. While no tool can eliminate uncertainty, the right combination of platforms and indicators can improve clarity and consistency.
The purpose of tools is not to predict the future. Their role is to support disciplined decision-making within a defined framework.

Charting Platforms

Charting platforms are the foundation of most trading analysis. They allow traders to view price history across different timeframes, identify trends, mark support and resistance zones, and observe volatility patterns.
A well-designed chart provides context. It allows traders to zoom out and see broader market structure or zoom in to examine short-term price behaviour. Switching between timeframes can help identify whether a move is part of a larger trend or a smaller correction within it.
Modern charting platforms also allow customization, including drawing tools, trend lines, and technical overlays. While these features can be useful, clarity should always take priority over complexity. Overloading a chart with too many indicators can obscure rather than improve understanding.
At its core, a chart is simply a visual record of supply and demand over time. Used properly, it helps traders interpret behaviour rather than guess direction.

Technical Indicators

Technical indicators are mathematical calculations based on price, volume, or volatility. They are designed to help identify trends, momentum shifts, or potential areas of interest.
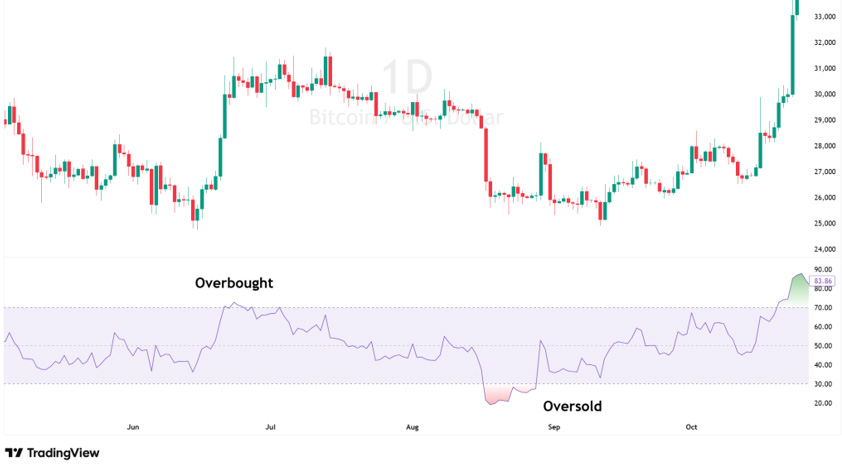
Some indicators measure trend direction, while others measure momentum or volatility. Moving averages, for example, can smooth price data to highlight directional bias. Oscillators may indicate overbought or oversold conditions. Volatility measures can reflect how aggressively prices are moving.
It is important to understand that indicators do not predict outcomes. They interpret past price behaviour. As a result, they work best when used to confirm broader analysis rather than replace it.
Relying on too many indicators can lead to conflicting signals and hesitation. Many experienced traders prefer simplicity — using a small number of tools consistently rather than constantly switching methods.

Sentiment and Market Positioning Tools

Beyond price and indicators, market sentiment tools attempt to measure how participants are positioned or feeling about a particular asset.
Sentiment data may include positioning reports, volatility indices, or aggregate trader positioning metrics. These tools can provide insight into whether markets appear broadly optimistic, cautious, or defensive.
Bitcoin price chart with a momentum oscillator marking overbought and oversold conditions
For example, if positioning becomes heavily one-sided, markets may become vulnerable to reversals should expectations shift. However, sentiment extremes can persist longer than expected, so these tools should be interpreted carefully.
Sentiment analysis works best as contextual information rather than as a standalone trigger.

Economic Calendars and News Flow

Scheduled economic releases are among the most influential drivers of short-term volatility, particularly in currency and index markets. Economic calendars provide visibility into upcoming data such as inflation reports, employment figures, and central bank decisions.
Knowing when major announcements are scheduled helps traders prepare for potential increases in volatility. It also allows for better timing and risk management decisions.
Corporate earnings calendars serve a similar purpose for equity traders. Being aware of earnings dates reduces the likelihood of unexpected volatility caused by scheduled company updates.
Monitoring news does not require constant attention, but awareness of major catalysts is essential.

Why Professional-Grade Tools Matter

Execution quality, data accuracy, and platform stability can influence the trading experience. Professional-grade tools typically provide more reliable price feeds, faster order processing, and advanced analytical features.
While tools alone do not guarantee results, reliable infrastructure reduces avoidable friction. Accurate data supports clearer analysis. Efficient execution reduces the risk of unnecessary slippage.
However, it is important to remember that tools enhance process — they do not replace discipline. The most advanced platform cannot compensate for inconsistent risk management or emotional decision-making.

Simplicity and Consistency

The effectiveness of tools depends less on their complexity and more on how consistently they are used. A simple chart with clearly defined levels and structured risk parameters can be more powerful than a complex setup filled with rarely understood indicators.
Consistency builds familiarity. Familiarity improves confidence. Over time, structured tool usage supports disciplined execution.
In the next chapter, we bring together everything covered so far — market structure, asset classes, risk management, strategy, psychology, and tools — into a simple, practical framework.
09

Putting It All Together

By now, you have explored how global markets function, how different asset classes behave, how trading mechanics work, and why risk management and psychology matter. The final step is integration.
Knowledge alone does not improve results. Application does.
Trading becomes clearer when structure replaces impulse. Rather than reacting to every movement, a trader operates within a defined framework that connects analysis, risk control, and execution discipline.
This chapter outlines how to combine what you have learned into a practical and repeatable process.

Choosing the Right Market for Your Goals

Not all markets suit all traders.
Currencies tend to be influenced by macroeconomic trends and central bank policy. They offer extended trading hours and strong liquidity during major sessions. Indices reflect broader economic sentiment and can provide exposure to entire markets. Individual stocks allow for targeted exposure to specific companies or sectors. Commodities often respond directly to supply-demand dynamics and geopolitical developments.
Selecting a market should be based on understanding, comfort with volatility, and alignment with your available time. For example, traders who prefer structured economic data releases may focus on FX. Those interested in corporate developments may prefer equities. Those seeking exposure to broader sentiment may consider indices.
There is no universal answer. The key is clarity. Specializing in one or two markets often produces better understanding than switching constantly between asset classes.

Building a Simple Trading Plan

A trading plan does not need to be complicated. In fact, simplicity improves consistency.
At a minimum, a structured plan should define:
  • What market you trade
  • What conditions qualify as a setup
  • How risk per trade is calculated
  • Where stops are placed
  • What minimum risk-to-reward is acceptable
  • How trades are reviewed
These elements remove ambiguity. When criteria are clearly defined, decisions become less emotional and more mechanical.
A simple example might involve trading trending currency pairs during active sessions, risking 1% per trade, and targeting a minimum 1:2 risk-to-reward ratio. Another trader might focus on equity breakouts around earnings with clearly defined technical levels.
The specifics matter less than the structure. What matters is that the rules exist before the trade is placed.

Connecting Risk Management to Strategy

Risk management is not separate from strategy — it defines strategy.
Position sizing determines exposure. Stop placement defines invalidation. Risk-to-reward determines whether a setup is worth taking. Psychology determines whether the plan is followed.
When these elements work together, trading becomes a process rather than a series of isolated decisions.
It is also important to accept that no plan eliminates uncertainty. Even well-structured strategies experience losing trades. The goal is not perfection. The goal is repeatability.

Practicing in a Risk-Free Environment

Before applying real capital, practice plays a critical role.
A risk-free environment allows traders to test:
  • Their understanding of market mechanics
  • Their ability to follow position sizing rules
  • Their emotional response to wins and losses
  • The consistency of their execution
Practice reveals whether theoretical knowledge translates into disciplined behaviour. Many mistakes become visible only when trades are executed in real time.
Practicing also helps refine expectations. Markets rarely move in perfectly clean patterns. Learning to manage partial pullbacks, volatility spikes, and imperfect entries builds practical experience.
The objective of practice is not to generate artificial returns. It is to develop process discipline.

Reviewing and Adjusting

Once trades are placed — whether in practice or live conditions — review becomes essential.
After each trade, questions should be asked:
  • Did I follow my criteria?
  • Was my risk size correct?
  • Was the stop placed logically?
  • Did emotion influence execution?
Review shifts focus from outcome to behaviour. A losing trade executed correctly is not a failure. A winning trade executed recklessly is not a success.
Over time, patterns emerge. Strengths become clear. Weaknesses become visible. Adjustments can then be made deliberately rather than emotionally.

From Knowledge to Consistency

Putting everything together means moving from isolated concepts to a structured workflow:
  • Understand the market.
  • Wait for defined conditions.
  • Calculate risk before entry.
  • Execute consistently.
  • Review objectively.
When these steps are followed repeatedly, trading becomes less about reacting to noise and more about executing a defined process.
In the final chapter, we look ahead — exploring how traders continue developing beyond the basics and how learning evolves over time.
10

Next Steps in Your Trading Journey

Learning how markets work is the first step. Applying that knowledge consistently is the real challenge.
Trading is not mastered in a single week or even a single year. It is a process of observation, practice, adjustment, and gradual refinement. The foundation you have built in this guide — understanding asset classes, market sessions, trading mechanics, risk management, strategy, psychology, and tools — is designed to give you structure. What comes next is repetition.
Progress in trading is rarely dramatic. It is incremental.

Why Practice Matters

Practice bridges the gap between theory and execution.
Reading about position sizing is different from calculating it before every trade. Understanding risk-to-reward conceptually is different from applying it consistently under pressure. Recognising emotional impulses is different from controlling them in real time.
Practicing in a structured, risk-free environment allows traders to develop mechanical discipline before capital is exposed to real market fluctuations. It builds familiarity with volatility and reduces emotional intensity.
More importantly, practice reveals gaps in understanding. It shows whether rules are truly defined or loosely interpreted. It highlights whether risk limits are respected consistently.
Improvement comes from this feedback loop.

Learning From Market Data

Markets are dynamic. Economic cycles shift. Policy environments evolve. Sectors rotate. New technologies emerge. What works in one environment may not work in another.
Staying informed about macroeconomic developments, corporate earnings, and global trends deepens contextual awareness. Over time, traders begin to recognise patterns — not identical repetitions, but similarities in behaviour during comparable conditions.
However, learning from markets does not mean chasing every headline. It means observing how price reacts to information. Sometimes markets move strongly on modest news. Sometimes major announcements produce limited impact. These reactions offer insight into positioning and sentiment.
Experience builds perspective. Perspective reduces overreaction.

Preparing to Advance Beyond the Basics

As understanding deepens, traders often refine their focus.
Some choose to specialise in a specific asset class. Others narrow their approach to one or two structured strategies. Many refine their risk parameters as consistency improves.
Advancement does not mean increasing complexity. In many cases, experienced traders simplify rather than expand. They remove unnecessary indicators. They reduce frequency. They become more selective.
Consistency often improves when clarity increases.

Managing Expectations

One of the most important aspects of long-term development is realistic expectation.
Markets do not provide steady returns on demand. They provide opportunity intermittently. There will be periods of strong performance and periods of stagnation or drawdown. Accepting this variability prevents emotional extremes.
Sustainable growth is built through controlled risk, disciplined execution, and patience. Compounding works gradually. It rewards stability more than aggression.
Short-term excitement rarely builds long-term accounts.

Staying Structured

The principles outlined in this guide remain constant:
  • Understand how markets function.
  • Define your criteria before entry.
  • Control risk before calculating reward.
  • Execute consistently.
  • Review objectively.
Markets will continue to evolve. New technologies will influence trading. Economic cycles will shift. But disciplined structure remains relevant across environments.

A Continuous Process

Trading is not a destination. It is a continuous process of learning and adaptation.
Each trade provides feedback. Each cycle builds experience. Each review strengthens discipline.
The objective is not perfection. It is improvement.
By focusing on structure rather than prediction, risk control rather than excitement, and process rather than short-term results, traders place themselves in a position to develop steadily over time.
Your journey does not begin with the perfect trade. It begins with consistent decisions.
Alchemy Markets is a global multi-asset brokerage providing access to currencies, equities, indices, commodities, and digital assets. The firm focuses on transparent execution, advanced trading tools, and institutional-grade trading conditions for retail and professional clients.
Alchemy International Ltd, trading as Alchemy Markets, is registered in the Republic of Seychelles with registration number 8429852-1. We are authorized and regulated by the Seychelles Financial Services Authority (FSA) under License No. SD136.
Registered Office: Office 2C, CT House, Providence, Mahe, Seychelles.
Crestmark Trading Ltd, trading as Alchemy Markets is regulated by the Malta Financial Services Authority (MFSA) under License No. IS/56519 for investment services
Registered Office: Portomaso Business Centre, Portomaso PTM 01, St Julian’s STJ 4011, Malta. Company Registration No. C/56519.
Risk Warning:
Trading leveraged products, such as Contracts for Difference (CFDs) and spread betting, carries a high level of risk. These products may not be suitable for everyone. You could lose more than your initial investment, so it’s important to only trade with money you can afford to lose.
Before you start trading, make sure you fully understand the risks involved, as detailed in our Risk Disclosure Statement. It’s your responsibility to ensure that trading these products is legal in your country. If you’re unsure, please check with local authorities before proceeding. We strongly recommend speaking with independent financial, legal, or tax professionals before getting started. Nothing on this website should be considered investment advice or a solicitation from Alchemy Markets.