12 Global Stocks in Focus for 2026

Themes, Trends & Market Developments
Disclaimer
This report is provided for educational and informational purposes only. It does not constitute investment advice, a recommendation, or an offer to buy or sell any financial instrument. References to specific companies are for analysis and market education, not trading signals. Markets involve risk and can move rapidly. Past performance is not indicative of future results.

12 Global Companies Across Key Sectors & Structural Themes

Global equity markets in 2026 continue to evolve under the influence of technological transformation, infrastructure investment, healthcare innovation, capital market dynamics, and shifting consumer behavior. While short-term volatility remains a feature of financial markets, longer-term structural themes provide a more stable framework for monitoring developments.
This report adopts a thematic approach to equity analysis. Rather than focusing on predictions or price targets, it identifies twelve globally relevant companies operating at the center of major economic and industry shifts. These companies were selected based on market relevance, sector representation, liquidity, and exposure to structural themes shaping global markets.
The objective is not to recommend action, but to provide structure.

Key Themes Shaping 2026

Technology & AI Infrastructure

Artificial intelligence, data center expansion, and enterprise digitization continue to influence semiconductor demand, cloud investment, and infrastructure scaling. Companies enabling accelerated computing, networking, and software integration remain central to this transformation.

Semiconductor Manufacturing & Supply Chains

Advanced chip production has become strategically significant across industries. Capital intensity, node transitions, and geopolitical considerations remain defining characteristics of the sector.

Energy Infrastructure & Grid Modernization

Electrification trends and grid upgrades continue to drive infrastructure investment across regions. Energy systems are evolving, requiring long-term capital commitments and policy coordination.

Healthcare & Therapeutic Innovation

Chronic disease management and metabolic health remain prominent areas of medical innovation. Regulatory frameworks, pricing models, and clinical progress continue to shape sector visibility.

Financial Infrastructure & Capital Flows

Digital payments, cross-border activity, and asset allocation trends reflect broader consumption and investment dynamics. Payment networks and asset managers provide insight into global economic activity.

Consumer Behavior & Retail Resilience

Inflation, wage growth, and employment conditions influence household spending patterns. Membership-based and value-oriented retail models offer perspective on consumer discipline and demand trends.

The Twelve Companies in Focus

The selected companies span six major sectors:
Technology & AI Infrastructure
  • NVIDIA
  • Microsoft
  • ASML
Semiconductors & Connectivity
  • Taiwan Semiconductor Manufacturing Company
  • Broadcom
Energy Transition & Industrials
  • Siemens Energy
Healthcare & Biopharma Innovation
  • Eli Lilly
  • Novo Nordisk
Financial Infrastructure & Capital Markets
  • Visa
  • Mastercard
  • BlackRock
Consumer & Global Brands
  • Costco Wholesale
Together, these firms represent a cross-section of industries shaping global equity markets in 2026.

How to Use This Report

This report is designed as a structured monitoring framework.
It encourages:
  • Contextual interpretation of earnings
  • Cross-sector comparison
  • Awareness of macroeconomic influences
  • Recognition of regulatory exposure
  • Separation of analysis from recommendation
Markets evolve continuously. Expectations adjust. Structural themes strengthen or weaken over time. Maintaining disciplined observation can help improve clarity in dynamic conditions.
This report is provided for educational purposes only and does not constitute investment advice.
01

Introduction: Understanding Equity Markets Through Themes

Equity markets represent a complex interaction between corporate fundamentals, macroeconomic conditions, industry developments, and investor expectations. While daily price movements often capture attention, longer-term equity behavior is typically shaped by structural forces that unfold gradually and interact across sectors and regions.
Publicly listed companies operate within broader economic systems. Their revenues, margins, and capital allocation decisions are influenced not only by internal execution but also by technological change, regulatory developments, geopolitical dynamics, and shifts in consumer or enterprise demand. For this reason, analyzing equities through isolated headlines or short-term price reactions can provide an incomplete picture.
This report adopts a thematic framework to structure analysis. Rather than focusing on near-term forecasts, it examines broader forces shaping global markets in 2026 and places selected companies within those contexts. A thematic approach does not eliminate uncertainty, nor does it imply predictive certainty. Instead, it provides a disciplined structure for monitoring developments as they unfold.
Monitoring key global companies can offer insight beyond their individual share prices. Large, widely followed firms often act as reference points for broader industry trends. When infrastructure providers adjust capital expenditure guidance, it may reflect wider investment cycles. When healthcare companies report on clinical progress, the implications may extend to regulatory and competitive dynamics across the sector. Payment networks can offer indirect insight into consumer spending trends, while semiconductor manufacturers may signal shifts in technology demand and supply chain conditions.
Understanding the distinction between analysis and recommendation is central to responsible market engagement. Analysis seeks to clarify how a business model operates, what influences its earnings, and what risks may affect it. A recommendation, by contrast, implies an action. This report provides analysis only. It does not offer price targets, trading signals, or directional guidance. The companies included here are selected for their relevance to global themes and sector representation, not because of anticipated performance outcomes.
A watchlist, when used responsibly, is a monitoring tool rather than a predictive mechanism. Professional market participants often maintain structured lists of companies that represent important sectors, structural themes, or liquidity benchmarks. The purpose of such lists is to facilitate systematic observation. Earnings releases, regulatory updates, capital allocation decisions, and macroeconomic developments can then be evaluated within a predefined analytical framework. This approach encourages preparation rather than reaction.
Themes serve as interpretive lenses. Interest rate environments, inflation trends, currency movements, policy shifts, and geopolitical developments all influence corporate behavior. When semiconductor demand accelerates, it may reflect broader digital infrastructure expansion rather than isolated company success. When healthcare policy evolves, it may reshape pricing frameworks across multiple firms. When consumer spending patterns shift, the impact can be observed across payments, retail, and logistics businesses simultaneously.
It is also useful to distinguish between cyclical and structural forces. Cyclical dynamics tend to follow economic fluctuations, including changes in growth rates, credit conditions, and inventory cycles. Structural forces unfold over longer horizons and may include technological adoption, demographic shifts, infrastructure modernization, and regulatory transformation. Many companies operate at the intersection of these forces, making contextual analysis particularly important.
Financial markets are forward-looking but imperfect. Prices reflect expectations about future earnings, risk conditions, liquidity availability, and prevailing narratives. Because expectations can change rapidly, equity prices may adjust even when underlying fundamentals appear stable. Conversely, strong reported results may not translate into sustained price appreciation if expectations were already elevated. Recognizing this dynamic can help reduce reactive behavior.
This report is organized to support structured analysis. It begins by examining the global themes influencing equity markets in 2026. It then discusses the role of stocks within a diversified market framework before presenting individual company profiles using a consistent analytical template. The objective is clarity, consistency, and disciplined monitoring rather than speculation.
Markets evolve continuously. Themes shift, competitive dynamics change, and regulatory landscapes adapt. A structured analytical framework can help market participants remain informed without relying on short-term noise.
02

Global Market Themes Shaping 2026

Global equity markets in 2026 continue to be influenced by a combination of technological transformation, infrastructure investment, healthcare innovation, capital market evolution, and changing consumer behavior. These forces interact with macroeconomic variables such as interest rates, inflation, and geopolitical developments, creating a dynamic and interconnected market environment.
One of the most prominent themes remains the continued expansion of technology infrastructure and automation. Enterprises across industries are investing in digital systems designed to improve productivity, enhance data processing capabilities, and support large-scale computing workloads. Cloud infrastructure, enterprise software integration, and automated manufacturing processes have become central components of corporate strategy. While adoption levels vary by industry and region, technology-driven capital expenditure remains a meaningful area of market attention.
Artificial intelligence and data infrastructure represent an extension of this broader technological shift. In 2026, AI is no longer viewed solely as experimental. It is increasingly integrated into enterprise systems, consumer applications, and data analytics platforms. The growth of AI-driven workloads has implications for semiconductor demand, networking infrastructure, power consumption, and data center capacity. At the same time, regulatory discussions surrounding AI governance and cross-border technology transfer remain active. Monitoring both adoption rates and policy developments provides context for evaluating companies operating within this ecosystem.
Semiconductor supply chains continue to occupy a strategically significant position in global markets. Advanced manufacturing capacity, lithography technology, and chip design innovation remain critical components of modern economic infrastructure. Governments in several regions view semiconductor manufacturing as strategically important, influencing industrial policy and capital allocation decisions. The industry’s capital-intensive nature introduces cyclicality, as periods of strong demand may be followed by capacity adjustments. Observing capital expenditure guidance, node transitions, and geopolitical considerations can offer insight into sector-level momentum.
Energy systems and infrastructure modernization represent another structural theme. Electrification trends, renewable energy integration, and grid upgrades require sustained investment across multiple regions. Industrial companies involved in power generation, transmission systems, and grid technologies operate within long investment cycles that are influenced by policy incentives and financing conditions. While the broader narrative often focuses on energy transition, company-level performance frequently depends on project execution, cost management, and regulatory clarity.
Healthcare innovation continues to shape equity markets, particularly in areas such as chronic disease management and metabolic health. Advances in therapeutics, clinical trial outcomes, and regulatory approvals influence investor attention and sector valuations. At the same time, pricing frameworks, reimbursement policies, and political scrutiny can affect competitive dynamics. The healthcare sector illustrates how scientific progress and regulatory oversight intersect, creating both opportunity and uncertainty.
Financial infrastructure and capital market evolution also remain important themes. Payment networks reflect trends in digital commerce, cross-border activity, and consumer spending. Asset managers provide insight into capital flows, investor risk appetite, and allocation trends across equities, fixed income, and alternative assets. Changes in interest rate expectations and liquidity conditions can influence flows and fee structures within these businesses.
Consumer behavior represents another key variable. Inflation dynamics, wage growth, employment stability, and credit availability all influence household spending patterns. In some environments, consumers may shift toward value-oriented retail models or adjust discretionary expenditures. Monitoring large, membership-based retailers and payment processors can provide indirect insight into broader economic conditions.
Macroeconomic factors continue to serve as an overarching influence across all themes. Interest rate levels affect discount rates applied to corporate earnings and can alter valuation multiples. Inflation trends influence input costs and pricing strategies. Currency movements affect multinational revenue translation and competitiveness. Geopolitical developments may reshape supply chains and regulatory landscapes. While these variables are external to individual companies, they materially influence equity performance.
Importantly, these themes do not operate independently. Technology infrastructure expansion may increase energy demand, linking data center growth with grid modernization. Semiconductor supply constraints may affect enterprise deployment timelines. Consumer resilience influences payment volumes and retail performance, which in turn affect broader economic sentiment. Interest rate expectations can shape valuation dynamics across growth-oriented sectors.
The twelve companies included in this report were selected because they operate within or are significantly influenced by these interconnected themes. They represent diverse sectors, geographic exposures, and business models, allowing for cross-sector comparison within a unified analytical framework.
Understanding these themes does not imply predicting outcomes. Rather, it provides context. By monitoring how structural and cyclical forces evolve throughout 2026, market participants can interpret company developments within a broader and more disciplined framework.
03

The Role of Stocks in a Diversified Trading Approach

Equities represent ownership in publicly listed companies and reflect expectations about future earnings, growth prospects, capital allocation discipline, and broader economic conditions. Unlike currencies, which are driven by macroeconomic differentials, or commodities, which are influenced by supply-demand balances, stocks incorporate both company-specific fundamentals and cross-asset market dynamics.
Understanding how equities function within a broader financial ecosystem can help market participants interpret price movements with greater clarity and context.

Equities in Relation to Other Asset Classes

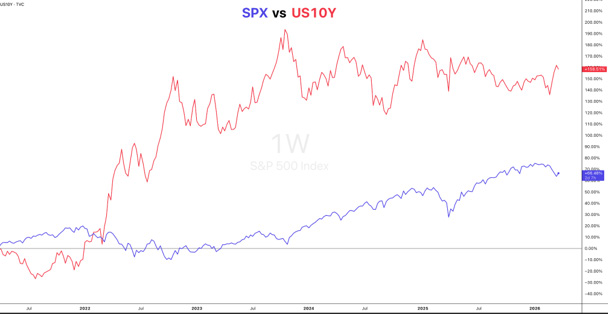
S&P 500 index performance compared with US 10-year Treasury yields
Stocks do not operate independently from other markets. Their performance is often shaped by developments in foreign exchange, fixed income, and commodities. Viewing equities through a cross-asset lens allows for more structured interpretation of market developments.
Foreign exchange markets, for example, reflect relative economic performance, inflation differentials, and interest rate expectations between countries. Multinational corporations generate revenues in multiple currencies, meaning exchange rate movements can influence reported earnings, competitive positioning, and cost structures. Currency volatility may therefore affect equities indirectly, particularly for companies with global operations.
Commodity markets provide another layer of context. Energy prices, industrial metals, and agricultural commodities can affect corporate margins and demand conditions. Rising input costs may compress profitability in certain industries, while falling commodity prices can influence capital expenditure decisions and sector-level performance. Energy producers, industrial manufacturers, and transportation companies often demonstrate sensitivity to commodity cycles, though the nature of that sensitivity varies.
Fixed income markets and interest rate trends also play a critical role in equity valuation. Changes in policy rates influence borrowing costs, discount rates applied to future earnings, and investor allocation decisions between asset classes. Growth-oriented companies, whose valuations may depend more heavily on long-term earnings expectations, can react differently to interest rate shifts than businesses with more stable, near-term cash flows. Monitoring bond yields and central bank communication can therefore provide insight into potential valuation pressure across sectors.

Earnings Cycles and Corporate Sensitivity

One of the defining characteristics of equities is their sensitivity to corporate-specific events. Public companies typically report earnings on a quarterly basis, providing updates on revenue trends, profit margins, capital expenditure plans, and forward guidance. These announcements can generate volatility, particularly when reported results diverge from market expectations.
Importantly, equity price reactions often reflect the gap between expectations and outcomes rather than the absolute strength of reported figures. A company delivering solid growth may still experience volatility if market expectations had been elevated. Conversely, moderate results may be well received if prior expectations were conservative.
Beyond earnings, companies may respond to regulatory decisions, product launches, strategic acquisitions, litigation developments, or changes in executive leadership. In sectors such as healthcare, clinical trial results and regulatory approvals can materially influence outlooks. In technology, product roadmaps and innovation cycles can shift competitive positioning. Recognizing the event calendar associated with a company can improve monitoring discipline and reduce reactive decision-making.

Market Regimes and Behavioral Shifts

Equities also behave differently depending on broader market conditions. During periods characterized by strong economic momentum and supportive liquidity, capital often flows toward growth-oriented sectors and innovation-driven companies. In such environments, investor sentiment may amplify positive narratives, and volatility can decline as confidence builds.
In contrast, during periods of heightened uncertainty or macroeconomic stress, capital allocation may shift toward defensive sectors, companies with stable cash flows, or businesses perceived to have resilient balance sheets. Increased volatility and risk aversion can alter correlations across sectors and influence rotation patterns within equity indices.
Inflation dynamics add another layer of complexity. Rising input costs may pressure margins in some industries, while companies with pricing power or essential products may navigate inflationary environments differently. Similarly, shifts in interest rate expectations can influence valuation multiples across growth and value segments of the market.
Understanding these shifting regimes does not imply predicting them. Rather, it emphasizes the importance of contextual interpretation when evaluating company-specific developments.

Sector Rotation and Capital Allocation

Equity markets frequently experience sector rotation, reflecting changing macroeconomic conditions, valuation considerations, and investor preferences. Capital may move between industries as economic cycles evolve, technological adoption accelerates, or regulatory developments reshape competitive landscapes.
For example, investment-driven expansions may favor infrastructure, semiconductor manufacturing, and industrial automation. Consumer resilience may support retail and payments-related businesses. Conversely, periods of tightening financial conditions may shift focus toward companies perceived as defensive or cash-flow stable.
These rotations are rarely permanent and often reflect relative positioning rather than structural superiority. Observing how capital flows across sectors can provide insight into broader market sentiment and risk tolerance.

Equities Within a Broader Framework of Risk

While equities can offer exposure to innovation, productivity, and long-term economic growth, they also carry multiple layers of risk. Market risk reflects overall sentiment and macro conditions. Company-specific risk arises from execution challenges, competitive pressure, or operational setbacks. Liquidity risk can emerge during periods of market stress, and behavioral risk may influence price movements when narratives shift quickly.
A diversified trading or investment framework recognizes these risks and seeks to contextualize them. Cross-asset awareness, macro sensitivity, and disciplined monitoring can contribute to more structured decision-making.

Connecting This Framework to the Watchlist

The twelve companies included in this report operate across technology infrastructure, semiconductor manufacturing, energy systems, healthcare innovation, financial infrastructure, and consumer retail. Each sector responds differently to macro conditions, policy developments, and capital expenditure cycles.
By understanding how equities interact with currencies, commodities, interest rates, and broader sentiment regimes, readers can interpret developments affecting these companies within a wider analytical framework. This perspective supports more objective monitoring and reduces reliance on isolated price movements.
The next chapter applies this structured approach to detailed company profiles, using a consistent analytical template across sectors.
04

Stocks in Focus for 2026

The companies included in this chapter were selected to represent key global sectors and structural themes shaping equity markets in 2026. Each operates at a scale that attracts broad institutional attention and plays a meaningful role within its respective industry.
These profiles are not investment recommendations. They are structured analyses designed to support monitoring and contextual understanding. Each company is evaluated through a consistent framework: business model, industry positioning, structural exposure, key monitoring factors, and relevant risks.
The objective is to provide clarity rather than conviction.
01

NVIDIA (NVDA)

Technology & AI Infrastructure
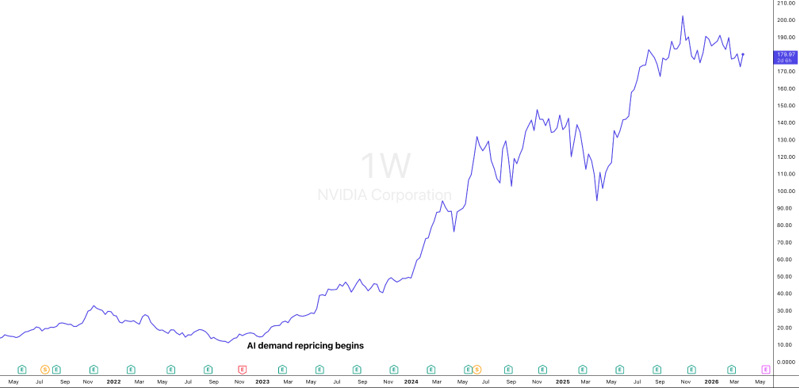
NVIDIA (NVDA) long-term weekly price chart

Company Overview

NVIDIA designs high-performance computing hardware and software platforms primarily used in data centers, artificial intelligence workloads, enterprise computing environments, and advanced graphics applications. Over time, its revenue composition has shifted significantly toward data center and AI-related demand, reflecting broader technological transformation across industries.
The company operates on a fabless semiconductor model, outsourcing manufacturing while focusing internally on chip design, software ecosystems, and system integration. Its geographic exposure is global, with customers spanning cloud providers, enterprise organizations, research institutions, and technology firms across multiple regions.
Core revenue drivers are closely linked to demand for accelerated computing, AI model training and inference workloads, and high-performance networking infrastructure supporting data center expansion.

Industry & Sector Context

NVIDIA operates within the broader semiconductor and AI infrastructure ecosystem. The sector is influenced by capital expenditure cycles among hyperscale cloud providers, enterprise digitization efforts, and innovation in compute architecture.
The competitive landscape includes both traditional semiconductor firms and emerging alternative accelerator architectures. Technological differentiation, software ecosystem strength, and supply chain resilience remain key elements of competitive positioning.
The company’s market relevance extends beyond its own earnings performance. It is widely viewed as an indicator of AI infrastructure investment trends and broader semiconductor demand conditions.

Key Factors to Monitor

Earnings cycles are particularly important, as quarterly results often provide insight into data center demand visibility and forward-looking commentary on capital expenditure trends.
Regulatory developments, including export controls and technology governance frameworks, may influence geographic revenue distribution and supply chain decisions.
Innovation remains central to the company’s positioning. Monitoring product roadmap execution, architecture transitions, and software ecosystem expansion provides insight into competitive durability.
Macroeconomic conditions, including interest rate expectations and enterprise spending cycles, can influence both valuation sensitivity and infrastructure investment appetite.

Risk Considerations

Sector-specific risks include cyclical fluctuations in semiconductor demand, overcapacity following periods of strong capital expenditure, and technological disruption from alternative computing architectures.
Company-specific challenges may involve supply chain constraints, customer concentration among large cloud providers, and the need to maintain innovation leadership amid intensifying competition.
Broader market risks include shifts in risk appetite, interest rate volatility, and geopolitical developments affecting semiconductor trade flows.

Why This Stock Is on the Watchlist

NVIDIA’s inclusion reflects its central role in AI infrastructure development and its exposure to structural themes related to accelerated computing and data center expansion. The company commands significant investor attention and often serves as a reference point for technology capital expenditure trends.
02

Microsoft (MSFT)

Enterprise Software & Cloud Infrastructure
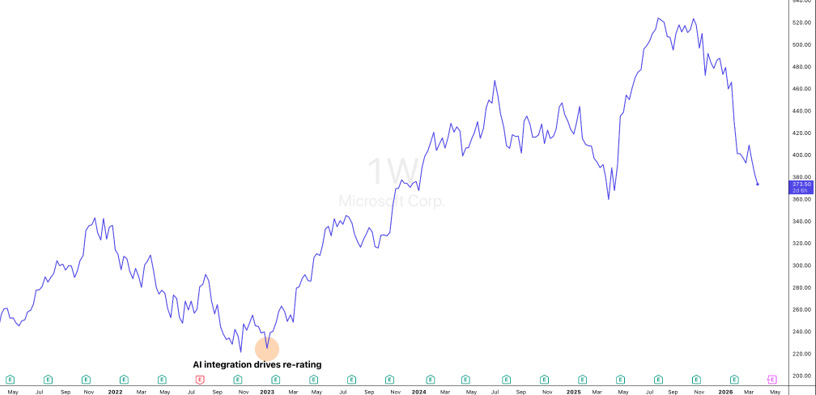
Microsoft (MSFT) long-term weekly price chart

Company Overview

Microsoft is a diversified technology company operating across productivity software, cloud infrastructure, enterprise applications, and consumer computing platforms. Its business model combines recurring subscription revenue with infrastructure services and integrated enterprise solutions.
The company’s geographic exposure is broad, serving enterprise and consumer clients across multiple regions. Revenue is generated through cloud services, software licensing, subscription-based productivity tools, gaming platforms, and related technology offerings.
Core revenue drivers include enterprise cloud adoption, software ecosystem integration, and expansion of AI-enabled services embedded within productivity and infrastructure platforms.

Industry & Sector Context

Microsoft operates within the global enterprise software and cloud computing sector, an industry shaped by digital transformation initiatives, AI integration, cybersecurity priorities, and corporate IT modernization.
Competitive positioning depends on ecosystem integration, developer engagement, cloud scalability, and enterprise relationships. The cloud sector remains influenced by capital expenditure discipline among hyperscale providers and enterprise budget allocation cycles.
Microsoft’s scale and platform breadth position it as a diversified participant across infrastructure, applications, and enterprise services, linking it closely to broader digitization trends.

Key Factors to Monitor

Quarterly earnings provide insight into cloud growth rates, enterprise spending trends, and adoption of AI-enhanced services. Guidance related to capital expenditure and infrastructure buildout can also indicate forward demand expectations.
Regulatory scrutiny in various jurisdictions may influence operational flexibility and compliance costs, particularly given the scale of the company’s ecosystem.
Innovation pipelines, including AI integration across software platforms, remain relevant for maintaining competitive differentiation.
Macroeconomic sensitivity is primarily linked to enterprise IT budgets and corporate investment cycles, which may fluctuate depending on economic conditions.

Risk Considerations

Sector risks include competitive pressure in cloud infrastructure, pricing dynamics, and cybersecurity threats that could affect operational stability.
Company-specific challenges involve maintaining innovation momentum across diverse segments while managing regulatory oversight and integration complexity.
Broader market risks include interest rate sensitivity affecting growth-oriented valuations and shifts in corporate spending patterns during economic slowdowns.

Why This Stock Is on the Watchlist

Microsoft’s inclusion reflects its position at the intersection of enterprise software, cloud infrastructure, and AI integration. Its diversified business model and global scale make it relevant to multiple structural themes shaping equity markets in 2026.
03

ASML Holding (ASML)

Semiconductor Equipment & Advanced Lithography
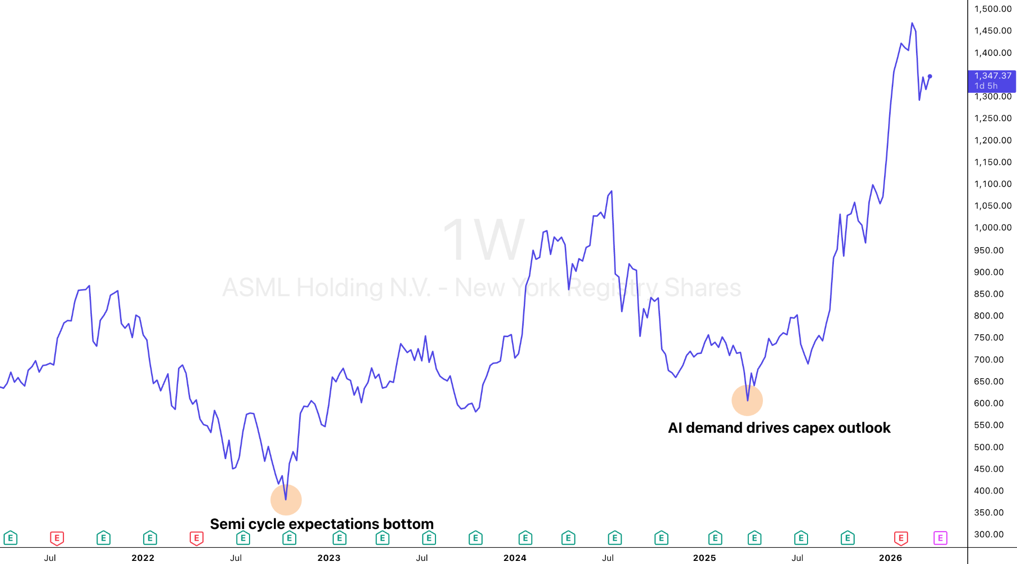
ASML Holding (ASML) long-term weekly price chart

Company Overview

ASML is a Netherlands-based semiconductor equipment manufacturer specializing in advanced lithography systems used in chip fabrication. Its extreme ultraviolet (EUV) technology enables leading-edge semiconductor manufacturing processes.
The company’s geographic exposure is global, serving major semiconductor foundries and integrated device manufacturers. Revenue is driven by equipment sales, service contracts, and long-term technological partnerships with leading chip producers.
Core revenue drivers depend on capital expenditure cycles within the semiconductor manufacturing industry and adoption of increasingly advanced process nodes.

Industry & Sector Context

ASML operates within the semiconductor equipment sector, a critical segment of the broader semiconductor supply chain. The industry is characterized by high capital intensity, long development cycles, and significant technological barriers to entry.
Sector trends are influenced by AI-driven demand, automotive digitization, industrial automation, and consumer electronics cycles. Node transitions to more advanced manufacturing processes require precise lithography capabilities, positioning ASML within a structurally important niche.
Competitive positioning is shaped by technological specialization and the limited availability of alternative advanced lithography systems.

Key Factors to Monitor

Earnings reports provide insight into order intake, backlog visibility, and customer capital expenditure plans. Foundry investment cycles often influence equipment demand with some lag.
Regulatory developments, particularly export controls affecting advanced technology, may influence geographic sales distribution.
Innovation and next-generation lithography development remain central to long-term positioning, as chip complexity increases.
Macroeconomic sensitivity is indirectly linked to semiconductor demand cycles and global technology investment trends.

Risk Considerations

Sector-specific risks include cyclical downturns in semiconductor manufacturing and potential capital expenditure reductions following periods of rapid expansion.
Company-specific risks include customer concentration among a limited number of large foundries and geopolitical sensitivity affecting export permissions.
Broader market risks include fluctuations in global technology demand and shifts in policy affecting cross-border semiconductor trade.

Why This Stock Is on the Watchlist

ASML is included due to its strategic role in enabling advanced semiconductor manufacturing. The company serves as a critical link in the AI and technology infrastructure ecosystem and reflects long-term capital investment trends.
04

Taiwan Semiconductor Manufacturing Company (TSM)

Advanced Semiconductor Manufacturing
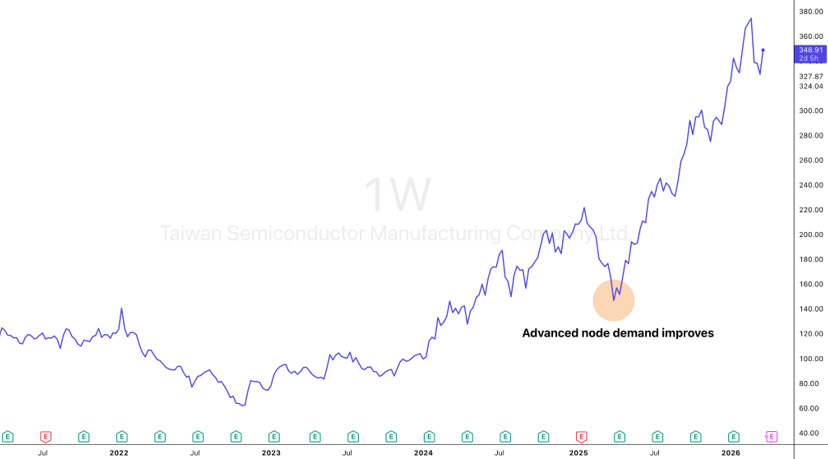
Taiwan Semiconductor Manufacturing Company (TSM) long-term weekly price chart

Company Overview

TSMC is one of the world’s leading semiconductor foundries, manufacturing chips designed by global technology firms across consumer, enterprise, and industrial applications. Unlike integrated device manufacturers, TSMC focuses exclusively on fabrication, allowing for scale and specialization in advanced process technologies.
The company’s geographic exposure includes global customers, although manufacturing capacity is regionally concentrated. Revenue is driven by demand for advanced nodes, long-term production commitments from major chip designers, and capacity utilization rates.
Core revenue drivers are closely tied to technology adoption cycles and demand from sectors including AI infrastructure, consumer electronics, automotive systems, and industrial automation.

Industry & Sector Context

TSMC operates at the center of the semiconductor manufacturing ecosystem. Sector trends are shaped by increasing chip complexity, AI workload expansion, and global digital transformation.
Competitive positioning depends on process node leadership, manufacturing yield, and technological reliability. The semiconductor foundry sector is capital-intensive and influenced by geopolitical considerations due to its strategic importance.
Market relevance is significant, as TSMC’s capacity decisions and technological transitions often signal broader semiconductor demand trends.

Key Factors to Monitor

Quarterly earnings and capital expenditure guidance provide insight into demand visibility and node transition timelines.
Regulatory and geopolitical developments may affect cross-border supply chains and customer relationships.
Innovation pipelines include process node advancements and production scaling efficiency.
Macroeconomic sensitivity arises from cyclical fluctuations in electronics demand and enterprise infrastructure investment.

Risk Considerations

Sector risks include cyclical oversupply, rapid technological transitions, and high capital expenditure requirements.
Company-specific challenges include geographic concentration of manufacturing and customer reliance among major chip designers.
Broader market risks involve geopolitical tensions, currency fluctuations, and shifts in global demand for advanced technology products.

Why This Stock Is on the Watchlist

TSMC is included due to its foundational role in global semiconductor manufacturing and its exposure to structural themes related to AI, digital infrastructure, and advanced electronics production.
05

Broadcom (AVGO)

Semiconductors & Infrastructure Software
Broadcom (AVGO) long-term weekly price chart

Company Overview

Broadcom is a diversified technology company operating across semiconductor solutions and infrastructure software. Its semiconductor segment serves data center networking, broadband, wireless connectivity, and custom silicon applications, while its infrastructure software segment provides enterprise-grade solutions focused on system management, cybersecurity, and virtualization.
The company’s geographic exposure is global, serving large enterprise clients, hyperscale cloud providers, telecommunications firms, and industrial customers. Revenue drivers include demand for networking components in AI-enabled data centers, broadband connectivity upgrades, and enterprise software subscription renewals.
Broadcom’s hybrid structure, combining hardware and software exposure, differentiates it from more narrowly focused semiconductor peers.

Industry & Sector Context

Broadcom operates within both the semiconductor and enterprise infrastructure software sectors. Semiconductor demand in 2026 remains influenced by AI infrastructure scaling, networking bandwidth expansion, and connectivity requirements across cloud and telecom systems.
On the software side, enterprise digitization and system modernization continue to shape demand. Competitive positioning depends on integration capabilities, long-term enterprise relationships, and product reliability within mission-critical environments.
Broadcom’s market relevance stems from its exposure to data center networking, custom silicon partnerships, and enterprise infrastructure modernization.

Key Factors to Monitor

Quarterly earnings provide visibility into semiconductor demand cycles and enterprise software growth trends. Particular attention may be paid to commentary regarding AI-related networking demand and customer concentration.
Regulatory considerations, including antitrust oversight and cross-border trade policies, may influence strategic decisions.
Innovation pipelines, including custom silicon solutions and integrated infrastructure offerings, remain important to maintaining differentiation.
Macroeconomic sensitivity arises from enterprise IT spending cycles and capital expenditure patterns in telecommunications and cloud infrastructure.

Risk Considerations

Sector risks include semiconductor cyclicality and rapid shifts in networking architecture. Enterprise software markets may face pricing pressure and competitive displacement.
Company-specific challenges include integration risk following acquisitions and maintaining balanced growth across hardware and software segments.
Broader market risks involve valuation sensitivity to interest rates and global economic slowdowns affecting enterprise investment.

Why This Stock Is on the Watchlist

Broadcom is included due to its exposure to AI-related infrastructure expansion and enterprise system modernization. Its dual presence in hardware and software provides insight into both semiconductor demand and corporate IT investment trends.
06

Siemens Energy (ENR)

Energy Transition & Industrial Infrastructure
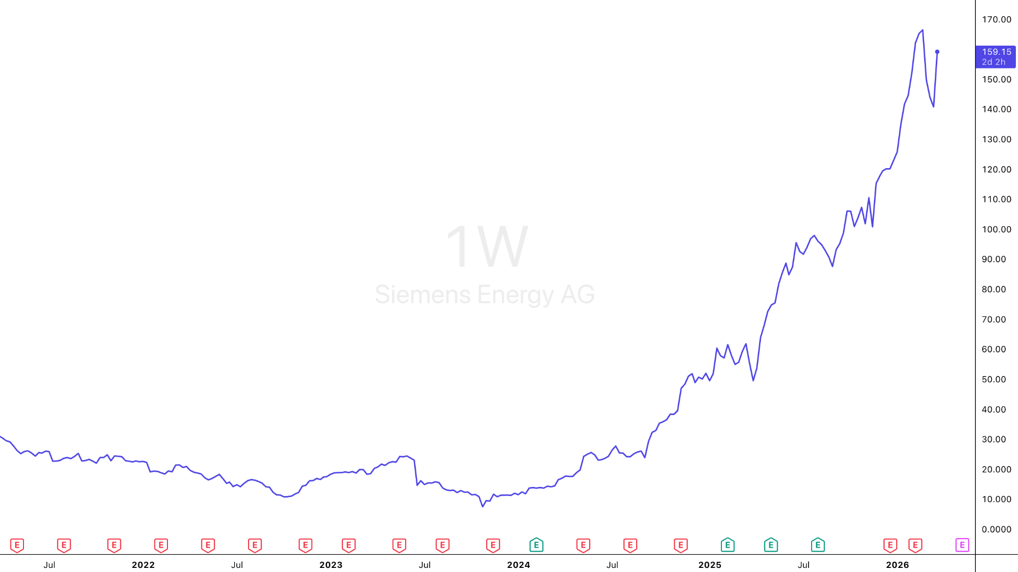
Siemens Energy (ENR) long-term weekly price chart

Company Overview

Siemens Energy operates in power generation, grid technologies, and energy infrastructure services. The company provides equipment and solutions supporting electricity transmission, distribution, and generation across global markets.
Geographic exposure spans Europe, North America, and emerging markets. Revenue drivers include grid modernization projects, gas turbine demand, renewable integration, and long-term service agreements.
The company’s business model reflects capital-intensive, project-based revenue streams often influenced by policy frameworks and infrastructure investment cycles.

Industry & Sector Context

Energy systems are undergoing transformation, driven by electrification, renewable integration, and grid reliability initiatives. Infrastructure investment in transmission and distribution networks has gained prominence as energy demand patterns evolve.
Competitive positioning depends on technological capability, project execution discipline, and the ability to manage long-term contracts efficiently.
Siemens Energy’s market relevance is tied to global grid modernization and energy transition narratives, particularly in regions emphasizing infrastructure resilience.

Key Factors to Monitor

Earnings cycles often reflect order intake, backlog development, and margin performance on large projects. Policy incentives and regulatory frameworks may influence project approvals and funding availability.
Innovation in grid technologies and energy efficiency solutions contributes to competitive positioning.
Macroeconomic sensitivity relates to infrastructure financing conditions, industrial demand cycles, and energy price dynamics.

Risk Considerations

Sector risks include policy uncertainty, commodity cost fluctuations, and project execution complexity.
Company-specific challenges may involve margin volatility on large contracts and restructuring efforts within specific business units.
Broader market risks include economic slowdowns that delay infrastructure investment and shifts in regulatory priorities.

Why This Stock Is on the Watchlist

Siemens Energy is included due to its exposure to energy infrastructure modernization and long-term electrification trends. The company provides insight into capital investment cycles within the power sector.
07

Eli Lilly (LLY)

Healthcare & Biopharma Innovation
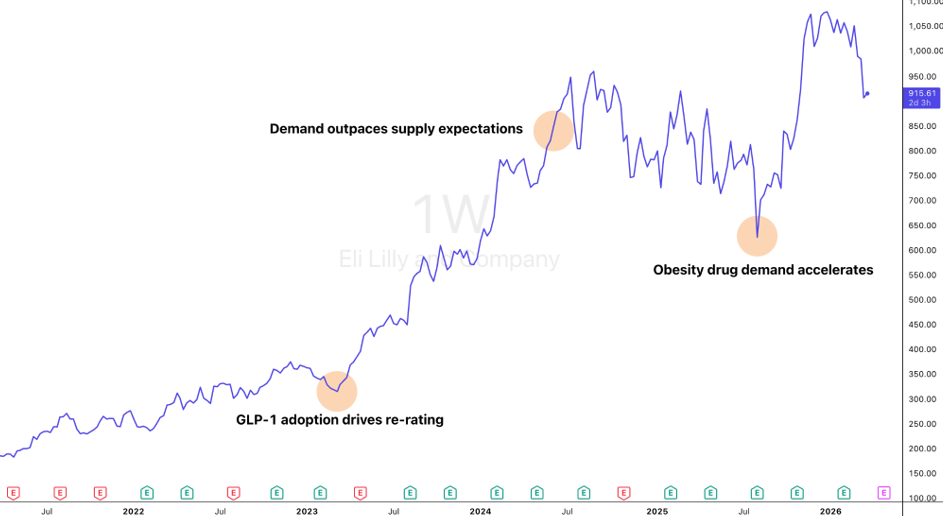
Eli Lilly (LLY) long-term weekly price chart

Company Overview

Eli Lilly is a global pharmaceutical company focused on developing and commercializing treatments across metabolic health, oncology, immunology, and neuroscience.
The company generates revenue through patented therapies, with geographic exposure primarily in North America and other developed markets. Core revenue drivers include demand for metabolic and obesity-related therapies, pipeline advancements, and lifecycle management of existing treatments.

Industry & Sector Context

The pharmaceutical industry is shaped by innovation cycles, clinical trial outcomes, regulatory approvals, and pricing frameworks. In recent years, metabolic health treatments have received heightened investor attention due to expanding patient populations and clinical advancements.
Competitive positioning depends on pipeline depth, intellectual property protection, manufacturing scalability, and regulatory compliance.
Eli Lilly’s relevance is closely tied to developments in chronic disease treatment and broader healthcare innovation themes.

Key Factors to Monitor

Earnings reports provide insight into product demand trends, pipeline progress, and forward guidance.
Regulatory developments, including pricing policy and approval timelines, may influence revenue visibility.
Innovation pipelines and clinical trial outcomes remain central to long-term positioning.
Macroeconomic sensitivity is generally less cyclical than industrial sectors but may reflect healthcare spending frameworks and policy changes.

Risk Considerations

Sector-specific risks include clinical trial failures, patent expirations, and pricing scrutiny.
Company-specific challenges may involve manufacturing scale-up, competitive pipeline developments, and reimbursement negotiations.
Broader market risks include healthcare policy reform and shifts in investor sentiment toward growth-oriented healthcare equities.

Why This Stock Is on the Watchlist

Eli Lilly is included due to its exposure to high-profile therapeutic categories and its role within global healthcare innovation trends.
08

Novo Nordisk (NVO)

Healthcare & Metabolic Therapies
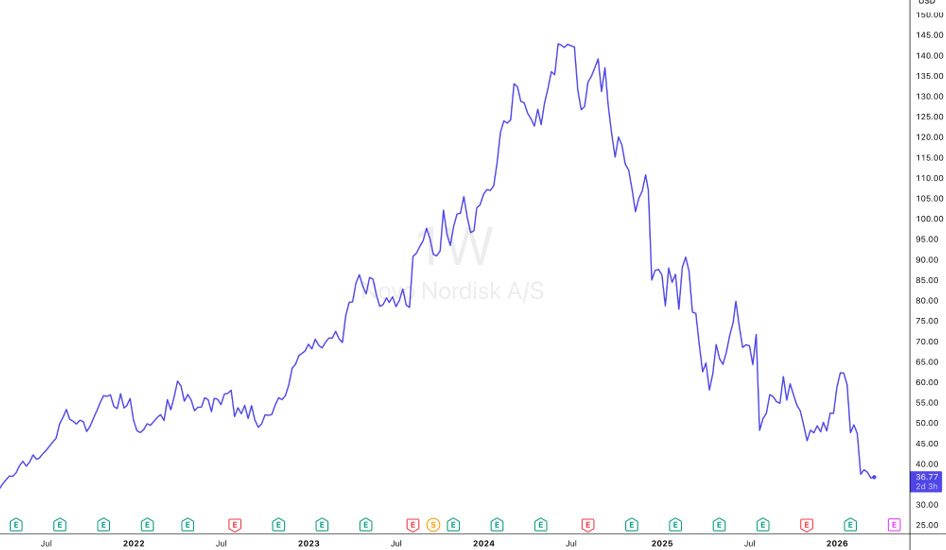
Novo Nordisk (NVO) long-term weekly price chart

Company Overview

Novo Nordisk is a pharmaceutical company specializing in diabetes and metabolic disease treatments. The company operates globally, with significant exposure to developed healthcare markets.
Revenue drivers are linked to therapeutic demand in chronic disease management and ongoing product development within metabolic health.

Industry & Sector Context

The metabolic health segment remains a focal point within the pharmaceutical industry, shaped by clinical innovation, competitive pipelines, and reimbursement frameworks.
Competitive positioning depends on therapeutic efficacy, supply reliability, and regulatory compliance.
Novo Nordisk’s relevance stems from its leadership position in diabetes and obesity treatment categories.

Key Factors to Monitor

Quarterly earnings provide updates on product demand and geographic sales distribution.
Regulatory and pricing frameworks may influence market access and reimbursement.
Pipeline advancements and manufacturing scalability remain important considerations.
Macroeconomic sensitivity is generally indirect but may reflect healthcare policy shifts.

Risk Considerations

Sector risks include regulatory intervention, competitive therapeutic development, and pricing pressure.
Company-specific risks may involve supply constraints and clinical trial uncertainty.
Broader market risks include valuation sensitivity to growth expectations and policy changes.

Why This Stock Is on the Watchlist

Novo Nordisk is included due to its central role in metabolic healthcare innovation and its exposure to structural healthcare demand.
09

Visa (V)

Financial Infrastructure & Payments
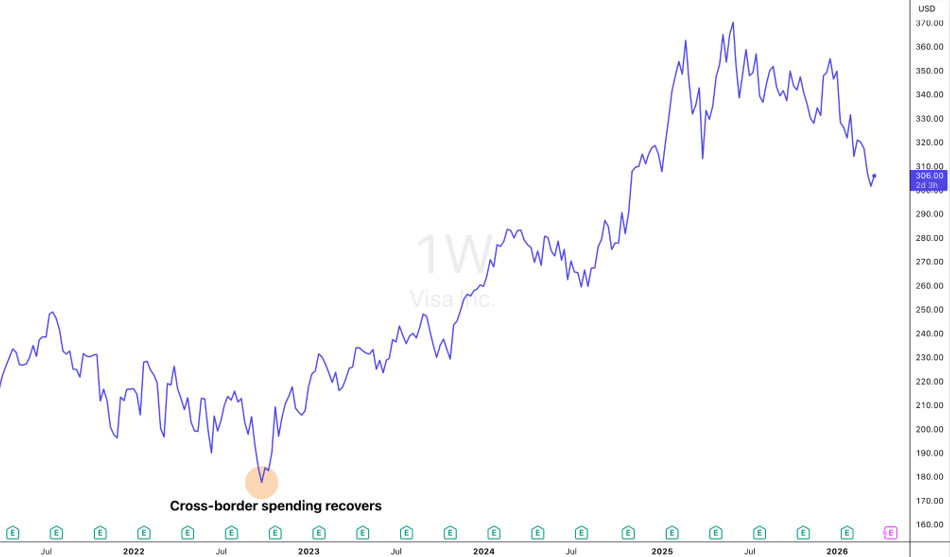
Visa (V) long-term weekly price chart

Company Overview

Visa operates a global payments network enabling digital transactions between consumers, businesses, and financial institutions. The company generates revenue through transaction processing, cross-border fees, and value-added services.
Geographic exposure is broad, reflecting global consumer and commercial payment activity.

Industry & Sector Context

The digital payments sector is influenced by consumer spending patterns, e-commerce adoption, cross-border travel activity, and regulatory oversight of interchange frameworks.
Competitive positioning depends on network scale, security infrastructure, and global acceptance.
Visa’s relevance is linked to its role as a barometer of global transaction activity.

Key Factors to Monitor

Earnings cycles provide insight into payment volume growth and cross-border trends.
Regulatory scrutiny of fees and network practices may affect margins.
Innovation in digital payments and fraud prevention remains strategically relevant.
Macroeconomic sensitivity is tied to consumer spending levels and travel activity.

Risk Considerations

Sector risks include regulatory intervention and competition from alternative payment systems.
Company-specific challenges may involve cybersecurity threats and evolving digital payment ecosystems.
Broader market risks include economic downturns affecting transaction volumes.

Why This Stock Is on the Watchlist

Visa is included due to its exposure to global consumption trends and digital payment infrastructure.
10

Mastercard (MA)

Financial Infrastructure & Payments
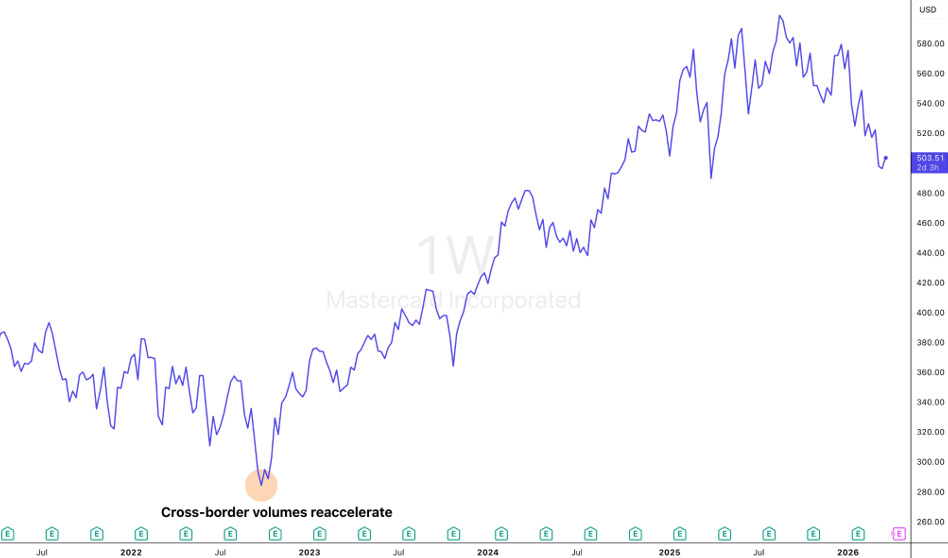
Mastercard (MA) long-term weekly price chart

Company Overview

Mastercard operates a global payments network similar in structure to Visa, generating revenue from transaction processing and cross-border fees.
Its global footprint reflects diversified exposure to consumer and business transaction activity.

Industry & Sector Context

The payments sector continues to evolve alongside digital commerce expansion and financial technology innovation.
Competitive positioning depends on network scale, data analytics integration, and cross-border reach.

Key Factors to Monitor

Earnings updates provide visibility into transaction growth and geographic exposure.
Regulatory frameworks and competitive developments influence fee structures.
Innovation in value-added services contributes to revenue diversification.
Macroeconomic sensitivity is linked to consumer spending cycles and travel demand.

Risk Considerations

Sector risks include regulatory pressure and technological disruption.
Company-specific challenges involve maintaining network security and competitive differentiation.
Broader risks include economic slowdowns impacting payment volumes.

Why This Stock Is on the Watchlist

Mastercard is included due to its systemic importance within global financial infrastructure.
11

BlackRock (BLK)

Asset Management & Capital Markets
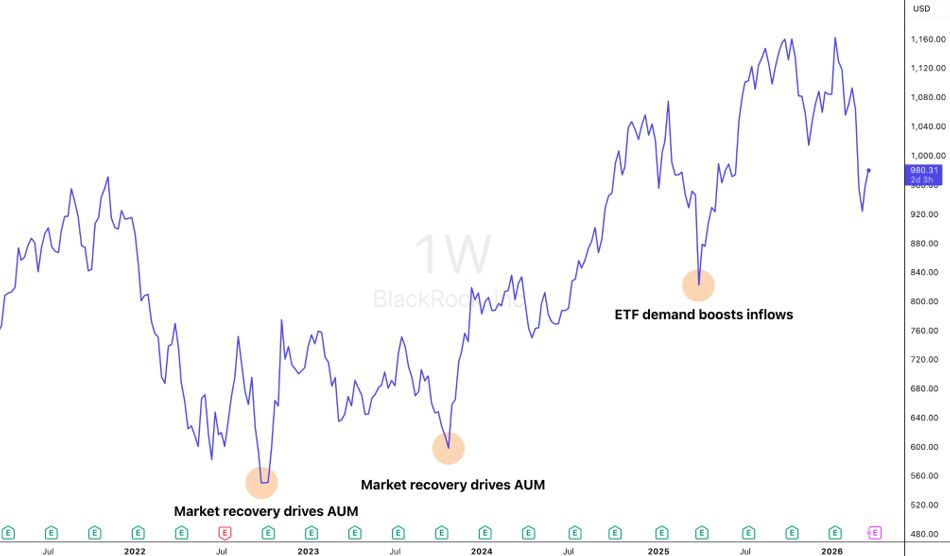
BlackRock (BLK) long-term weekly price chart

Company Overview

BlackRock is a global asset manager offering exchange-traded funds, active investment strategies, and risk management solutions. Revenue is primarily driven by assets under management and fee-based services.

Industry & Sector Context

Asset management firms reflect capital flows, investor sentiment, and allocation shifts across asset classes.
Competitive positioning depends on scale, product diversity, and distribution channels.

Key Factors to Monitor

Earnings reports provide updates on inflows, outflows, and product mix.
Regulatory frameworks influence disclosure and fiduciary standards.
Market conditions affect asset values and fee revenue.

Risk Considerations

Sector risks include fee compression and market volatility.
Company-specific challenges involve maintaining growth amid competitive pressure.
Broader market risks include equity market downturns reducing AUM.

Why This Stock Is on the Watchlist

BlackRock is included due to its scale and role as a proxy for global investment flows.
12

Costco Wholesale (COST)

Consumer & Retail
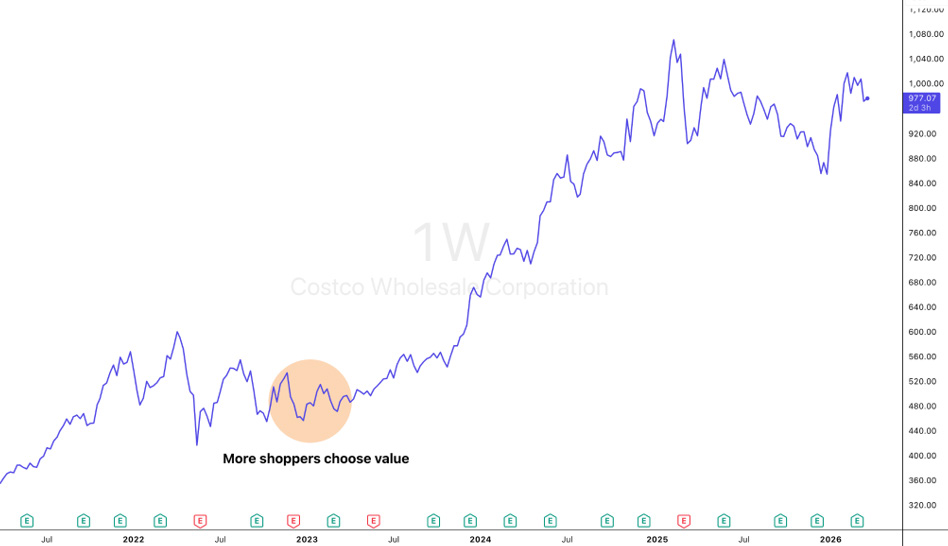
Costco Wholesale (COST) long-term weekly price chart

Company Overview

Costco operates a membership-based retail model offering consumer goods across multiple categories. Revenue is driven by merchandise sales and recurring membership fees.

Industry & Sector Context

Retail performance is influenced by consumer spending behavior, pricing power, and supply chain efficiency.
Competitive positioning depends on scale, operational discipline, and membership loyalty.

Key Factors to Monitor

Earnings updates provide insight into comparable sales and renewal rates.
Macroeconomic conditions affect consumer purchasing patterns.
Operational efficiency influences margin stability.

Risk Considerations

Sector risks include consumer demand volatility and cost pressures.
Company-specific challenges may involve inventory management and pricing competition.
Broader market risks include economic downturns affecting discretionary spending.

Why This Stock Is on the Watchlist

Costco is included due to its role as a consumer resilience indicator and its distinctive membership-driven business model.
05

Comparing Stocks Across Sectors

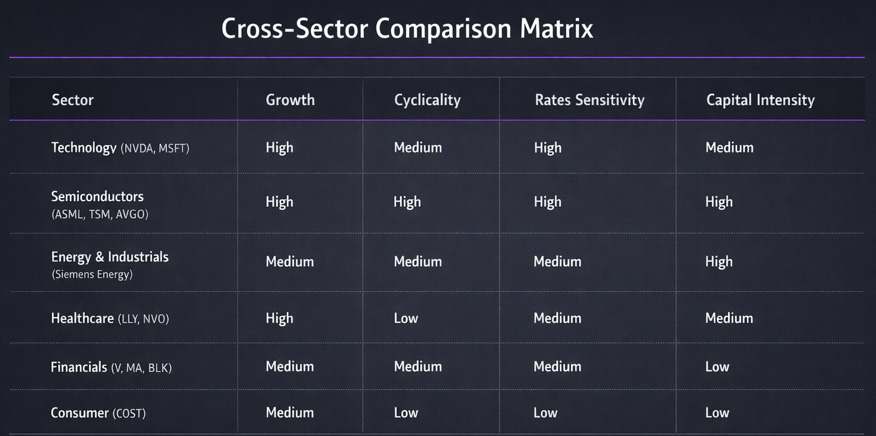
Analyzing companies in isolation can limit perspective. Cross-sector comparison provides additional insight by highlighting differences in business models, economic sensitivity, regulatory exposure, and capital intensity. The twelve companies in this report operate across technology infrastructure, semiconductor manufacturing, energy systems, healthcare innovation, financial infrastructure, and consumer retail. Each sector responds differently to macroeconomic conditions and structural trends.
Understanding these distinctions supports more structured monitoring throughout 2026.
Cross-sector comparison matrix rating each sector on growth, cyclicality, rates sensitivity and capital intensity

Technology vs. Industrials vs. Healthcare

Technology-oriented companies such as NVIDIA, Microsoft, ASML, TSMC, and Broadcom are generally influenced by capital expenditure cycles, innovation velocity, and competitive differentiation. Their performance often reflects enterprise spending patterns, cloud infrastructure investment, and product development cycles. These firms may exhibit higher sensitivity to changes in interest rates and investor expectations, particularly when valuation levels incorporate long-term growth assumptions.
Industrial and energy infrastructure companies, such as Siemens Energy, tend to operate within longer project cycles. Their revenue streams are often linked to multi-year contracts, infrastructure investment programs, and policy frameworks supporting grid modernization or electrification. Compared to high-growth technology firms, industrial companies may display different timing dynamics, as revenue recognition can depend on project milestones and execution schedules.
Healthcare companies such as Eli Lilly and Novo Nordisk operate within a distinct framework. Their performance is often driven by clinical progress, regulatory approvals, patent protection, and reimbursement policies. Unlike cyclical industrial sectors, healthcare demand is frequently less sensitive to short-term economic fluctuations. However, regulatory scrutiny and pricing frameworks introduce a different layer of risk that is largely policy-driven rather than macroeconomic.
Comparing these sectors highlights the importance of contextual interpretation. Strong performance in one industry does not necessarily imply similar conditions across others. Sector dynamics are often shaped by distinct drivers.

Defensive vs. Growth-Oriented Business Models

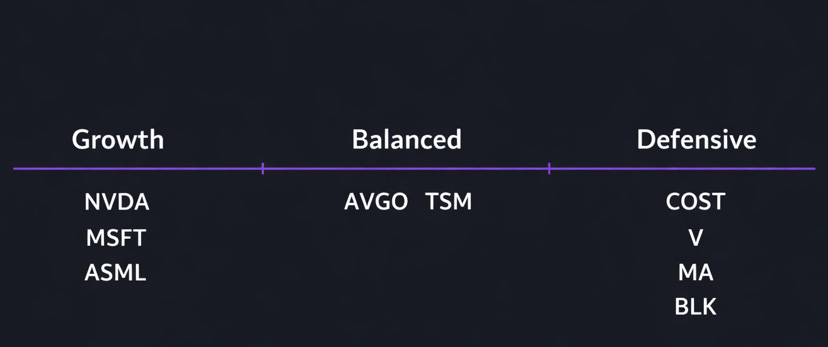
Within the watchlist, certain companies are frequently categorized as growth-oriented, while others are perceived as more defensive. Growth-oriented companies are typically those whose valuation reflects expectations of sustained expansion in earnings, innovation, or market share. Many technology infrastructure and semiconductor firms fall within this category due to their exposure to AI, digitization, and structural transformation themes.
Growth vs Defensive Spectrum Spectrum positioning the twelve stocks from growth (NVDA, MSFT, ASML) through balanced (AVGO, TSM) to defensive (COST, V, MA, BLK)
Defensive-leaning businesses often include consumer staples retailers, payment networks, or asset managers with diversified revenue streams. Companies such as Costco, Visa, Mastercard, and BlackRock may be viewed as more closely tied to broad economic activity rather than technological disruption. However, even these companies can exhibit sensitivity to macroeconomic cycles, particularly during periods of consumer spending shifts or financial market volatility.
The distinction between growth and defensive classifications is not fixed. Market conditions can alter how investors perceive risk and stability. For example, in environments characterized by strong economic expansion and supportive liquidity, growth-oriented sectors may attract greater attention. In contrast, periods of uncertainty may shift focus toward companies perceived as resilient or cash-flow stable.
Recognizing how market participants frame these categories can assist in understanding sector rotation patterns without implying directional expectations.

Capital Intensity and Investment Cycles

Another key comparison involves capital intensity. Semiconductor manufacturing and energy infrastructure companies typically require substantial upfront investment. ASML and TSMC operate within highly capital-intensive environments where equipment upgrades and fabrication capacity expansions involve long planning horizons and significant expenditure.
Energy infrastructure projects often depend on financing conditions and regulatory approvals, creating extended project timelines and execution complexity. These dynamics differ from software-driven businesses such as Microsoft, where incremental scalability may require comparatively less physical capital investment.
Capital intensity can influence financial flexibility, margin stability, and sensitivity to interest rate changes. Companies operating in capital-heavy industries may face different risk profiles compared to asset-light software or services businesses.

Regulatory Exposure Across Sectors

Regulatory environments vary significantly by industry. Healthcare companies face oversight related to drug approvals, safety standards, and pricing frameworks. Payment networks operate under financial regulatory scrutiny, particularly concerning interchange fees and competitive practices. Semiconductor firms may be influenced by export controls and trade policy developments.
Energy infrastructure providers often operate within policy-driven environments where incentives, environmental regulations, and national energy strategies shape demand.
Understanding the regulatory dimension across sectors can provide insight into non-market risks that may influence performance independently of earnings momentum.

Geographic Exposure and Global Sensitivity

The companies included in this report also differ in geographic exposure. Semiconductor manufacturers and equipment suppliers operate within globally interconnected supply chains, with sensitivity to geopolitical developments and trade relationships.
Healthcare companies often derive substantial revenue from developed markets with established reimbursement systems, although global expansion strategies may influence growth visibility.
Payment networks and asset managers typically have diversified international footprints, making them sensitive to global consumption trends and capital flows. Retailers such as Costco may be more concentrated in specific regions while still reflecting broader economic conditions.
Geographic diversification can provide resilience but also introduces exposure to currency movements, regulatory divergence, and region-specific economic cycles.

Market Relevance and Investor Attention

Certain companies in this report command high levels of institutional attention due to their role within structural themes. AI infrastructure providers and semiconductor manufacturers are often closely followed as indicators of technology investment cycles. Healthcare innovators attract attention due to clinical developments and demographic trends. Financial infrastructure companies are observed as barometers of consumption and capital allocation activity.
High investor attention can amplify volatility around earnings events or policy announcements. It can also increase sensitivity to narrative shifts, as expectations may adjust rapidly in response to new information.
Comparing levels of investor focus across sectors can provide context when interpreting price movements.

Interconnected Dynamics Across the Watchlist

While these companies operate across different industries, their underlying drivers are often interconnected. AI infrastructure growth influences semiconductor demand. Semiconductor manufacturing capacity affects cloud deployment timelines. Consumer spending influences payment volumes and retail performance. Interest rate changes affect valuation multiples across growth and defensive sectors alike.
This interconnectedness reinforces the importance of cross-sector comparison rather than isolated analysis. Observing developments across industries can offer more comprehensive insight into broader market conditions.

The Value of Structured Comparison

Cross-sector comparison does not imply ranking industries or predicting performance. Instead, it supports disciplined monitoring. By recognizing differences in capital intensity, regulatory exposure, macroeconomic sensitivity, and structural positioning, market participants can interpret developments more objectively.
The next chapter focuses on how equity watchlists can be used responsibly within a structured analytical framework.
06

Using Equity Watchlists Responsibly

A watchlist is a monitoring tool, not a trading signal. Its purpose is to organize attention, not to dictate action. In volatile market environments, structure can help reduce emotional responses and improve clarity when interpreting new information.
The twelve companies included in this report were selected because they represent key sectors and structural themes shaping global equity markets in 2026. Their inclusion does not imply expected outperformance or underperformance. Instead, it reflects their relevance within broader economic and industry frameworks.
Understanding how to use a watchlist responsibly is as important as selecting the companies themselves.

Watchlists Are Not Predictions

A common misconception is that companies included in a report titled “Stocks in Focus” are expected to move in a specific direction. In reality, a watchlist identifies companies worth observing due to their market relevance, liquidity, or exposure to structural themes.
Price movements are influenced by expectations, positioning, macroeconomic shifts, and unforeseen developments. Even well-analyzed companies can experience volatility that diverges from narrative assumptions.
A disciplined approach recognizes that monitoring does not equal forecasting. The purpose of a watchlist is to create preparedness rather than certainty.

Combining Analysis with Risk Awareness

Responsible market engagement requires more than thematic understanding. It also requires risk awareness.
When following equities, risk can arise from multiple sources. Company-specific developments such as earnings surprises, product delays, regulatory changes, or competitive shifts can alter outlooks quickly. Sector-wide dynamics, including pricing pressure or policy reform, may influence multiple companies simultaneously. Broader macroeconomic variables, such as interest rate shifts or geopolitical developments, can affect valuation levels across industries.
Risk management practices, whether through position sizing, diversification, or defined monitoring frameworks, help prevent isolated events from disproportionately influencing outcomes. Even for those not actively trading, understanding the potential variability of outcomes improves interpretive discipline.

Interpreting Earnings Objectively

Quarterly earnings announcements often generate heightened attention. However, price reactions frequently reflect changes in expectations rather than absolute performance.
For example, a company reporting strong revenue growth may still experience volatility if forward guidance is adjusted. Conversely, moderate results may be well received if prior expectations were conservative.
Responsible monitoring involves distinguishing between operational performance and market reaction. Reviewing reported figures, guidance commentary, and management outlook in context helps maintain objectivity.
Maintaining written notes before and after earnings events can support disciplined evaluation, particularly when expectations were clearly defined in advance.

Monitoring Themes Without Narrative Bias

Structural themes, such as AI expansion or healthcare innovation, can become dominant narratives in financial markets. While such themes may represent real economic transformation, they can also lead to overgeneralization.
A responsible watchlist approach separates structural relevance from short-term momentum. A company’s inclusion due to thematic exposure does not guarantee consistent performance. Capital expenditure cycles, competitive dynamics, and regulatory frameworks can alter trajectory over time.
Maintaining neutrality toward themes helps reduce confirmation bias. Markets evolve, and themes may strengthen, stabilize, or fade depending on economic conditions and policy developments.

Updating Views When Conditions Change

An effective watchlist is dynamic rather than static. Companies may evolve strategically, adjust capital allocation priorities, enter new markets, or face unexpected challenges. Structural themes may shift in importance. Regulatory environments may change.
Revisiting assumptions periodically helps maintain analytical relevance. This does not require constant revision, but rather thoughtful reassessment when material developments occur.
A disciplined process might include reviewing company positioning after major earnings cycles, regulatory updates, or significant macroeconomic shifts.

Avoiding Overreaction to Short-Term Volatility

Financial markets frequently exhibit short-term volatility driven by sentiment, positioning adjustments, or macro headlines. While volatility can create opportunity, it can also distort perspective.
Short-term price movements do not necessarily reflect changes in long-term business fundamentals. Separating noise from structural shifts requires patience and context.
Structured monitoring, supported by thematic understanding and cross-sector comparison, can reduce impulsive reactions to temporary price fluctuations.

The Role of Tools and Data

Using objective tools can enhance watchlist discipline. Price charts, earnings calendars, macroeconomic release schedules, and sentiment indicators can provide structure. However, tools should support analysis rather than replace it.
No single indicator provides certainty. Combining qualitative understanding with quantitative observation can strengthen interpretation without encouraging overconfidence.

Maintaining a Long-Term Learning Mindset

Financial markets are adaptive systems. Technologies evolve, industries transform, regulatory frameworks adjust, and consumer behavior shifts. A watchlist should therefore function as an educational resource as much as a monitoring tool.
By observing how companies respond to evolving conditions, market participants can deepen their understanding of sector dynamics and macroeconomic linkages. This process-oriented approach emphasizes learning over prediction.
The next chapter outlines practical tools and methods for monitoring equities within this structured framework.
07

Tools for Monitoring Stocks

Monitoring equities effectively requires structure, consistency, and access to reliable information. While no single tool provides certainty, combining multiple sources of data can support a more informed and disciplined analytical process.
This chapter outlines commonly used monitoring tools in a neutral and educational context. The purpose is not to provide trading strategies, but to explain how market participants can observe developments systematically.

Price Charts and Timeframes

Price charts remain one of the most widely used monitoring tools in financial markets. They provide a visual representation of how a stock’s price has evolved over time and can offer context for volatility, trend development, and market reaction to events.
Different timeframes serve different analytical purposes. Longer-term charts may help illustrate structural trends, multi-year performance patterns, and cyclical turning points. Medium-term timeframes often provide context around earnings cycles and sector rotations. Shorter-term charts can reflect immediate reactions to news events, earnings announcements, or macroeconomic developments.
Importantly, charts do not predict outcomes. They provide historical context. Observing how a stock behaves around prior earnings releases or macro events can help market participants frame expectations more objectively in future cycles.

Volatility and Trading Volume

Volatility measures the degree to which a stock’s price fluctuates over time. Elevated volatility can signal uncertainty, heightened investor attention, or significant changes in expectations. Lower volatility may indicate relative stability or reduced trading activity.
Volume data reflects the number of shares traded during a given period. Spikes in trading volume often coincide with earnings releases, regulatory announcements, or broader market developments. Observing volume alongside price movement can provide additional context regarding the intensity of market participation.
However, volatility and volume should be interpreted cautiously. Increased activity does not inherently signal directional conviction. It may simply reflect repositioning among market participants.

Earnings Calendars and Corporate Communications

Corporate earnings announcements are among the most influential recurring events in equity markets. Maintaining awareness of earnings dates allows for structured preparation rather than reactive interpretation.
Beyond headline revenue and earnings figures, management commentary, forward guidance, and capital expenditure plans often provide insight into broader industry conditions. Reviewing transcripts or official company communications can improve contextual understanding.
Monitoring investor presentations and regulatory filings may also provide updates regarding strategic priorities, research pipelines, or capital allocation decisions.

Macroeconomic Indicators

Equities do not operate independently from macroeconomic conditions. Inflation data, interest rate decisions, employment figures, and economic growth estimates can influence investor sentiment and valuation frameworks.
For companies operating globally, currency fluctuations and regional economic data may be particularly relevant. For example, consumer spending data may influence retail and payment companies, while capital expenditure surveys may affect technology and industrial firms.
Tracking macroeconomic releases alongside sector-specific developments can provide more comprehensive context.

Sector and Industry Reports

Industry research publications, policy updates, and sector-specific data can help contextualize company performance within broader competitive landscapes.
Semiconductor shipment data, healthcare regulatory updates, energy infrastructure investment reports, and consumer spending surveys are examples of information that may enhance sector-level understanding.
Such reports should be viewed as informational inputs rather than predictive tools. They can help identify trends but should be integrated carefully within a broader analytical framework.

Market Sentiment and Positioning Indicators

Market sentiment indicators attempt to measure investor behavior, risk appetite, or positioning levels. These may include surveys, volatility indices, or fund flow data.
Sentiment measures can provide insight into whether markets appear broadly optimistic, cautious, or defensive. However, sentiment can shift rapidly and may not always align with fundamental developments.
Using sentiment as contextual information rather than directional guidance can reduce the risk of overinterpretation.

Cross-Asset Observation

Monitoring related asset classes can offer additional perspective. Movements in bond yields, commodity prices, or currency pairs may influence equity sector performance. For example, changes in interest rate expectations may affect growth-oriented technology companies differently than consumer-focused retailers.
Observing cross-asset relationships supports a broader understanding of market dynamics and reduces reliance on isolated price movements.

Documentation and Review

One of the most underutilized tools in equity monitoring is documentation. Maintaining structured notes before and after earnings releases, macro events, or sector developments can improve analytical consistency.
Writing down expectations in advance and comparing them with actual outcomes can help identify biases or recurring patterns in interpretation. Over time, this practice may enhance clarity and reduce reactive decision-making.

Maintaining Perspective

No monitoring tool eliminates uncertainty. Financial markets incorporate vast amounts of information, and outcomes remain influenced by evolving expectations and external variables.
Tools should support discipline rather than encourage overconfidence. A structured approach that integrates price data, corporate information, macro context, and sector research can help maintain perspective in changing market conditions.
The final chapter concludes this report by summarizing key themes and reinforcing the importance of ongoing education and adaptability in equity markets.
08

Final Thoughts: Staying Informed in Changing Markets

Financial markets are dynamic systems shaped by evolving expectations, shifting economic conditions, technological advancement, and regulatory change. Companies adapt, industries transform, and global priorities evolve over time. In this environment, maintaining perspective can be more valuable than attempting to predict short-term outcomes.
The purpose of this report has been to provide a structured framework for monitoring equities in 2026. By organizing analysis around global themes and sector comparisons, it becomes easier to interpret developments within a broader context rather than reacting to isolated events.

Markets Evolve — Watchlists Should Evolve Too

A watchlist is not a static document. Companies adjust strategy, launch new products, enter new markets, or face unexpected challenges. Structural themes may accelerate, stabilize, or shift direction depending on economic and policy developments.
Periodic reassessment supports analytical relevance. Reviewing company positioning after earnings cycles, regulatory updates, or macroeconomic shifts can help ensure that monitoring remains grounded in current conditions rather than outdated assumptions.
Adaptability is a key component of responsible market engagement.

Separating Noise from Structural Change

Short-term volatility is a defining characteristic of equity markets. Prices respond to earnings releases, macroeconomic data, geopolitical developments, and changes in investor sentiment. However, not all volatility reflects meaningful structural change.
Distinguishing between temporary market reactions and sustained business developments requires patience and context. Reviewing corporate fundamentals, competitive positioning, and sector trends alongside price movements can help reduce emotional responses.
Structured monitoring encourages discipline in environments where headlines may drive rapid shifts in sentiment.

Education Before Action

Information alone does not eliminate uncertainty. Markets reflect expectations, and expectations can change quickly. A consistent analytical framework, combined with ongoing education, can improve clarity over time.
Understanding how sectors differ in capital intensity, regulatory exposure, macroeconomic sensitivity, and innovation cycles enhances interpretive depth. Observing how companies respond to changing conditions builds experiential knowledge.
Education supports preparation. Preparation supports discipline.

The Importance of Perspective

The twelve companies included in this report represent diverse industries and structural themes shaping global markets in 2026. Each operates within a distinct competitive and regulatory landscape. Each faces sector-specific and broader market risks. None operates in isolation from macroeconomic conditions.
By comparing sectors, monitoring themes, and maintaining structured observation, market participants can approach equity analysis with greater balance.
Markets will continue to evolve. Technological innovation may accelerate. Policy frameworks may shift. Economic conditions may strengthen or weaken. No single report can anticipate every development. However, a disciplined framework can help maintain perspective as conditions change.

Continuing the Learning Process

Equity markets reward adaptability and informed observation. The goal of this report has not been to provide certainty, but to encourage thoughtful monitoring of globally relevant companies and sectors.
Staying informed, remaining objective, and revisiting assumptions when new information emerges can contribute to more consistent interpretation over time.
In changing markets, structure and perspective remain valuable tools.
Alchemy Markets is a global multi-asset brokerage providing access to currencies, equities, indices, commodities, and digital assets. The firm focuses on transparent execution, advanced trading tools, and institutional-grade trading conditions for retail and professional clients.
Alchemy International Ltd, trading as Alchemy Markets, is registered in the Republic of Seychelles with registration number 8429852-1. We are authorized and regulated by the Seychelles Financial Services Authority (FSA) under License No. SD136.
Registered Office: Office 2C, CT House, Providence, Mahe, Seychelles.
Crestmark Trading Ltd, trading as Alchemy Markets is regulated by the Malta Financial Services Authority (MFSA) under License No. IS/56519 for investment services
Registered Office: Portomaso Business Centre, Portomaso PTM 01, St Julian’s STJ 4011, Malta. Company Registration No. C/56519.
Risk Warning:
Trading leveraged products, such as Contracts for Difference (CFDs) and spread betting, carries a high level of risk. These products may not be suitable for everyone. You could lose more than your initial investment, so it’s important to only trade with money you can afford to lose.
Before you start trading, make sure you fully understand the risks involved, as detailed in our Risk Disclosure Statement. It’s your responsibility to ensure that trading these products is legal in your country. If you’re unsure, please check with local authorities before proceeding. We strongly recommend speaking with independent financial, legal, or tax professionals before getting started. Nothing on this website should be considered investment advice or a solicitation from Alchemy Markets.